

Performance of polygenic risk scores in screening, prediction, and risk stratification: secondary analysis of data in the Polygenic Score Catalog
- PMID: 37859783
- PMCID: PMC10582890
- DOI: 10.1136/bmjmed-2023-000554
Performance of polygenic risk scores in screening, prediction, and risk stratification: secondary analysis of data in the Polygenic Score Catalog
Abstract
Objective: To clarify the performance of polygenic risk scores in population screening, individual risk prediction, and population risk stratification.
Design: Secondary analysis of data in the Polygenic Score Catalog.
Setting: Polygenic Score Catalog, April 2022. Secondary analysis of 3915 performance metric estimates for 926 polygenic risk scores for 310 diseases to generate estimates of performance in population screening, individual risk, and population risk stratification.
Participants: Individuals contributing to the published studies in the Polygenic Score Catalog.
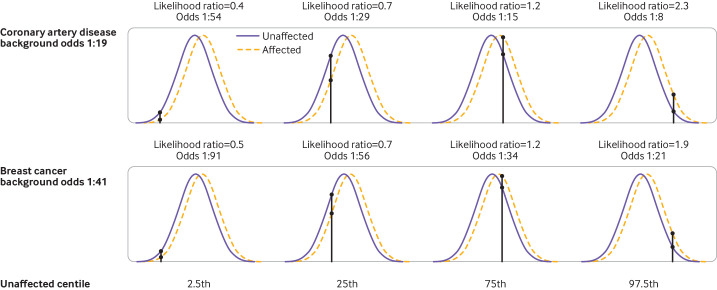
Main outcome measures: Detection rate for a 5% false positive rate (DR5) and the population odds of becoming affected given a positive result; individual odds of becoming affected for a person with a particular polygenic score; and odds of becoming affected for groups of individuals in different portions of a polygenic risk score distribution. Coronary artery disease and breast cancer were used as illustrative examples.
Results: For performance in population screening, median DR5 for all polygenic risk scores and all diseases studied was 11% (interquartile range 8-18%). Median DR5 was 12% (9-19%) for polygenic risk scores for coronary artery disease and 10% (9-12%) for breast cancer. The population odds of becoming affected given a positive results were 1:8 for coronary artery disease and 1:21 for breast cancer, with background 10 year odds of 1:19 and 1:41, respectively, which are typical for these diseases at age 50. For individual risk prediction, the corresponding 10 year odds of becoming affected for individuals aged 50 with a polygenic risk score at the 2.5th, 25th, 75th, and 97.5th centiles were 1:54, 1:29, 1:15, and 1:8 for coronary artery disease and 1:91, 1:56, 1:34, and 1:21 for breast cancer. In terms of population risk stratification, at age 50, the risk of coronary artery disease was divided into five groups, with 10 year odds of 1:41 and 1:11 for the lowest and highest quintile groups, respectively. The 10 year odds was 1:7 for the upper 2.5% of the polygenic risk score distribution for coronary artery disease, a group that contributed 7% of cases. The corresponding estimates for breast cancer were 1:72 and 1:26 for the lowest and highest quintile groups, and 1:19 for the upper 2.5% of the distribution, which contributed 6% of cases.
Conclusion: Polygenic risk scores performed poorly in population screening, individual risk prediction, and population risk stratification. Strong claims about the effect of polygenic risk scores on healthcare seem to be disproportionate to their performance.
Keywords: preventive medicine; public health.
© Author(s) (or their employer(s)) 2023. Re-use permitted under CC BY. Published by BMJ.
Conflict of interest statement
Competing interests: All authors have completed the ICMJE uniform disclosure form at www.icmje.org/disclosure-of-interest/ and declare: support from the British Heart Foundation, University College London (UCL) National Institute for Health and Care Research (NIHR) Biomedical Research Centre, UK Research and Innovation (UKRI)/NIHR funded Multimorbidity Mechanism and Therapeutics Research Collaborative, and NIHR for the submitted work; ADH is a member of the advisory group for the Industrial Strategy Challenge Fund Accelerating Detection of Disease Challenge, and a co-opted member of the National Institute for Health and Care Excellence guideline update group for Cardiovascular disease: risk assessment and reduction, including lipid modification, CG181; ADH is a co-investigator on a grant from Pfizer to identify potential therapeutic targets for heart failure based on human genomics; NJW is a director of Polypill, a company that provides an online cardiovascular disease prevention service accessed on Polypill.com; no financial relationships with any organisations that might have an interest in the submitted work in the previous three years; no other relationships or activities that could appear to have influenced the submitted work.
Figures


References
-
- GOV.UK . Genome UK: the future of healthcare. Available: https://www.gov.uk/government/publications/genome-uk-the-future-of-healt... [Accessed 24 Jan 2022].
Grants and funding
LinkOut - more resources
Full Text Sources
Miscellaneous