. 2023 Sep 29;3(1):vbad137.
doi: 10.1093/bioadv/vbad137. eCollection 2023.

BioNAR: an integrated biological network analysis package in bioconductor

Affiliations

BioNAR: an integrated biological network analysis package in bioconductor

Colin McLean et al. Bioinform Adv. .

Abstract

Motivation: Biological function in protein complexes emerges from more than just the sum of their parts: molecules interact in a range of different sub-complexes and transfer signals/information around internal pathways. Modern proteomic techniques are excellent at producing a parts-list for such complexes, but more detailed analysis demands a network approach linking the molecules together and analysing the emergent architectural properties. Methods developed for the analysis of networks in social sciences have proven very useful for splitting biological networks into communities leading to the discovery of sub-complexes enriched with molecules associated with specific diseases or molecular functions that are not apparent from the constituent components alone.

Results: Here, we present the Bioconductor package BioNAR, which supports step-by-step analysis of biological/biomedical networks with the aim of quantifying and ranking each of the network's vertices based on network topology and clustering. Examples demonstrate that while BioNAR is not restricted to proteomic networks, it can predict a protein's impact within multiple complexes, and enables estimation of the co-occurrence of metadata, i.e. diseases and functions across the network, identifying the clusters whose components are likely to share common function and mechanisms.

Availability and implementation: The package is available from Bioconductor release 3.17: https://bioconductor.org/packages/release/bioc/html/BioNAR.html.


Conflict of interest statement

None declared.

Figures

Figure 1.
Figure 1.
Network analysis pipeline implemented in BioNAR package. Although the process is often interactive, the general flow starts with graph creation and proceeds as illustrated on the left. Each of the steps indicated corresponds to the analysis steps described in Section 2. Colours correspond to the respective processing stages (left).
Figure 2.
Figure 2.
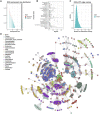
Clustering results for Case Study 1 (MASC network) for six algorithms. The colour code corresponds to the protein functional families described in Pocklington et al. (2006a) as follows: red—channels and receptors, light green—cell adhesion and cytoskeleton, dark green—synaptic vesicles/protein transport, light blue—G-proteins and modulators, purple—MAGUKs/adaptors/scaffolds, and maroon—kinases. Highlighted are only the clusters with significant enrichment (P-value <.05, p.adj).
Figure 3.
Figure 3.
Presynaptic network, analysis results. (A) Clustering results from applying the Louvain algorithm, with clusters (cl) assigned a unique colour. (B) Power-law fit—shown the log–log plot of the CDF of presynaptic PPI network degree distribution [P(k)], versus its degree (k), with the best fitting power-law distribution to the network data highlighted in red. (C) Entropy plot for the presynaptic network. Each protein was perturbed through over-expression (red) and under-expression (green), with the global graph entropy rate (SR) after each protein perturbation being plotted against the log of the protein’s degree. (D) Bridgeness results shown for Louvain algorithm, highlighted are the genes most frequently found in presynaptic compartment. (E) Disease–disease overlap for presynaptic compartment, red dotted line shows the confidence cut-off (q-val <0.05). Abbreviations: Alzheimer disease (AD), Bipolar disorder (BP), Autistic spectral disorder (ASD), Epilepsy (Epi), Parkinson disease (PD), Schizophrenia (SCH), Frontotemporal dementia (FTD), Intellectual Disability (ID), Huntington disease (HD), Multiple sclerosis (MS). (F) Cluster 1 in details with highlighted proteins associated with AD and PD.
Figure 4.
Figure 4.
DGN analysis performed with BioNAR. (A) Distribution of connected component sizes in DGN. Red columns correspond to component sizes in the original network, while green to randomly perturbed networks. Vertical line on the graph corresponds to the size of the giant component of the original DGN it includes 50.8% of nodes. Like in the original Barabasi paper its size (903) is significantly lower (P-value <10–3) than the average size of the giant component (1088 ± 21) in the set of rewired networks. (B) Degree distribution of genes annotated with different disorder classes. It can be seen that high-degree genes come almost exclusively from the disorder class Cancer. A further disorder class ‘Grey’, which also contains high-degree genes, is associated with many disorders (Goh et al. 2007). (C) Number of observed interactions between genes annotated by the same disorder type (vertical line) and distribution of the expected numbers from randomized network. (D) The largest connected component of DGN. Nodes are coloured according to the disorder class.

Similar articles

References

    1. Bánky D, Iván G, Grolmusz V.. Equal opportunity for low-degree network nodes: a PageRank-based method for protein target identification in metabolic graphs. PLoS One 2013;8:e54204. - PMC - PubMed
    1. Barabási AL, Albert R.. Emergence of scaling in random networks. Science 1999;286:509–12. - PubMed
    1. Blondel VD, Guillaume J-L, Lambiotte R. et al. Fast unfolding of communities in large networks. J Stat Mech 2008;2008:P10008.
    1. Chua JJE, Kindler S, Boyken J. et al. The architecture of an excitatory synapse. J Cell Sci 2010;123:819–23. - PubMed
    1. Clauset A, Newman ME, Moore C.. Finding community structure in very large networks. Phys Rev E Stat Nonlin Soft Matter Phys 2004;70:066111. - PubMed