. 2023 Oct 4;3(1):vbad140.
doi: 10.1093/bioadv/vbad140. eCollection 2023.

Identification of disease modules using higher-order network structure

Affiliations

Identification of disease modules using higher-order network structure

Pramesh Singh et al. Bioinform Adv. .

Abstract

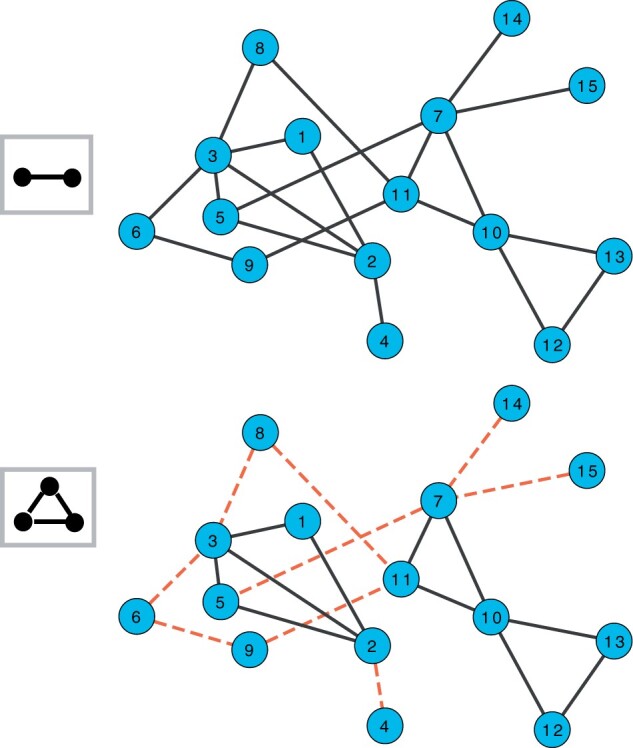
Motivation: Higher-order interaction patterns among proteins have the potential to reveal mechanisms behind molecular processes and diseases. While clustering methods are used to identify functional groups within molecular interaction networks, these methods largely focus on edge density and do not explicitly take into consideration higher-order interactions. Disease genes in these networks have been shown to exhibit rich higher-order structure in their vicinity, and considering these higher-order interaction patterns in network clustering have the potential to reveal new disease-associated modules.

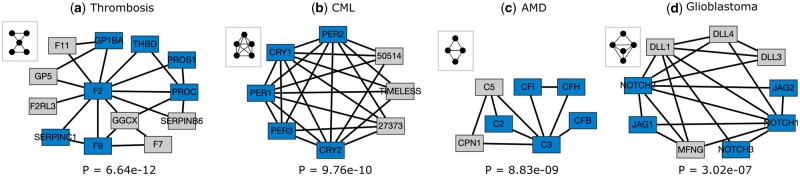
Results: We propose a higher-order community detection method which identifies community structure in networks with respect to specific higher-order connectivity patterns beyond edges. Higher-order community detection on four different protein-protein interaction networks identifies biologically significant modules and disease modules that conventional edge-based clustering methods fail to discover. Higher-order clusters also identify disease modules from genome-wide association study data, including new modules that were not discovered by top-performing approaches in a Disease Module DREAM Challenge. Our approach provides a more comprehensive view of community structure that enables us to predict new disease-gene associations.

Availability and implementation: https://github.com/Reed-CompBio/graphlet-clustering.


Conflict of interest statement

None declared.

Figures

Figure 1.
Figure 1.
All graphlets of size 3 and 4 (G1G8). The distinct edge positions (011) (edge orbits) are shown with a different line style and color.
Figure 2.
Figure 2.
An illustration of graphlet-induced network for G2. Under the standard MCL, transition all edges are allowed and are shown by black lines (top). For graphlet G2 (triangle), red dashed edges represent transitions that are no longer allowed for G2 (bottom).
Figure 3.
Figure 3.
ARI scores for nonredundant (NR) graphlet-induced clustering of the interactomes. A higher ARI indicates a higher level of similarity between the two clusterings.
Figure 4.
Figure 4.
Fraction of pathways from different databases that are significantly associated with at least one module discovered by higher-order clustering. It shows the fractional coverage obtained by G0 (green) and other graphlets Gk (blue) for each interactome. The height of red and orange bars shows what fraction of these pathways are unique to the two sets G0 and Gk, respectively. We note that a pathway can be associated with multiple modules.
Figure 5.
Figure 5.
Number of significantly associated unique diseases from different disease association databases discovered by higher-order clustering. Like in Fig. 4, although each disease can be associated with more than one module, it is counted only once.
Figure 6.
Figure 6.
Disease modules discovered by graphlet-aware community detection using specific graphlets for Thrombosis (a, graphlet G18), Chronic Myeloid Leukemia (b, graphlet G29), Age related macular degeneration (c, graphlet G7), and Glioblastoma (d, graphlet G26). Blue nodes indicate genes present in the DisGeNet disease set and gray nodes are not annotated to the disease. The hypergeometric P-value is indicated below each module.
Figure 7.
Figure 7.
Number of modules significantly associated a GWAS trait (top) and the number of significantly associated GWAS traits found (bottom) in the InWeb interactome using different (nonredundant) graphlet-based clustering. Results obtained by different (nonredundant) graphlet-based clustering are shown in blue and top five methods from DREAM challenge submission are shown in orange whereas green indicates the set of unique associations identified by higher-order graphlets that are not found by any of the G0-based clusters.
Figure 8.
Figure 8.
Modules detected by G29-based and G27-based community detection which are associated with the traits BMI (top) and type 2 diabetes (bottom) with module P-values 1.01e−4 and 7.86e−5, respectively, computed by Pascal (Lamparter et al. 2016) (see Supplementary Table S3). The gene P-values in each module are indicated by different colors. The lighter shades represent smaller gene P-values.

Similar articles

References

    1. Agrawal M, Zitnik M, Leskovec J. Large-scale analysis of disease pathways in the human interactome. In: Pacific Symposium on Biocomputing 2018: Proceedings of the Pacific Symposium, January 3–7, 2018, Big Island of Hawaii, USA. World Scientific, 2018, 111–22. - PMC - PubMed
    1. Agrawal N, Lawler K, Davidson CM. et al. ; INTERVAL. Predicting novel candidate human obesity genes and their site of action by systematic functional screening in drosophila. PLoS Biol 2021;19:e3001255. - PMC - PubMed
    1. Arenas A, Fernández A, Fortunato S. et al. Motif-based communities in complex networks. J Phys A Math Theor 2008;41:224001.
    1. Benjamini Y, Hochberg Y.. Controlling the false discovery rate: a practical and powerful approach to multiple testing. J R Stat Soc Ser B (Methodological) 1995;57:289–300.
    1. Benson AR, Gleich DF, Leskovec J. et al. Higher-order organization of complex networks. Science 2016;353:163–6. - PMC - PubMed