. 2023 Oct 4:14:1173541.
doi: 10.3389/fmicb.2023.1173541. eCollection 2023.

Transcriptional profile reveals the physiological responses to prey availability in the mixotrophic chrysophyte Poterioochromonas malhamensis

Affiliations

Transcriptional profile reveals the physiological responses to prey availability in the mixotrophic chrysophyte Poterioochromonas malhamensis

Mingyang Ma et al. Front Microbiol. .

Abstract

Mixotrophic flagellates, which have diverse nutritional modes and play important roles in connecting the microbial loop with the classical food chain, are ideal models to study the mechanisms of adaptation between different nutritional modes in protists. In their natural ecosystems, mixotrophic flagellates may encounter microalgal prey of different digestibility, which may affect the carbon flow. To date, a molecular biological view of the metabolic processes in the mixotrophic flagellate Poterioochromonas malhamensis during nutritional adaptation and feeding on microalgal prey of different digestibility is still lacking. Accordingly, this study focused on the gene expression differences in P. malhamensis under autotrophy, being fed by the digestible microalga Chlorella sorokiniana GT-1, and being fed by the indigestible microalga C. sorokiniana CMBB-146. Results showed that the growth rate of P. malhamensis under autotrophy was much lower than that when fed by digestible microalgae. Addition of C. sorokiniana CMBB-146 could only increase the growth rate of P. malhamensis in the first 3 days, but the cell concentration of P. malhamensis started to decrease gradually after 4 days. Compared to autotrophic P. malhamensis, total 6,583 and 3,510 genes were significantly and differentially expressed in P. malhamensis fed by digestible microalgae and indigestible microalgae, respectively. Compared to autotrophic cells, genes related to the ribosome, lysosome, glycolysis, gluconeogenesis, TCA cycle, β-oxidation, duplication, and β-1,3-glucan in P. malhamensis grazing on digestible prey were up-regulated, while genes related to light harvesting and key enzymes referring to chlorophyll were down-regulated. Genes related to apoptosis and necrosis in P. malhamensis were up-regulated after grazing on indigestible microalgae compared to the autotrophic group, which we suggest is associated with the up-regulation of genes related to lysosome enzymes. This study provides abundant information on the potential intracellular physiological responses of P. malhamensis during the process of nutritional adaptation.

Keywords: Poterioochromonas malhamensis; feeding behavior; physiology; prey availability; transcriptome.


Conflict of interest statement

The authors declare that the research was conducted in the absence of any commercial or financial relationships that could be construed as a potential conflict of interest.

Figures
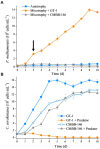
Figure 1
Figure 1
(A) Growth curves of P. malhamensis without prey (autotrophy), fed with digestible prey C. sorokiniana GT-1 (mixotrophy + GT-1), and fed with indigestible prey C. sorokiniana CMBB-146 (mixotrophy + CMBB-146). The arrow denotes the sampling time for transcriptome, i.e., day 2. (B) Growth curves of C. sorokiniana GT-1 without predator (GT-1), C. sorokiniana GT-1 with predator P. malhamensis (GT-1 + predator), C. sorokiniana CMBB-146 without predator (CMBB-146), and C. sorokiniana CMBB-146 with predator P. malhamensis (CMBB-146 + predator). Standard deviation was represented by error bars, some of which were too small to be visible. n = 3.
Figure 2
Figure 2
Effect of culture medium filtrates collected from different treatment groups and different culture times on the feeding ability of P. malhamensis. ‘GT-1’ and ‘CMBB-146’ mean that the culture medium filtrate was collected from the pure culture of C. sorokiniana GT-1 and C. sorokiniana CMBB-146, respectively. ‘GT-1 + Predator’ and ‘CMBB-146 + Predator’ mean that the culture medium filtrate was collected from the co-culture of P. malhamensisC. sorokiniana GT-1 and P. malhamensisC. sorokiniana CMBB-146, respectively. The feeding ability of P. malhamensis was determined by calculating the clearance rate, which was based on the loss rate of thermally inactivated GT-1 cells consumed by P. malhamensis within 36 h. Error bars represent the standard deviation. n = 3.
Figure 3
Figure 3
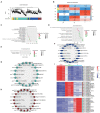
Overview of RNA-seq data under the mixed cultivation of P. malhamensis with two microalgae. (A) Violin plot showing the distribution of log10 transformed TPM mapped reads for each sample. (B) Heatmap of the Pearson’s correlation coefficient matrix between any two samples. (C) PCA plot for the transcriptome of P. malhamensis with or without microalgae mixed culture. P, P. malhamensis under autotrophy; PDA, P. malhamensis fed with digestible prey C. sorokiniana GT-1; PIA, P. malhamensis fed with indigestible prey C. sorokiniana CMBB-146.
Figure 4
Figure 4
Characteristics of the P. malhamensis gene expression changes between any two treatments. (A) Volcano plots showing the fold change (x-axis) of normalized counts and adjusted p-value (y-axis) on the log scale of control versus indigestible microalgae (upper), control versus digestible microalgae (middle), and indigestible versus digestible (lower). Colored dots represent the significantly up-regulated genes (in purple), down-regulated genes (in green), and unaltered genes (in gray). (B) Venn diagrams displaying the number of up- and down-regulated genes that were shared or were specific to each group. (C) Hierarchical clustering analysis performed using the TPM on all the DEGs. Color coding represents the normalized expression value using a z-score, in which blue indicates low expression and red indicates high expression. The dendrograms on the left of the heat map show the hierarchical clustering of DEGs. (D,E) The enriched biological process terms for down-regulated genes and up-regulated genes, respectively. Dot size represents the gene count in enriched terms and the color scale indicates the significance level. P, P. malhamensis under autotrophy; PDA, P. malhamensis fed with digestible prey C. sorokiniana GT-1; PIA, P. malhamensis fed with indigestible prey C. sorokiniana CMBB-146.
Figure 5
Figure 5
KEGG enrichment analysis and visualization of gene expression profile for DEGs. (A) The enriched KEGG pathways of DEGs. The dot size represents the gene count and the color scale represents the adjusted p-value. (B) Heatmaps showing gene expression changes in several enriched major pathways. The color scale represents the z-score normalized gene expression level (red, high expression; blue, low expression). P, P. malhamensis under autotrophy; PDA, P. malhamensis fed with digestible prey C. sorokiniana GT-1; PIA, P. malhamensis fed with indigestible prey C. sorokiniana CMBB-146.
Figure 6
Figure 6
Co-expression gene modules identified by weighted gene co-expression network analysis. (A) Dendrograms of all DEGs clustered into five distinct modules based on a dissimilarity of consensus topological overlap measure. The colored row below the dendrogram shows the modules determined by the dynamic tree cut. Each color represents a module consisting of a group of highly connected genes. (B) Heatmap plot showing the relationships between the module and the trait weight. Each row and column correspond to the module eigengene and the trait weight, respectively. Red coloring represents positive correlation, while blue represents negative correlation. (C–E) GO enrichment analysis for genes in module 1 (M1, C), module 3 (M3, D) and module 5 (M5, E). (F–H) The top 20 hug genes in module 1 (F), module 3 (G) and module 5 (H). (I) Expression profile of the top 20 hub genes in module 1, 3 and 5. Red: high expression; blue: low expression. P, P. malhamensis under autotrophy; PDA, P. malhamensis fed with digestible prey C. sorokiniana GT-1; PIA, P. malhamensis fed with indigestible prey C. sorokiniana CMBB-146.
Figure 7
Figure 7
Different physiological responses of P. malhamensis when grazing on microalgae with different grazing resistance: (A) grazing on digestible microalgae; (B) grazing on indigestible microalgae. The pathway diagram was produced using the online software Figdraw.
Figure 8
Figure 8
Schematic of external organics regulating the metabolism of chrysolaminarin and chlorophyll in P. malhamensis cells. CNGC: cyclic nucleotide gated channel subunit beta 1; CaM: calmodulin; GPCR: G Protein-Coupled Receptors; Gi/Gt: guanine nucleotide-binding protein G(i/t) subunit alpha; AC: adenylate cyclase 1; PKA: protein kinase A; MC: magnesium chelatase; GS: β-glucan synthase; GG: glucan endo-1,3-beta-D-glucosidase. Asterisks mean that the hypothesis has been verified experimentally in P. malhamensis. The pathway diagram was produced using the online software Figdraw.

Similar articles

References

    1. Andrews S. (2010). FastQC: a quality control tool for high throughput sequence data, Babraham Bioinformatics, Babraham Institute, Cambridge, United Kingdom.
    1. Assenov Y., Ramírez F., Schelhorn S.-E., Lengauer T., Albrecht M. (2008). Computing topological parameters of biological networks. Bioinformatics 24, 282–284. doi: 10.1093/bioinformatics/btm554 - DOI - PubMed
    1. Bressan R. A., Handa A. K., Quader H., Filner P. (1980). Synthesis and release of cyclic adenosine 3′: 5′-monophosphate by Ochromonas malhamensis. Plant Physiol. 65, 165–170. doi: 10.1104/pp.65.2.165, PMID: - DOI - PMC - PubMed
    1. Burkholder J. M., Glibert P. M., Skelton H. M. (2008). Mixotrophy, a major mode of nutrition for harmful algal species in eutrophic waters. Harmful Algae 8, 77–93. doi: 10.1016/j.hal.2008.08.010 - DOI
    1. Caron D. A., Alexander H., Allen A. E., Archibald J. M., Armbrust E., Bachy C., et al. . (2017). Probing the evolution, ecology and physiology of marine protists using transcriptomics. Nat. Rev. Microbiol. 15, 6–20. doi: 10.1038/nrmicro.2016.160, PMID: - DOI - PubMed