

Genome-wide association mapping and genomic prediction for late blight and potato cyst nematode resistance in potato (Solanum tuberosum L.)
- PMID: 37860256
- PMCID: PMC10582711
- DOI: 10.3389/fpls.2023.1211472
Genome-wide association mapping and genomic prediction for late blight and potato cyst nematode resistance in potato (Solanum tuberosum L.)
Abstract
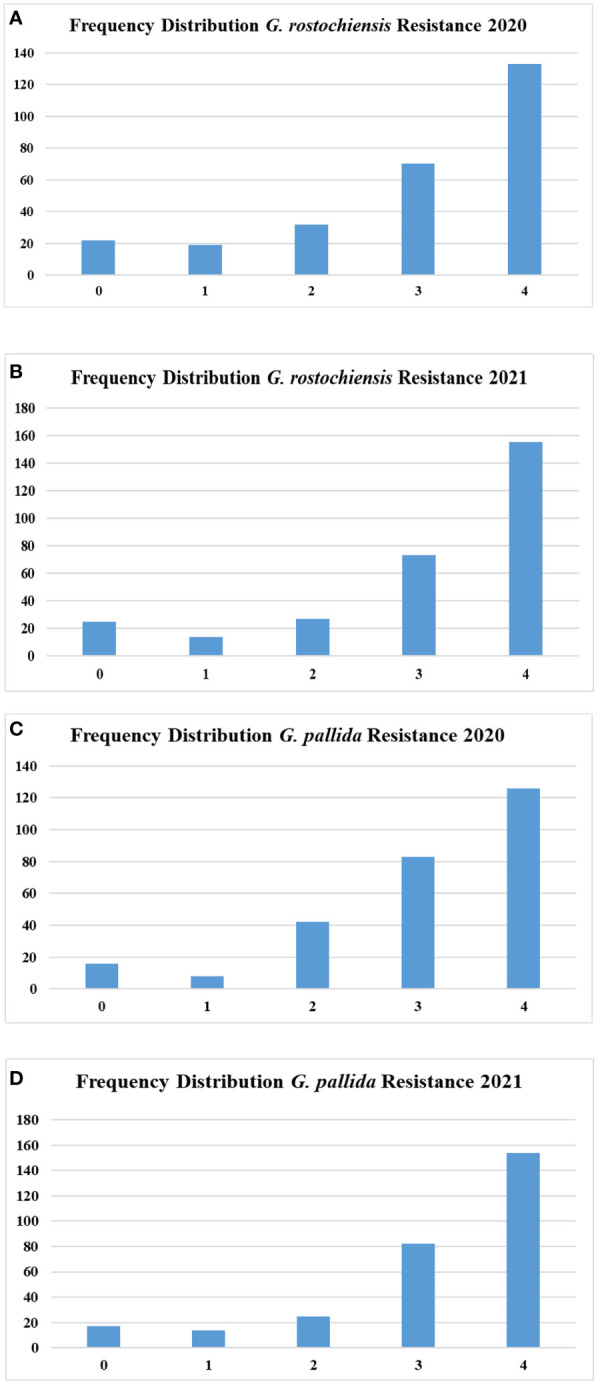
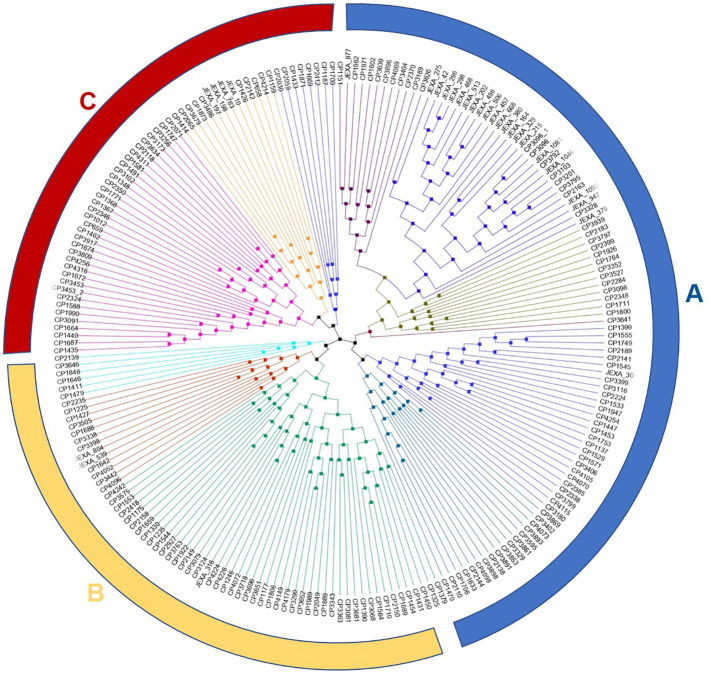
Potatoes are an important source of food for millions of people worldwide. Biotic stresses, notably late blight and potato cyst nematodes (PCN) pose a major threat to potato production worldwide, and knowledge of genes controlling these traits is limited. A genome-wide association mapping study was conducted to identify the genomic regulators controlling these biotic stresses, and the genomic prediction accuracy was worked out using the GBLUP model of genomic selection (GS) in a panel of 222 diverse potato accessions. The phenotype data on resistance to late blight and two PCN species (Globodera pallida and G. rostochiensis) were recorded for three and two consecutive years, respectively. The potato panel was genotyped using genotyping by sequencing (GBS), and 1,20,622 SNP markers were identified. A total of 7 SNP associations for late blight resistance, 9 and 11 for G. pallida and G. rostochiensis, respectively, were detected by additive and simplex dominance models of GWAS. The associated SNPs were distributed across the chromosomes, but most of the associations were found on chromosomes 5, 10 and 11, which have been earlier reported as the hotspots of disease-resistance genes. The GS prediction accuracy estimates were low to moderate for resistance to G. pallida (0.04-0.14) and G. rostochiensis (0.14-0.21), while late blight resistance showed a high prediction accuracy of 0.42-0.51. This study provides information on the complex genetic nature of these biotic stress traits in potatoes and putative SNP markers for resistance breeding.
Keywords: GBS; GEBV; PCN; association mapping; genomic prediction; late blight; snps.
Copyright © 2023 Sood, Bhardwaj, Bairwa, Dalamu, Sharma, Sharma, Kumar, Lal and Kumar.
Conflict of interest statement
The authors declare that the research was conducted in the absence of any commercial or financial relationships that could be construed as a potential conflict of interest.
Figures


References
-
- Byrne S., Meade F., Mesiti F., Griffin D., Kennedy C., Milbourne D. (2020). Genome-wide association and genomic prediction for fry color in potato. Agronomy 10 (1), 90. doi: 10.3390/agronomy10010090 - DOI
-
- Chandel Y. S., Bhadu S. S., Salalia R., Thakur S., Kumar S., Somvanshi V. S., et al. (2020). Prevalence and spread of potato cyst nematodes, Globodera spp. in northern hilly areas of India. Curr. Sci. 118, 1946–1952. doi: 10.18520/cs/v118/i12/1946-1952 - DOI
LinkOut - more resources
Full Text Sources