

A novel prognostic signature and potential therapeutic drugs based on tumor immune microenvironment characterization in breast cancer
- PMID: 37860520
- PMCID: PMC10582509
- DOI: 10.1016/j.heliyon.2023.e20798
A novel prognostic signature and potential therapeutic drugs based on tumor immune microenvironment characterization in breast cancer
Abstract
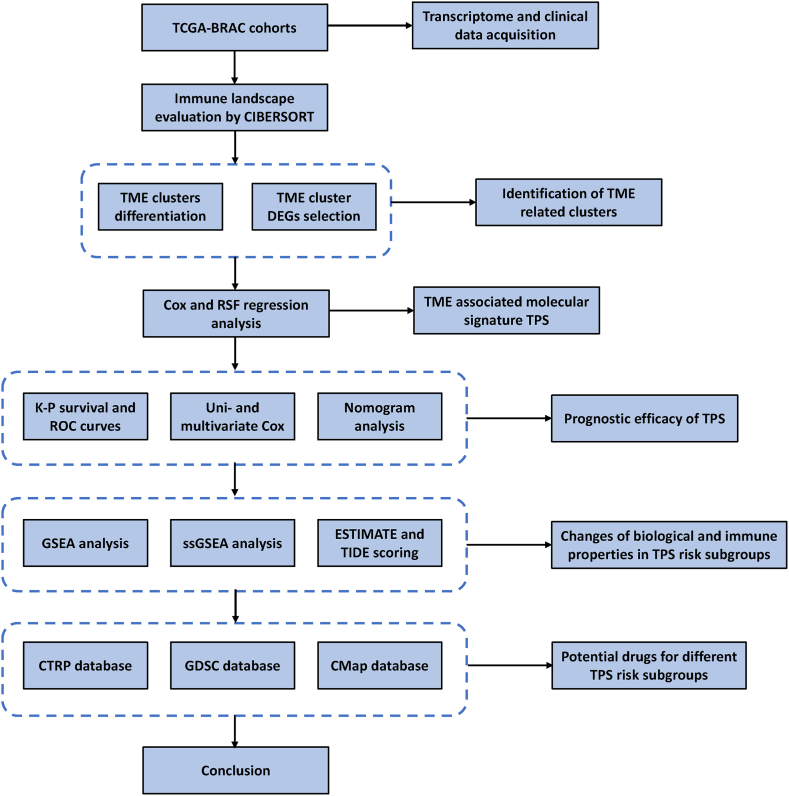
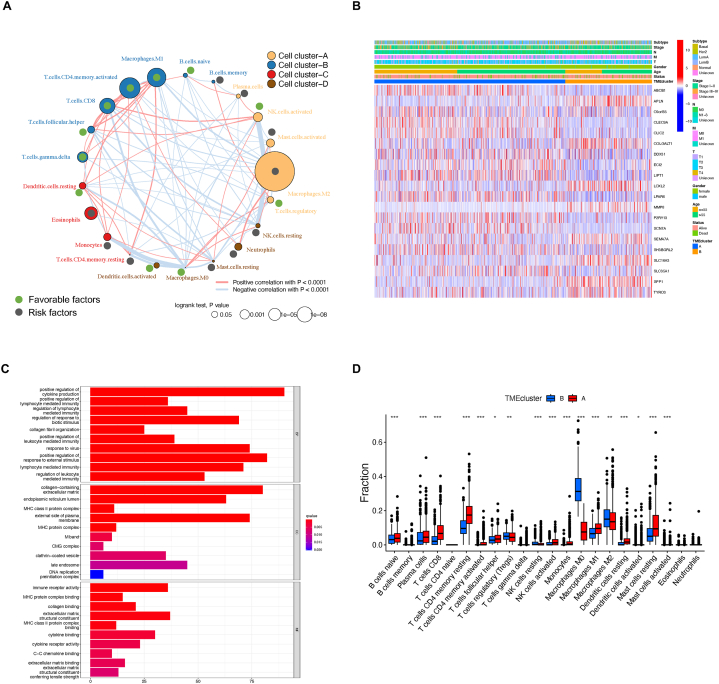
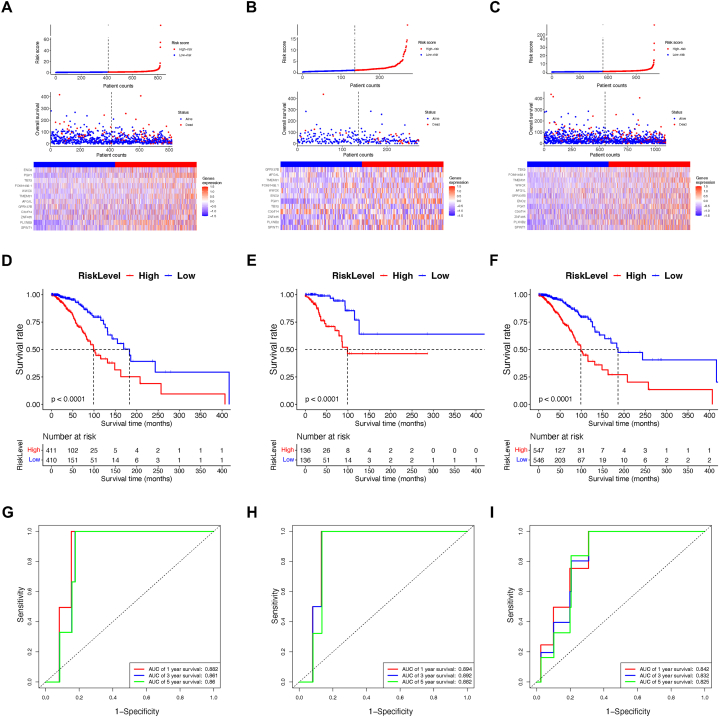
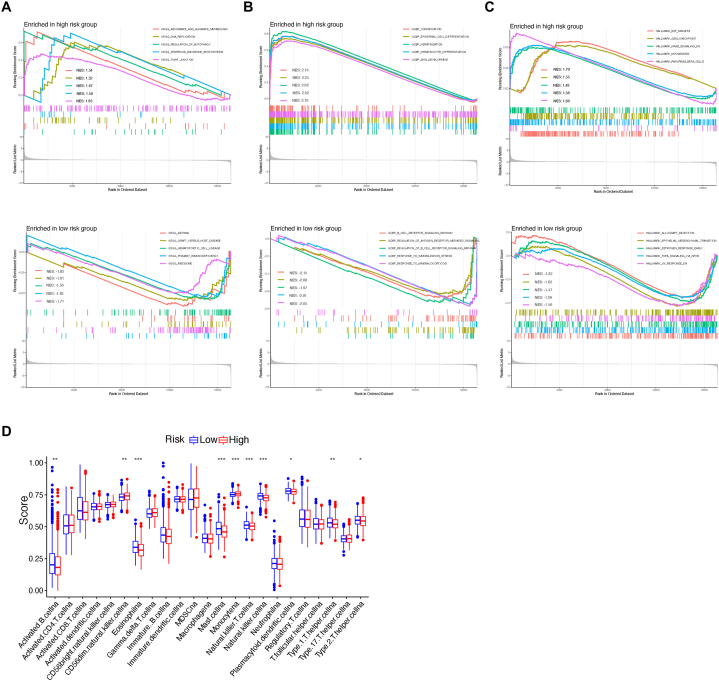
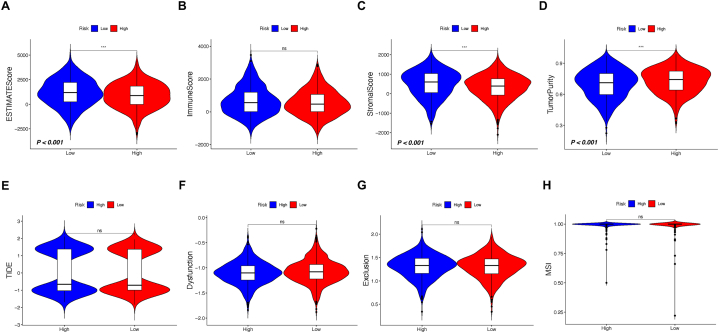
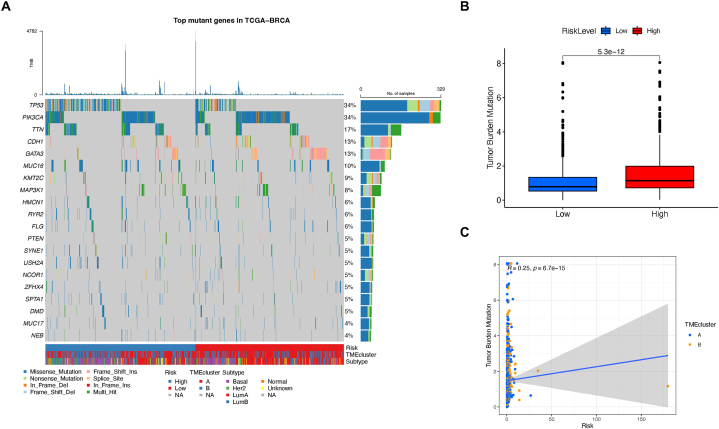
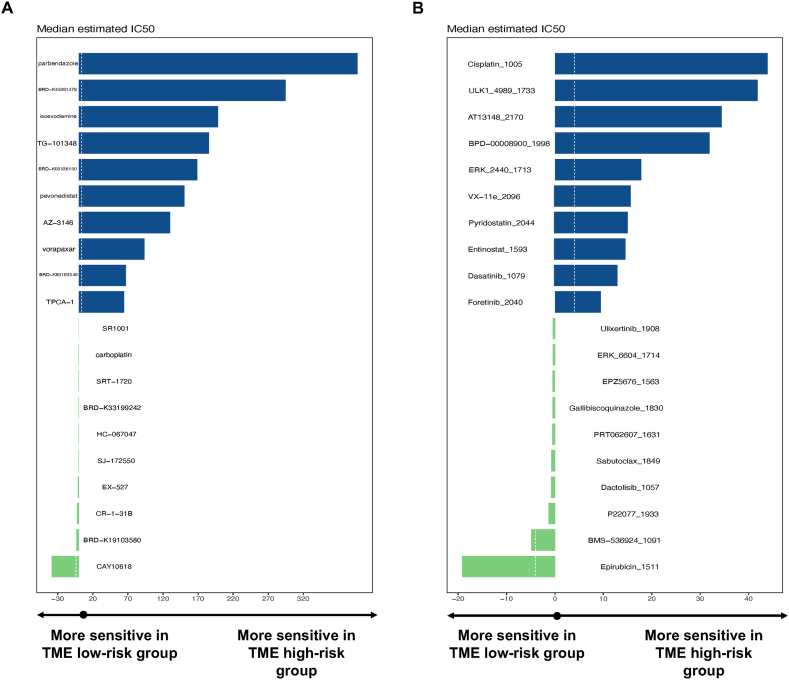
Tumor microenvironment (TME) is closely correlated to the occurrence and progression of breast cancer, however its potentiality in assisting diagnosis and therapeutic decision remains unclear. Therefore, the major aim of this study is to explore the prognostic value of TME related gene in breast cancer. Expression matrices and clinical data of breast cancer obtained from public databases were divided into TME relevant clusters according to immune characterization. A 12-gene molecular classifier was generated through the utilization of differentially expressed genes identified between distinct Tumor Microenvironment (TME) clusters, coupled with correlative regression analysis. The performance of this TME-driven prognostic signature (TPS) were examined across both the training and validation cohorts. Furthermore, our study revealed that breast cancer cases classified as high-risk based on the TPS exhibited the phenotype with elevated immune cell infiltration, higher tumor mutational burden, and a notably worse overall prognostic outcome. To conclude, the novel TME-based TPS was able to serve as a superior prognosis indicator for breast cancer, alone or jointly with other clinical factors. Also, breast cancer patients belong to different risk subgroups of TPS were found potentially suitable for distinguished therapeutic agents, which might improve personalized treatment for breast cancer in the future.
Keywords: Breast cancer; Immune landscape; Potential drugs; Prognostic signature; Tumor microenvironment.
© 2023 The Authors. Published by Elsevier Ltd.
Conflict of interest statement
The authors declare that they have no known competing financial interests or personal relationships that could have appeared to influence the work reported in this paper.
Figures
Similar articles
-
Tumor immune microenvironment of colorectal cancer identifies novel prognostic signature and potential therapeutic drugs.Cancer Biomark. 2024 Dec;41(3):CBM240110. doi: 10.3233/CBM-240110. Cancer Biomark. 2024. PMID: 39973817
-
Development of a tumor microenvironment-related prognostic signature in glioma to predict immune landscape and potential therapeutic drugs.J Biochem Mol Toxicol. 2023 Oct;37(10):e23448. doi: 10.1002/jbt.23448. Epub 2023 Jun 26. J Biochem Mol Toxicol. 2023. PMID: 37365744
-
The Landscape of the Tumor Microenvironment in Skin Cutaneous Melanoma Reveals a Prognostic and Immunotherapeutically Relevant Gene Signature.Front Cell Dev Biol. 2021 Oct 1;9:739594. doi: 10.3389/fcell.2021.739594. eCollection 2021. Front Cell Dev Biol. 2021. PMID: 34660598 Free PMC article.
-
Identification of a novel cuproptosis-related gene signature and integrative analyses in patients with lower-grade gliomas.Front Immunol. 2022 Aug 15;13:933973. doi: 10.3389/fimmu.2022.933973. eCollection 2022. Front Immunol. 2022. PMID: 36045691 Free PMC article. Review.
-
The breast cancer tumor microenvironment and precision medicine: immunogenicity and conditions favoring response to immunotherapy.J Natl Cancer Cent. 2024 Jan 26;4(1):14-24. doi: 10.1016/j.jncc.2024.01.004. eCollection 2024 Mar. J Natl Cancer Cent. 2024. PMID: 39036381 Free PMC article. Review.
References
LinkOut - more resources
Full Text Sources
