Meta-Analysis
. 2023 Oct 4:11:1241401.
doi: 10.3389/fpubh.2023.1241401. eCollection 2023.

The incidence and risk factors of selected drug prescriptions and outpatient care after SARS-CoV-2 infection in low-risk subjects: a multicenter population-based cohort study

Affiliations
Meta-Analysis

The incidence and risk factors of selected drug prescriptions and outpatient care after SARS-CoV-2 infection in low-risk subjects: a multicenter population-based cohort study

Carlo Gagliotti et al. Front Public Health. .

Abstract

Background: Knowledge about the dynamics of transmission of SARS-CoV-2 and the clinical aspects of COVID-19 has steadily increased over time, although evidence of the determinants of disease severity and duration is still limited and mainly focused on older adult and fragile populations.

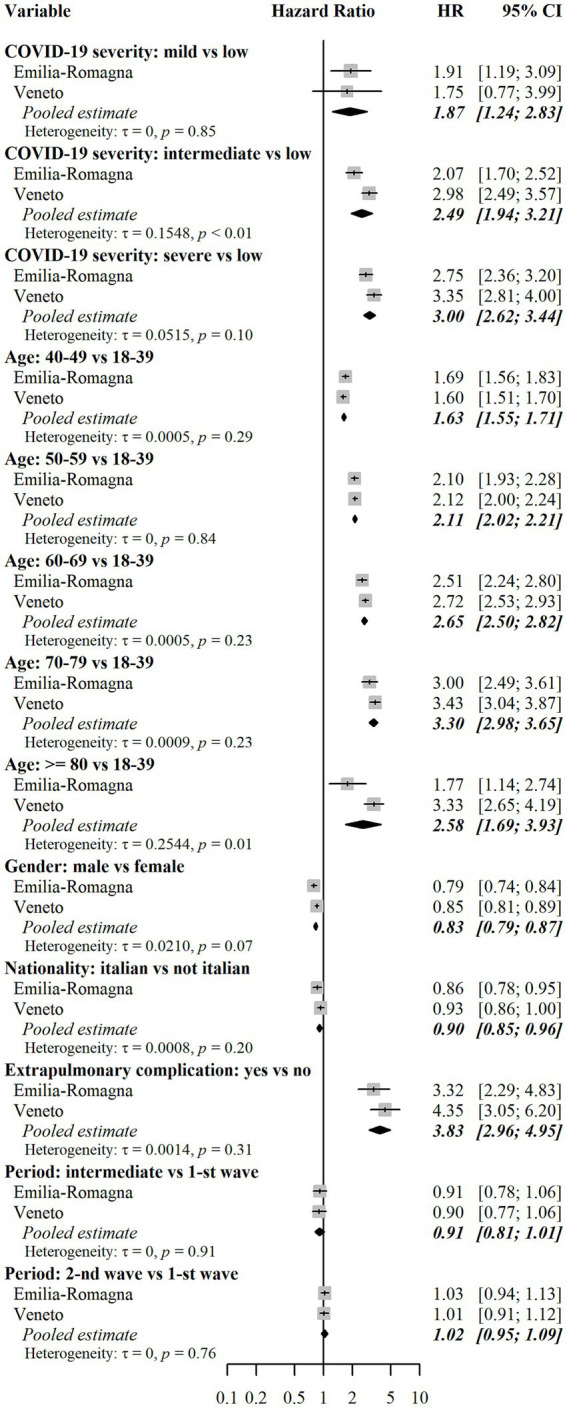
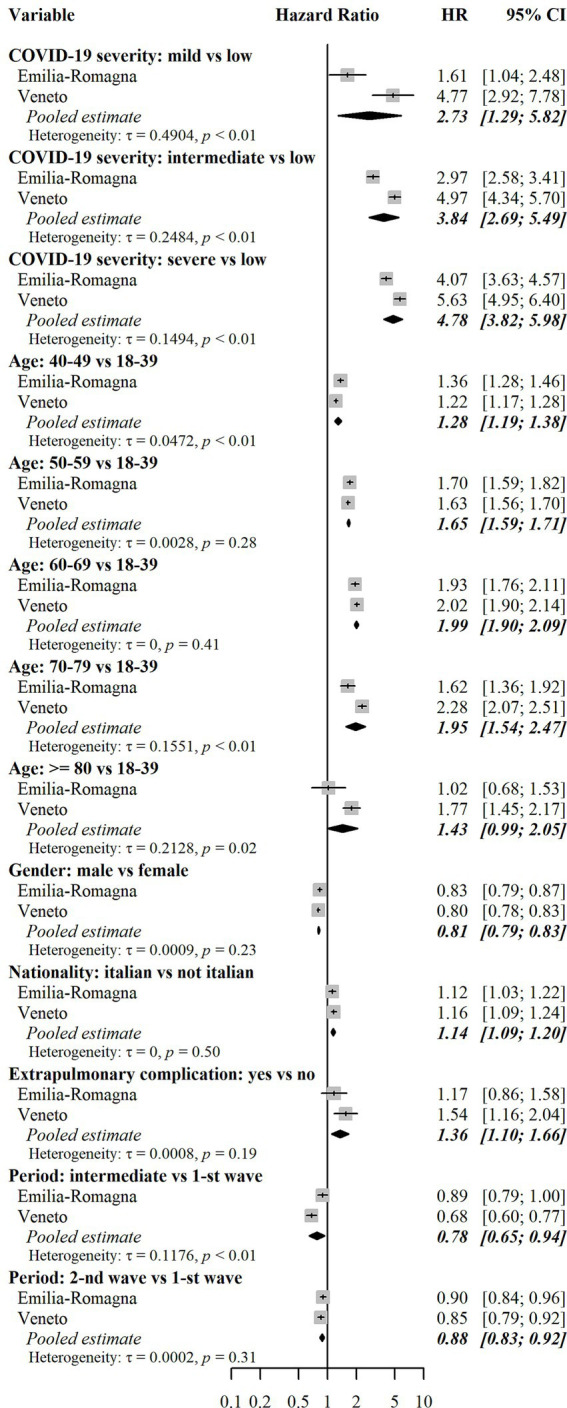
Methods: The present study was conceived and carried out in the Emilia-Romagna (E-R) and Veneto Regions, Italy, within the context of the EU's Horizon 2020 research project called ORCHESTRA (Connecting European Cohorts to increase common and effective response to SARS-CoV-2 pandemic) (www.orchestra-cohort.eu). The study has a multicenter retrospective population-based cohort design and aimed to investigate the incidence and risk factors of access to specific healthcare services (outpatient visits and diagnostics, drug prescriptions) during the post-acute phase from day-31 to day-365 after SARS-CoV-2 infection, in a healthy population at low risk of severe acute COVID-19. The study made use of previously recorded large-scale healthcare data available in the administrative databases of the two Italian Regions. The statistical analysis made use of methods for competing risks. Risk factors were assessed separately in the two Regions and results were pooled using random effects meta-analysis.

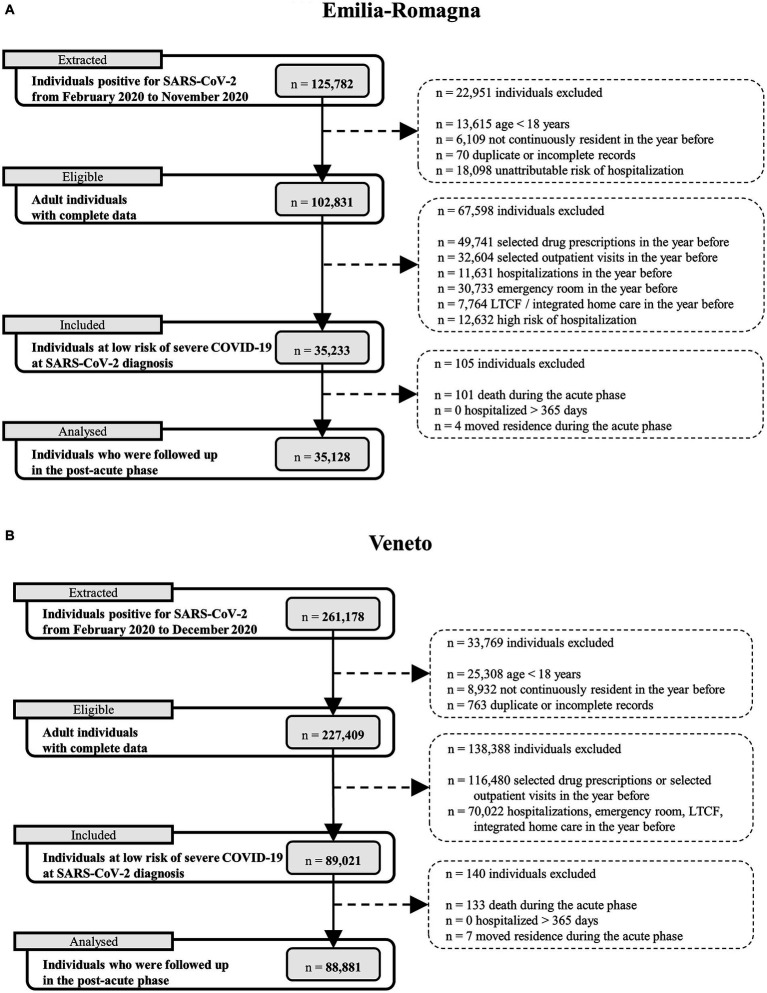
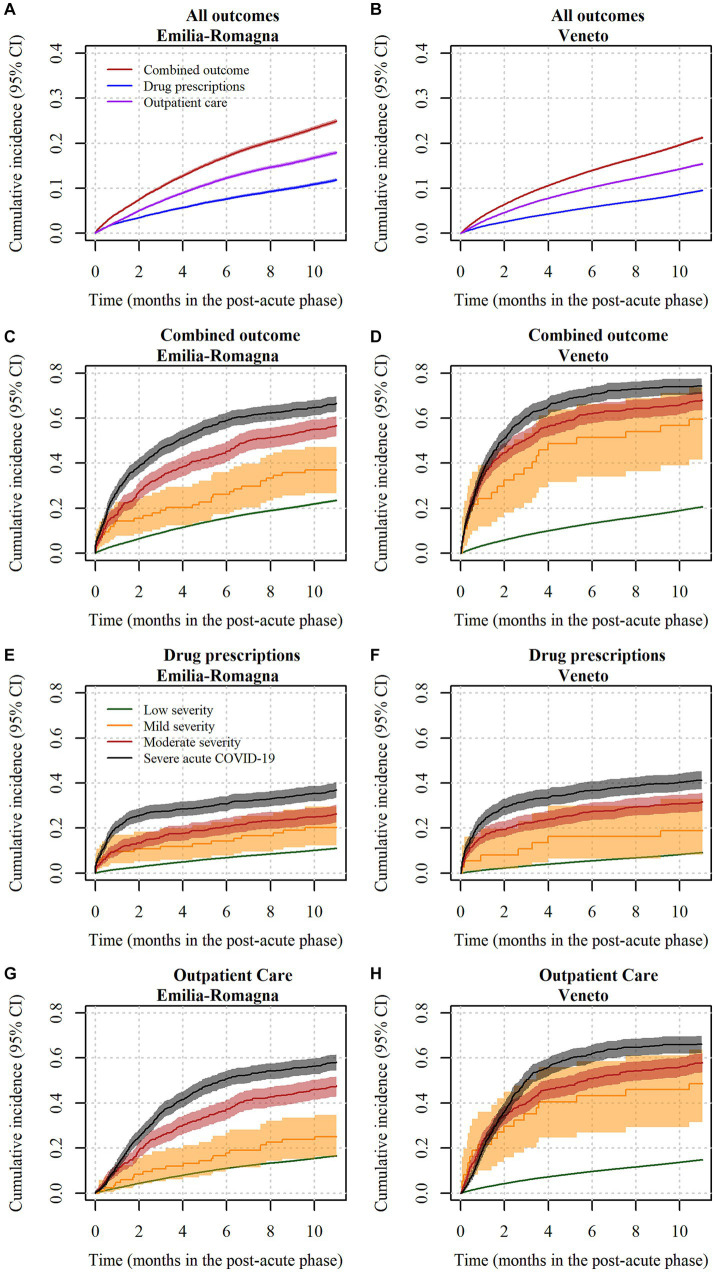
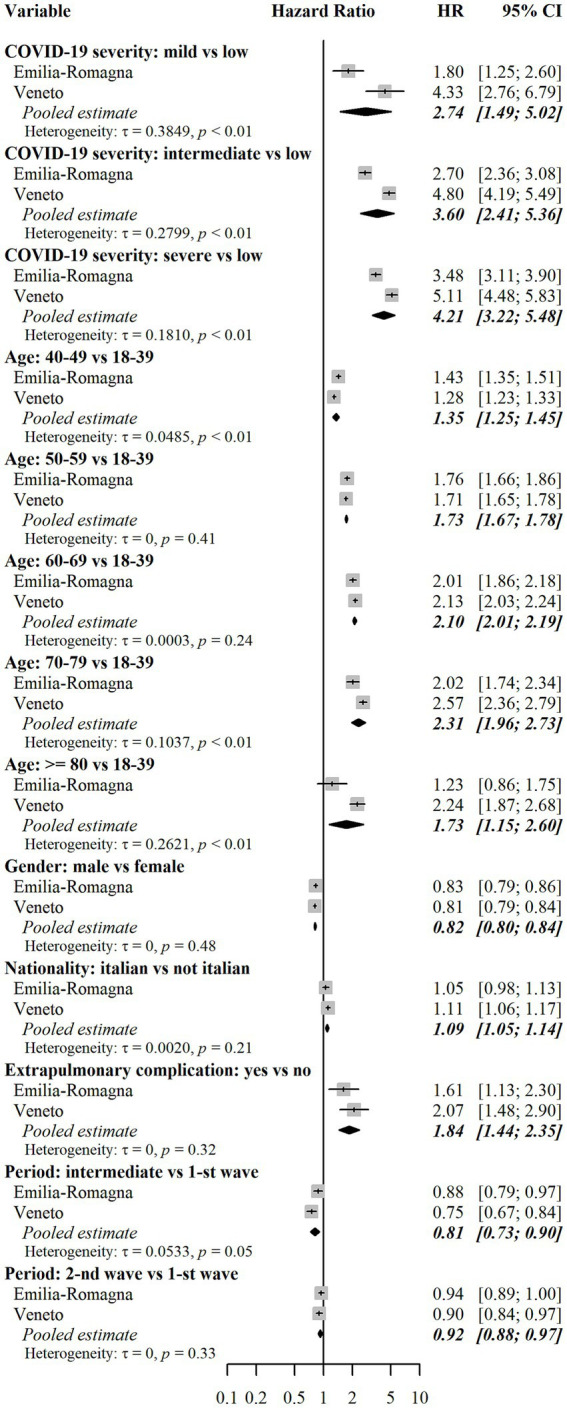
Results: There were 35,128 subjects in E-R and 88,881 in Veneto who were included in the data analysis. The outcome (access to selected health services) occurred in a high percentage of subjects in the post-acute phase (25% in E-R and 21% in Veneto). Outpatient care was observed more frequently than drug prescriptions (18% vs. 12% in E-R and 15% vs. 10% in Veneto). Risk factors associated with the outcome were female sex, age greater than 40 years, baseline risk of hospitalization and death, moderate to severe acute COVID-19, and acute extrapulmonary complications.

Conclusion: The outcome of interest may be considered as a proxy for long-term effects of COVID-19 needing clinical attention. Our data suggest that this outcome occurs in a substantial percentage of cases, even among a previously healthy population with low or mild severity of acute COVID-19. The study results provide useful insights into planning COVID-19-related services.

Keywords: COVID-19 sequelae; ORCHESTRA project; SARS-CoV-2; drug prescriptions; low-risk subjects; outpatient care; population-based cohort; post-COVID.


Conflict of interest statement

The authors declare that the research was conducted in the absence of any commercial or financial relationships that could be construed as a potential conflict of interest.

Figures

Figure 1
Figure 1
Algorithm for the assignment of COVID-19 severity. Notes: The decision tree shows the algorithm for the assignment of COVID-19 severity during the acute phase. The rhombuses indicate binary decision rules based on hospitalizations, respiratory diagnoses, Diagnosis-related groups (continuous border line) and ventilation procedures (dotted border line). The gray boxes indicate the assigned COVID-19 severity level (low, mild, moderate, severe). The data extraction criteria for each element in the decision tree are reported in Supplementary Table 2. LRT = lower respiratory tract; DRG = Diagnosis-related group.
Figure 2
Figure 2
Flow charts describing selection of subjects in the two cohorts. Notes: (A) = Emilia-Romagna Region; (B) = Veneto Region. The total number of excluded individuals is the number of subjects who had at least one of the specific exclusion criteria listed in the flow-chart.
Figure 3
Figure 3
Cumulative incidence curves of drug prescriptions and outpatient care in subjects at low risk of severe COVID-19 disease, by COVID-19 severity. Notes: (A) = incidence of outcomes in Emilia-Romagna; (B) = incidence of outcomes in Veneto; (C) = incidence of the combined outcome in Emilia-Romagna, by COVID-19 severity; (D) = incidence of the combined outcome in Veneto, by COVID-19 severity; (E) = incidence of selected drug prescriptions in Emilia-Romagna, by COVID-19 severity; (F) = incidence of selected drug prescriptions in Veneto, by COVID-19 severity; (G) = incidence of selected outpatient care in Emilia-Romagna, by COVID-19 severity; (H) = incidence of selected outpatient care in Veneto, by COVID-19 severity. In sub-figures (A) and (B), red lines indicate the composite outcome, blue lines indicate the drug prescription outcome, and purple lines indicate the outpatient care outcome. In sub-figures from (C–H), green lines indicate low severity subjects, yellow lines indicate mild severity subjects, red lines indicate moderate severity subjects and black lines indicate severe subjects. In all sub-figures, lines indicate punctual estimates of the cumulative incidence function and areas represent 95% confidence intervals. Confidence intervals were calculated with the asymptotic Aalen method. CI = confidence interval.
Figure 4
Figure 4
Assessment of risk factors for the combined outcome. Notes: Results for each cohort were estimated using multivariable Fine-Gray subdistribution hazard models. Confidence intervals for hazard ratios in the two cohorts were calculated with the Wald method based on normal approximation and were two-sided. Pooled results were estimated using random effects meta-analysis with inverse variance weights and maximum likelihood estimator for between-study variance. The models also included the following independent variables: risk of hospitalization and death score (only in the E-R cohort), and Local Health Units (8 in E-R and 9 in Veneto). Additional results for these variables are reported in Supplementary Table 4. The combined outcome includes selected drug prescriptions and selected outpatient care, whichever came first. Heterogeneity was measured with the tau (τ) statistic and its significance was assessed with the Cochran’s Q test. HR = subdistribution hazard ratio. CI = confidence interval. p = p-value.
Figure 5
Figure 5
Assessment of risk factors for drug prescriptions. Notes: Results for each cohort were estimated using multivariable Fine-Gray subdistribution hazard models. Confidence intervals for hazard ratios in the two cohorts were calculated with the Wald method based on normal approximation and were two-sided. Pooled results were estimated using random effects meta-analysis with inverse variance weights and maximum likelihood estimator for between-study variance. The models also included the following independent variables: risk of hospitalization and death score (only in the E-R cohort), and Local Health Units (8 in E-R and 9 in Veneto). Additional results for these variables are reported in Supplementary Table 4. Heterogeneity was measured with the tau (τ) statistic and its significance was assessed with the Cochran’s Q test. HR = subdistribution hazard ratio. CI = confidence interval. p = p-value.
Figure 6
Figure 6
Assessment of risk factors for outpatient care. Results for each cohort were estimated using multivariable Fine-Gray subdistribution hazard models. Confidence intervals for hazard ratios in the two cohorts were calculated with the Wald method based on normal approximation and were two-sided. Pooled results were estimated using random effects meta-analysis with inverse variance weights and maximum likelihood estimator for between-study variance. The models also included the following independent variables: risk of hospitalization and death score (only in the E-R cohort), and Local Health Units (8 in E-R and 9 in Veneto). Additional results for these variables are reported in Supplementary Table 4. Heterogeneity was measured with the tau (τ) statistic and its significance was assessed with the Cochran’s Q test. HR = subdistribution hazard ratio. CI = confidence interval. p = p-value.

References

    1. Lambert H, Gupte J, Fletcher H, Hammond L, Lowe N, Pelling M, et al. . COVID-19 as a global challenge: towards an inclusive and sustainable future. Lancet Planet Health. (2020) 4:e312–4. doi: 10.1016/S2542-5196(20)30168-6, PMID: - DOI - PubMed
    1. Adeloye D, Elneima O, Daines L, Poinasamy K, Quint JK, Walker S, et al. . The long-term sequelae of COVID-19: an international consensus on research priorities for patients with pre-existing and new-onset airways disease. Lancet Respir Med. (2021) 9:1467–78. doi: 10.1016/S2213-2600(21)00286-1, PMID: - DOI - PMC - PubMed
    1. Nittas V, Gao M, West EA, Ballouz T, Menges D, Hanson SW, et al. . Long COVID through a public health Lens: an umbrella review. Public Health Rev. (2022) 43:1604501. doi: 10.3389/phrs.2022.1604501, PMID: - DOI - PMC - PubMed
    1. Nguyen NN, Hoang VT, Dao TL, Dudouet P, Eldin C, Gautret P. Clinical patterns of somatic symptoms in patients suffering from post-acute long COVID: a systematic review. Eur J Clin Microbiol Infect Dis. (2022) 41:515–45. doi: 10.1007/s10096-022-04417-4, PMID: - DOI - PMC - PubMed
    1. Stavem K, Ghanima W, Olsen MK, Gilboe HM, Einvik G. Persistent symptoms 1.5-6 months after COVID-19 in non-hospitalised subjects: a population-based cohort study. Thorax. (2021) 76:405–7. doi: 10.1136/thoraxjnl-2020-216377, PMID: - DOI - PMC - PubMed

Publication types