. 2023 Oct 4:11:1265407.
doi: 10.3389/fcell.2023.1265407. eCollection 2023.

The highly and perpetually upregulated thyroglobulin gene is a hallmark of functional thyrocytes

Affiliations

The highly and perpetually upregulated thyroglobulin gene is a hallmark of functional thyrocytes

Simon Ullrich et al. Front Cell Dev Biol. .

Erratum in

Abstract

Abnormalities are indispensable for studying normal biological processes and mechanisms. In the present work, we draw attention to the remarkable phenomenon of a perpetually and robustly upregulated gene, the thyroglobulin gene (Tg). The gene is expressed in the thyroid gland and, as it has been recently demonstrated, forms so-called transcription loops, easily observable by light microscopy. Using this feature, we show that Tg is expressed at a high level from the moment a thyroid cell acquires its identity and both alleles remain highly active over the entire life of the cell, i.e., for months or years depending on the species. We demonstrate that this high upregulation is characteristic of thyroglobulin genes in all major vertebrate groups. We provide evidence that Tg is not influenced by the thyroid hormone status, does not oscillate round the clock and is expressed during both the exocrine and endocrine phases of thyrocyte activity. We conclude that the thyroglobulin gene represents a unique and valuable model to study the maintenance of a high transcriptional upregulation.

Keywords: gene upregulation; thyroglobulin gene; thyroid hormones; transcription; transcription loop.


Conflict of interest statement

The authors declare that the research was conducted in the absence of any commercial or financial relationships that could be construed as a potential conflict of interest.

Figures
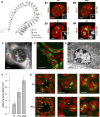
FIGURE 1
FIGURE 1
Transcription loops. (A) Schematics of a transcription loop (TL) formed by RNAPIIs moving along a gene and carrying nascent RNA transcripts. (B) Visualization of four thyroid-specific genes by RNA-FISH. In contrast to the lowly expressed genes Tshr and Mct8 (B1, B2), the other two genes, Tpo and Tg (B3, B4), exhibit larger TLs with sizes correlated to their expression levels. Length and expression level of the genes are indicated on the left and right of the panels, respectively. For better comparison, TLs are shown as grey scale images in the insertions. Note, that in case of the Mct8 gene located on X chromosome, there is only one signal, because the tissue originated from a male mouse. For the number of analysed nuclei, see Table 1. (C) RNA-FISH with an oligoprobe for Tg mRNA labels TLs (green arrows), single mRNAs in the nucleoplasm (green arrowheads) and in the cytoplasm (red asterisk). (D,E) Immunostaining of TG (green) highlights the cytoplasm of thyrocytes (D), which is densely packed with remarkably hypertrophic cisterns (C) of endoplasmic reticulum (E). (F) Histogram showing comparative Tg transcript levels in thyroids of young mice (P1 and P14) in comparison to adult mice. Since thyroid tissue includes 40% of non-thyrocyte cells, as well as chunks of practically inseparable parathyroid gland, the qPCR values were normalized to the transcription level of the thyroid specific transcription factor Pax8 to avoid erroneous results. Error bars are SDM, three biological replicates were analyzed per developmental stage The observed changes were not significant (p > 0.05) as determined by one-way ANOVA with Tukey’s multiple comparisons post hoc. (G) Examples of thyrocytes from P1 (top) and P14 (bottom) thyroids. The left column shows follicles formed by thyrocytes with various degree of Tg TL development; the right and middle columns show thyrocytes at a higher magnification with fully or underdeveloped Tg TLs. Arrows point at nuclei with underdeveloped loops. Note that in some nuclei only one allele is active. For P1 and P14, image stacks of about 50 and 70 nuclei, respectively, were acquired. Images on B-D and G are projections of 3–5 µm confocal stacks; RNA-FISH and immunostaining signals are green; nuclei are counterstained with DAPI (red). Scale bars: B, C, E, 2 μm; D, 70 μm; G, follicle overviews on the left, 10 μm, zoomed in nuclei, 5 µm.
FIGURE 2
FIGURE 2
Thyroglobulin TLs are a peculiarity of thyrocytes from all major vertebrate groups. RNA-FISH with species-specific probes hybridizing to nascent RNA transcripts of thyroglobulin genes reveals TLs in all studied species. The left column shows thyroid follicles; the mid column shows representative thyrocyte nuclei at a higher magnification, the right column shows close-ups of Tg TLs of the middle column as greyscale images. Note that even the shortest among vertebrates, zebrafish tg with a length of only 68 kb, forms TLs resolvable by light microscopy. For the number of analyzed nuclei for each species, see Table 1. RNA-FISH signals (green), DAPI (red); images are projections of confocal 3–6 µm stacks. Scale bars: left column, 10 μm; mid column, 2 μm; right column, 1 µm.
FIGURE 3
FIGURE 3
Thyroglobulin TLs in other vertebrates exhibit the key features of TLs. (A,B) As exemplified by simultaneous RNA- and DNA-FISH for human (A) and chicken (B) thyroglobulin, their TLs are open loops with visibly separated flanks. Images on the left show thyrocyte nuclei (red) with entire TLs (green). Mid images show the same TLs in green and the two flanks in blue (5′) and red (3′). Images on the right, for better demonstration of flank separation, show the same nuclei (blue) and the two flanks in green (5′) and red (3′). (C,D) As exemplified by RNA-FISH for human (C) and zebrafish (D) thyroglobulin genes, genomic probes highlighting introns, label TLs sequentially as a result of a co-transcriptional splicing. Left images show thyrocyte nuclei (red) with entire TLs (green). Mid images show the same TLs after hybridization with mid (green), 5’ (blue) and 3’ (red) BACs (C). For zebrafish tg, only two BACs were used, one covering the whole gene (green) and one—its 3′ half (red) (D). Images on the right show TLs at a higher magnification with the same colour code. Between 20 and 40 nuclei were acquired for each of the experiments. Schematics of genes and used BACs are shown above every panel. Images are projections of confocal stacks through 6 µm (A,C), 3.5 µm (B) and 2.5 µm (D). Scale bars: A-D, 5 μm; right panels on C and B, 2 µm.
FIGURE 4
FIGURE 4
Mouse (A) and human (B) thyroid organoids grafted into mouse kidney. Cells of grafted follicles, generated from mouse male ESCs, can be distinguished from female mouse host cells by DNA-FISH with a Y chromosome-specific probe (red). The dotted line in (A1) separates host kidney cells from thyrocytes of follicles. Note the high extension of Tg and TG TLs in comparison to TLs formed by these genes in cultured follicles (compare to Supplementary Figure S2). 30 and 32 stacks were acquired from mouse and human grafted thyroid organoids, respectively. Thyroglobulin TLs are green; DAPI is blue in (A) and red in (B). Images are projections of confocal 4 µm stacks (A1,B1) and 2.5 µm (A2,A3,B2,B3). Scale bars: (A1,B) 25 μm, (A2) 10 μm, (A3) 5 μm, (B2,B3) 2.5 µm.
FIGURE 5
FIGURE 5
Thyroidal TH status does not influence Tg expression. (A) Simplified schematics of the hypothalamus-pituitary-thyroid axis. TH, thyroid hormones; THRB, TH receptor; TRH, hypothalamic thyrotropin-releasing hormone; TRHR1, thyrotropin-releasing hormone receptor; TSH, thyroid stimulating hormone; TSHR, thyroid stimulating hormone receptor. (B–D) Results of qPCR detecting levels of Tg expression (left panels) and RNA-FISH detecting Tg TLs (right panels) at a decreased (B) and increased (C–D) TH production in comparison to control mice. Tg transcript levels were normalized to the transcription level of the thyroid specific transcription factor Pax8 (see explanation in Figure 1F legend). Three biological replicates were analyzed per gene. All observed changes were not significant (p > 0.05) as determined by Wilcoxon rank sum test. For each of the conditions, two replicates were used for microscopy; between 20 and 30 confocal stacks with one or two nuclei were acquired. For more examples of nuclei, see Supplementary Figure S5. Bars in graphs are SDM. Tg TLs, green; DAPI, red; images are projections of 2–3 µm confocal stacks; scale bars: 5 µm.
FIGURE 6
FIGURE 6
Expression of the Tg gene is not regulated by circadian activity and intron retention. (A) Schematics of a thyrocyte with two phases depicted - exocrine (right) and endocrine (left). (B) Diagram showing light: dark schedule (grey numbers) and time points (black numbers) of thyroid sampling for the circadian activity experiment. (C) Results of qPCR detecting levels of Tg expression indicate that there is no significant difference between the four time points. Bars are SDM. Expression levels were normalized to the 01:30 time point. Three biological replicates were analyzed per time point. The observed changes were not significant (p > 0.05) as determined by one-way ANOVA with Tukey’s multiple comparisons post hoc. (D) Typical examples of thyrocyte nuclei after RNA-FISH detecting Tg TLs at four time points. Tg TLs, green; DAPI, red; images are projections of 3 µm confocal stacks; scale bars: 5 µm. For each of the three replicates at each time-point, between 40 and 50 confocal stacks were acquired. For more examples of nuclei, see Supplementary Figure S6. (E) Results of Nano-pore sequencing of poly(A) fraction for the Tg gene. RNA-seq read coverage (black columns) across the gene locus (blue). The read coverage is ranging between 0 and 3,146; only exon gene regions coincide with reads. For better presentation, the Tg gene is divided in two-halves that are shown one under the other.

References

    1. Antonica F., Kasprzyk D. F., Opitz R., Iacovino M., Liao X. H., Dumitrescu A. M., et al. (2012). Generation of functional thyroid from embryonic stem cells. Nature 491, 66–71. 10.1038/nature11525 - DOI - PMC - PubMed
    1. Braunschweig U., Barbosa-Morais N. L., Pan Q., Nachman E. N., Alipanahi B., Gonatopoulos-Pournatzis T., et al. (2014). Widespread intron retention in mammals functionally tunes transcriptomes. Genome Res. 24, 1774–1786. 10.1101/gr.177790.114 - DOI - PMC - PubMed
    1. Coclet J., Foureau F., Ketelbant P., Galand P., Dumont J. E. (1989). Cell population kinetics in dog and human adult thyroid. Clin. Endocrinol. (Oxf) 31, 655–665. 10.1111/j.1365-2265.1989.tb01290.x - DOI - PubMed
    1. Cremer M., Grasser F., Lanctot C., Muller S., Neusser M., Zinner R., et al. (2008). Multicolor 3D fluorescence in situ hybridization for imaging interphase chromosomes. Methods Mol. Biol. 463, 205–239. 10.1007/978-1-59745-406-3_15 - DOI - PubMed
    1. Crockford S. J. (2009). Evolutionary roots of iodine and thyroid hormones in cell-cell signaling. Integr. Comp. Biol. 49, 155–166. 10.1093/icb/icp053 - DOI - PubMed