

Senescent Schwann cells induced by aging and chronic denervation impair axonal regeneration following peripheral nerve injury
- PMID: 37860842
- PMCID: PMC10701627
- DOI: 10.15252/emmm.202317907
Senescent Schwann cells induced by aging and chronic denervation impair axonal regeneration following peripheral nerve injury
Abstract
Following peripheral nerve injury, successful axonal growth and functional recovery require Schwann cell (SC) reprogramming into a reparative phenotype, a process dependent upon c-Jun transcription factor activation. Unfortunately, axonal regeneration is greatly impaired in aged organisms and following chronic denervation, which can lead to poor clinical outcomes. While diminished c-Jun expression in SCs has been associated with regenerative failure, it is unclear whether the inability to maintain a repair state is associated with the transition into an axonal growth inhibition phenotype. We here find that reparative SCs transition into a senescent phenotype, characterized by diminished c-Jun expression and secretion of inhibitory factors for axonal regeneration in aging and chronic denervation. In both conditions, the elimination of senescent SCs by systemic senolytic drug treatment or genetic targeting improved nerve regeneration and functional recovery, increased c-Jun expression and decreased nerve inflammation. This work provides the first characterization of senescent SCs and their influence on axonal regeneration in aging and chronic denervation, opening new avenues for enhancing regeneration and functional recovery after peripheral nerve injuries.
Keywords: Schwann cell; aging; chronic denervation; nerve regeneration; senescence.
© 2023 The Authors. Published under the terms of the CC BY 4.0 license.
Conflict of interest statement
The authors declare that they have no conflict of interest.
Figures

- A
Schematic representation of the sciatic nerve transection model. The sciatic nerve divides into three branches, the tibial, peroneal and sural nerves (upper panel). The tibial branch is first transected (Tibial Nerve Transection, TN‐T) and the distal stump is sutured to the nearest muscle to prevent reconnection (middle panel). The time of denervation until analysis of the tissue defines acute (Acu‐D) or chronic (Chr‐D) denervation. To evaluate regeneration, the distal tibial nerve is detached from the muscle and reconnected to the freshly transected common peroneal nerve (Tibial Nerve reconnection, TN‐R, bottom panel).
- B
c‐Jun expression in the nucleus of SC on longitudinal cryostat sections of adult and aged mice sciatic nerves. We compared non‐damaged nerves, and sciatic nerves distal to the nerve cut in acute (7 dpi) and chronic (42 dpi) denervation conditions. N = 3–5 animals per group. One‐way ANOVA and Fisher's LSD multicomparison post‐test.
- C
Representative western blot against c‐Jun comparing Acu‐D in adult mice (N = 5) to Acu‐D in aged mice (N = 4) and to Chr‐D in adult mice (N = 3).
- D
The scheme in the upper left show the timeline for transection and reconnection surgeries to evaluate axonal regeneration. Comparison of axonal density and distance 7 days after reconnection surgery in aged (N = 4) and adult mice with Acu‐D (N = 5), or adult mice with Chr‐D (N = 3). Multiple t‐test for each distance point (x‐axis) was performed, comparing the difference among Acu‐D in adult versus aged mice (#), and adult mice with Acu‐D versus Chr‐D (*). Significative differences are shown with symbols, and the exact P‐values can be seen in Appendix Table S1. Data is presented as mean ± SEM. Representative IF images of reconnected sciatic nerves are shown to the right using SCG10 marker in green. Arrowheads indicate the reconnection site (see Materials and Methods for details). The dataset used for this panel (D) corresponds to control conditions of the experiment shown in Fig 5B–D. Scale bar, 500 μm.
- E, G
Brightfield and fluorescence confocal acquisition of β‐galactosidase activity in adult and aged animals, measured on longitudinal sections from non‐damaged and Chr‐D damaged nerves, distal to the injury. Scale bar, 42 μm. N = 5 animals per group. Complete nerves in brightfield can be seen in Fig EV1.
- F, H
Immunofluorescence against p16INK4a and SOX10 in contralateral non‐injured nerves and chronically transected sciatic nerves from adult and aged mice. Scale bar, 50 μM. Quantification of p16INK4a‐positive SC correspond to N = 3 mice per condition. One‐way ANOVA and Fisher's LSD multicomparison post‐test.
- I
Quantification of total p16INK4a‐positive cells in contralateral non injured nerves and damaged nerves from adult animals (N = 3 mice per condition with 4 micrographs per animal each).
- J
Proportion of different p16INK4a‐positive cell types in uninjured and injured nerves from adult and aged mice (N = 3). The total 100% percent of each condition corresponds to total p16INK4a+ cells quantified in (I). Detailed quantification and immunofluorescence for each cell type can be seen in Fig EV2.
- K, L
Fluorescence confocal acquisition and quantification of β‐galactosidase activity assay on longitudinal sections of injured sciatic nerves, distal to the nerve cut, after acute denervation in adult wild type and c‐Jun OE animals. N = 3 or 4 mice. Scale bar, 40 μM.
- M, N
Immunofluorescent staining against p16INK4a in distal sciatic nerves after chronic denervation in adult wild type and c‐Jun OE animals. Scale bar, 40 μM. Quantification of p16INK4a‐positice Schwann cells shown in (M) are quantified in (N). N = 3 animals per group.

- A, B
Representative IF confocal images (SOX10, magenta; c‐Jun, red; DAPI, blue) on longitudinal cryostat sections of adult and aged mice sciatic nerves 7, 21 and 42 dpi. The quantification graph shows the % of c‐Jun positive nuclei of SCs Scale bar, 100 μM.
- C
Representative brightfield images of β‐galactosidase activity on non‐injured nerves, and transected nerves at different times points after damage. Scale bar, 1,000 μM.
- D, E
Representative IF for p16+ (cell senescence marker), F480+ (macrophages), CD31+ (endothelial cells), and TCF‐4+ (fibroblasts) cells in longitudinal sections of nerves from chronically denervated in adult mice (D) or acutely denervated in aged mice (E). For each marker, the quantification shows in the left bar the percentage of the specific cell type among total nuclei in the nerve, and the right bar represents the percentage of the specific cell type among the total number of p16‐positive senescent cells. This data was used to generate the quantifications in Fig 1J.
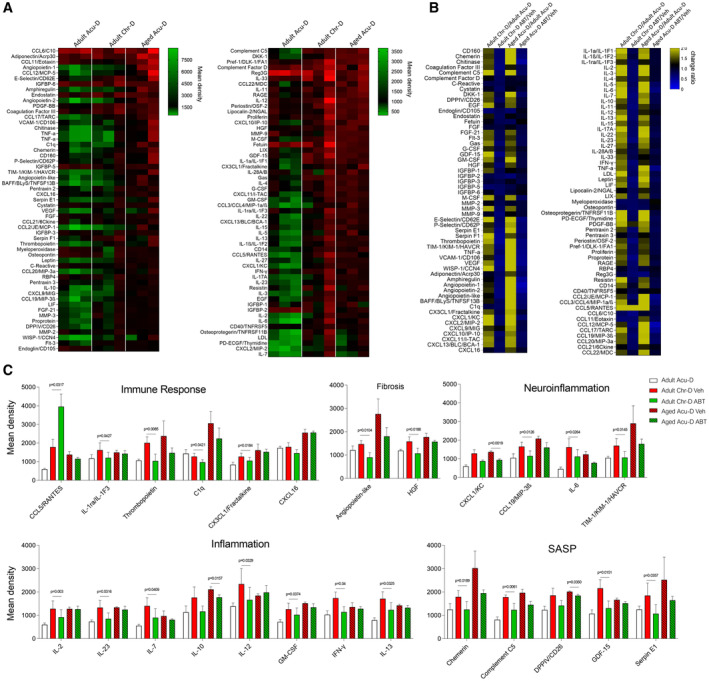
Expression analysis of 111 different cytokines in the context of aging or chronic denervation. Comparison between adult chronic denervation (Adult Chr‐D) or acute denervation in aged mice (Aged Acu‐D).
Fold change comparison of 111 different cytokines in the context of chronic denervation in adults and acute denervation in aged mice and after ABT‐263 treatment. Comparison between adult mice after Chr‐D and aged mice after Acu‐D in the context of ABT‐263 treatment, vehicle treatment, and compared to adult Acu‐D regenerative response.
Expression analysis of 25 different cytokines in the context of aging or chronic denervation. Comparison between Chr‐D in adults or Acu‐D in aging conditions, in mice treated with vehicle or ABT‐263 compared to adult Acu‐D regenerative response. Data are expressed as mean density (N = 3 animals per group, *P < 0.05 by Student's t‐test compared between conditions; error bars indicate SEM).

Differentially expressed genes in adult distal nerves evaluated 1, 30 and 180 days after sciatic nerve transection.
Venn diagram of up‐regulated genes evaluated 1, 30 and 180 days after sciatic nerve transection, contrasted against the SASP‐ATLAS database.
Graph comparison of percentage of unique SASP genes against common SASP genes after 1‐, 30‐ or 180‐days post transection.
Identification of the unique SASP genes at different times post‐transection.
- A, B
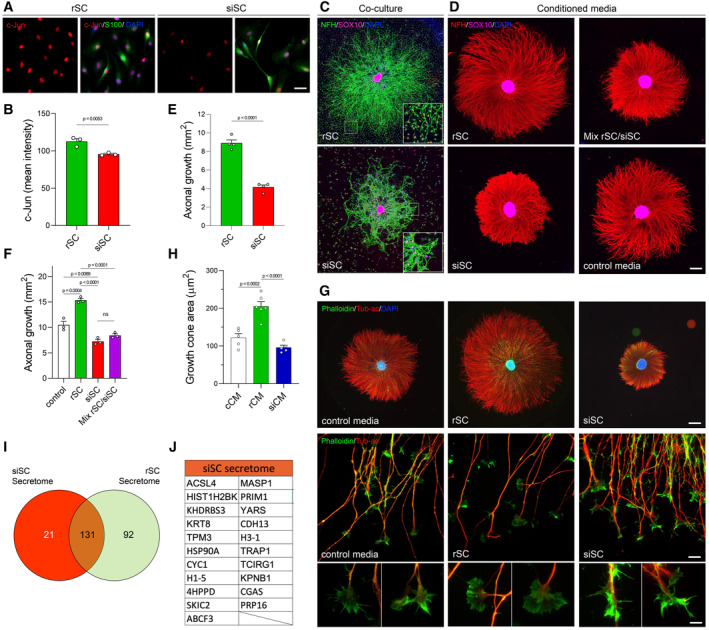
Representative IF images (A), and quantitative comparison (B) of c‐Jun positive nuclei from primary cultures of rat repair Schwann cells (rSC) and Schwann cells induced to a senescent phenotype (siSC) after doxorubicin treatment (see Materials and Methods for details). N = 3. rSC and siSC prepared in this manner were used for following experiments (S100, green; c‐Jun, red; DAPI, blue). Scale bar, 100 μm.
- C, D
Representative IF images of DRG reaggregated neurons. In (C) DRG were cocultured either with rSC or siSC. Scale bar 500 μm. In (D), DRG neurons were treated for 72 h with conditioned media derived from rSC, siSC, or a 1:1 mix of both conditioned media. No supplemented media was used as control. Scale bar 1,000 μm.
- E, F
Quantification of axonal growth of DRG neurons cocultured with rSC or siSC (E, N = 4) or treated with conditioned media from repair (rCM) or senescent (sCM) Schwann cells (F, N = 3) for 72 h.
- G
Representative IF images of DRG explants treated for 72 h with conditioned media from rSC or siSC and stained for acetylated tubulin, phalloidin and DAPI. Scale bar 670 μm. Middle and bottom panels, higher magnification images of axonal growth cones present at the tip of the explants. Scale bars, 20 μm for middle panels, and 7 μm for bottom panels.
- H
Quantification of growth cone area (N = 5).
- I
Secretome analysis of conditioned media from siSC and rSC compared with SASP‐ATLAS database.
- J
Protein description of the 21 proteins exclusively secreted by siSC.
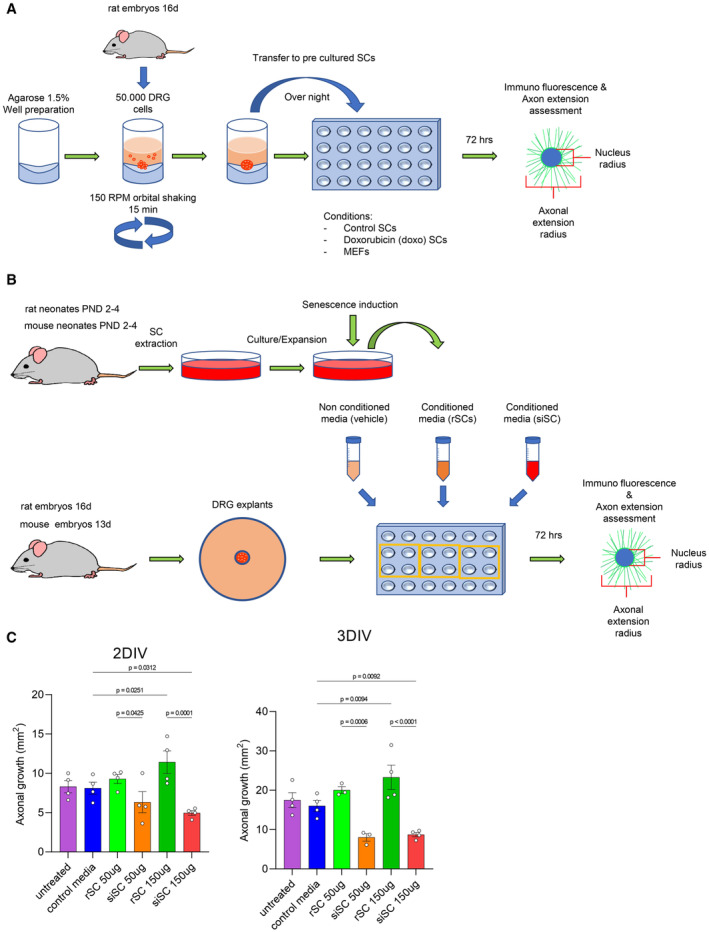
Scheme of the DRG and SC co‐culture protocol.
Methodological scheme of the obtention of conditioned media from SC and the treatment of DRG with treatment with conditioned media protocol.
Comparison between DRG re‐aggregates after 2 or 3 days in vitro (DIV) of exposure to control media, and conditioned media from SC or siSCs in concentrations of 50 or 150 μg of proteins from collected media, compared to untreated DRGs. N = 3–4 re‐aggregates per group; *P < 0.05 by Student's t‐test compared between conditions; error bars indicate SEM.
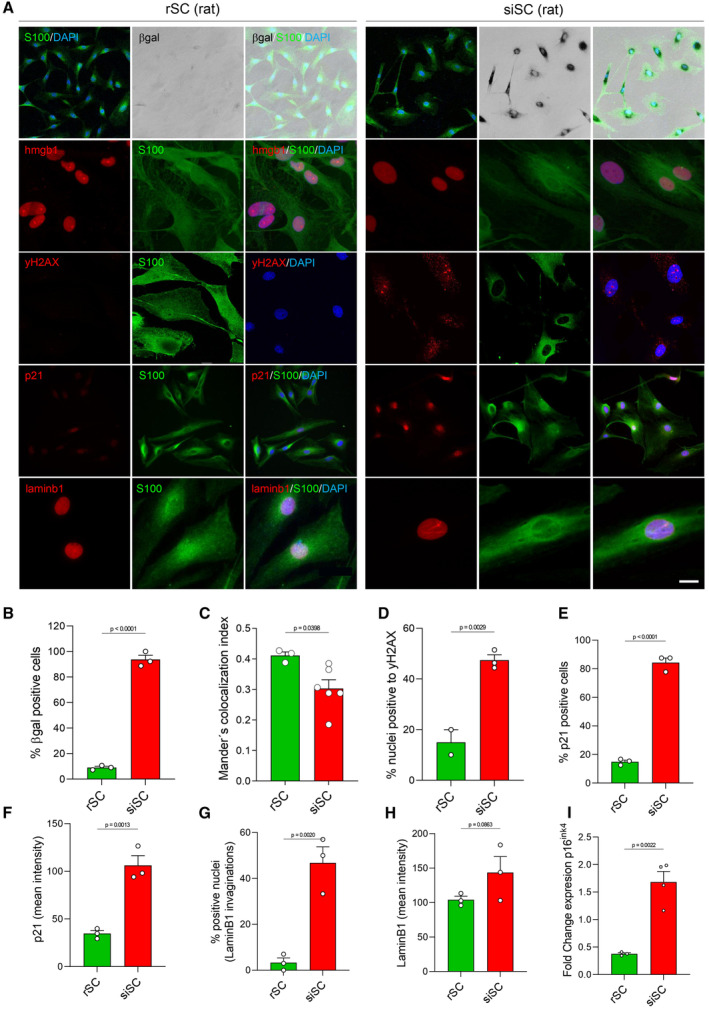
- A
Representative IF images in rSC and siSC, S100, green, βgal, black; Hmgb‐1/yH2AX, red; DAPI, blue. Scale bar, βgal, 100 μm; p21, 100 μm; yH2AX, 50 μm; hmbgb‐1, 25 μm; laminb1, 25 μm.
- B–I
Graph comparison of β‐gal+ cells (B), Mander's co‐localization index of HMGB1 (C), yH2AX foci/nucleus (D), p21 positive cells (E) and expression levels (F), nuclei positive for LaminB1 marked invaginations (G) and expression (mean intensity) (H), p16INK4a fold change (qRT‐PCR) (I) between non‐senescent and siSCs and rSCs. N = 3–6 per condition; *P < 0.05, **P < 0.01 by Student's t‐test compared between conditions; error bars indicate SEM.

- A
Representative IF images of mouse rSC and siSC stained with different senescent markers (SA‐β‐gal, p16) or c‐Jun together with the SC marker S100 and the nuclei marker DAPI. Scale bar, 50 μm.
- B–D
Graph comparison of β‐gal positive cells (B), c‐Jun nuclei intensity (C) and % of p16 positive cells (D). N = 3 per condition; *P < 0.05, **P < 0.01 by Student's t‐test compared between conditions; error bars indicate SEM.
- E
Representative IF images of mouse DRG neurons. In (A) DRG were treated for 72 h with conditioned media derived from control, rSC, and siSC. Scale bar, 500 μm. To the right, the graph shows the quantification of axonal growth of DRG neurons comparing the different treatments.
- F
Higher magnification images of axonal growth cones present at the tip of the explants from DRGs treated in (A). Scale bars, 50 μm. To the right, the graph shows the quantification of the size of the growth cone between treatments. N = 3 for each condition. One‐way ANOVA with Bonferroni multicomparison post‐test. *P < 0.05, **P < 0.01, ***P < 0.001, ****P < 0.0001. Data is presented as mean ± SEM.
- G
Primary cultures of SC from p16‐3MR mice were treated with doxorubicin to induce senescence (see Materials and Methods for details). After senescence induction (DOXO), red fluorescent protein (RFP) is robustly expressed compared to vehicle‐treated Schwann cells. Ganciclovir (GCV) treatment eliminates most RFP‐expressing siSC. Scale bar, 200 μm.
- H
Basal expression of c‐Jun by Western blot in undamaged sciatic nerves from wild type and p16‐3MR mice. Besides the already low expression of c‐Jun in undamaged nerves in wild type mice compared to injured nerves (adult Acu‐D), the levels of c‐Jun are comparable between p16‐3MR and wild type mice.

- A
Schematic representation of the experimental condition and timeline for tibial nerve transection (TN‐T) and senolytic treatment in adult mice submitted to Chr‐D and aged mice submitted to Acu‐D. Groups were treated with vehicle or senolytic drug ABT‐263, given by daily gavage for 5 days, at a 50 mg/kg dose. Arrow in the left scheme corresponds to the site of imaging.
- B, C
Confocal microscopy and quantification graph comparing β‐galactosidase activity between treatments (Vehicle and ABT‐263) in adult mice with Chr‐D (N = 4) and aged mice with to Acu‐D (N = 3).
- D–I
Representative IF confocal images of longitudinal cryostat sections and quantification graphs indicating SC positive for senesce markers γ‐H2AX (D, E), p16INK4a (F, G), and transcription factor c‐Jun (H, I), comparing vehicle and ABT‐263 treated adult mice with Chr‐D and aged mice with Acu‐D (N = 3–6. Specific n is noted as dots in each graph).
- J, K
Immunodetection by western blot of p16INK4a (J, N = 3 per group) and c‐Jun (K, N = 3 per group) in nerve homogenates from adult mice with Chr‐D and aged mice with ACu‐D, respectively, that were treated with vehicle or ABT‐263.

- A
Schematic representation of the experimental condition and timeline for tibial nerve transection (TN‐T), senolytic treatment and tibial nerve reconnection (TN‐R), performed in adult mice submitted to Chr‐D and aged mice submitted to Acu‐D. Groups were treated with vehicle or senolytic drug ABT‐263 for wild type mice, given by daily gavage for 5 days, at 50 mg/kg, or Ganciclovir (GCV) for P16‐3MR mice, given by daily IP, at 25 mg/kg. Arrow in the scheme corresponds to the site of imaging.
- B
Representative IFI (SCG10) of nerve longitudinal sections from vehicle and senolytic‐treated mice, evaluated 7 days post TN‐R. Arrowheads indicate the reconnection site (see Materials and Methods for details). Scale bar, 500 μm.
- C, D
Quantification of the density of SCG10‐positive from the reconnection site to distal regions in nerves from vehicle and ABT‐263 treated mice, in adult mice with Chr‐D (C, N = 3 for vehicle and N = 5 for treated) and aged mice with Acu‐D (D, N = 4 per group). The dataset used for the vehicle controls of (B–D) was used for basal values shown in Fig 1B and C.
- E, F
Functional evaluation of hindlimb sensitivity to mechanical (Pinprick assay, E) and thermal (Hargreaves assay, F) stimuli. Inset in (E) shows in gray the area of the hind paw innervated by the tibial branch. Tests were performed in this region of the hind paw in mice treated with vehicle or ABT‐263, up to 48 days post reconnection in adult mice that were chronically denervated. N = 8–10 animals per group. In F, the response time to thermal stimuli in uninjured hind paw is shown as a red dotted line.
- G, H
Representative IF confocal images and quantification graph comparing c‐Jun‐positive SC (stained for SOX10) on longitudinal cryostat sections of adult 3MR mice submitted to Chr‐D, treated with vehicle or GCV. N = 4 animals per group. Scale bar, 50 μm.
- I
Representative IF (SCG10) of nerve longitudinal sections from vehicle and senolytic (GCV) treated P16‐3MR mice that were chronically denervated, evaluated 7 days post TN‐R. Arrowheads indicate the reconnection site (see Materials and Methods for details). Scale bar, 400 μm.
- J
Quantification of the density of SCG10‐positive from the reconnection site to distal regions in nerves from vehicle (N = 5) and GCV‐treated (N = 6) P16‐3MR mice.
References
-
- Andersen ND, Monje PV (2018) Isolation, culture, and cryopreservation of adult rodent Schwann cells derived from immediately dissociated teased fibers. Methods Mol Biol 1739: 49–66 - PubMed
-
- Arthur‐Farraj PJ, Morgan CC, Adamowicz M, Gomez‐Sanchez JA, Fazal SV, Beucher A, Razzaghi B, Mirsky R, Jessen KR, Aitman TJ (2017) Changes in the coding and non‐coding transcriptome and DNA methylome that define the Schwann cell repair phenotype after nerve injury. Cell Rep 20: 2719–2734 - PMC - PubMed
-
- Bagheri M, Nair RR, Singh KK, Saini DK (2017) ATM‐ROS‐iNOS axis regulates nitric oxide mediated cellular senescence. Biochim Biophys Acta Mol Cell Res 1864: 177–190 - PubMed
Publication types
MeSH terms
Grants and funding
LinkOut - more resources
Full Text Sources
Medical
Molecular Biology Databases
Miscellaneous
