. 2023 Oct 20:12:e92899.
doi: 10.7554/eLife.92899.

Evolution of haploid and diploid populations reveals common, strong, and variable pleiotropic effects in non-home environments

Affiliations

Evolution of haploid and diploid populations reveals common, strong, and variable pleiotropic effects in non-home environments

Vivian Chen et al. Elife. .

Abstract

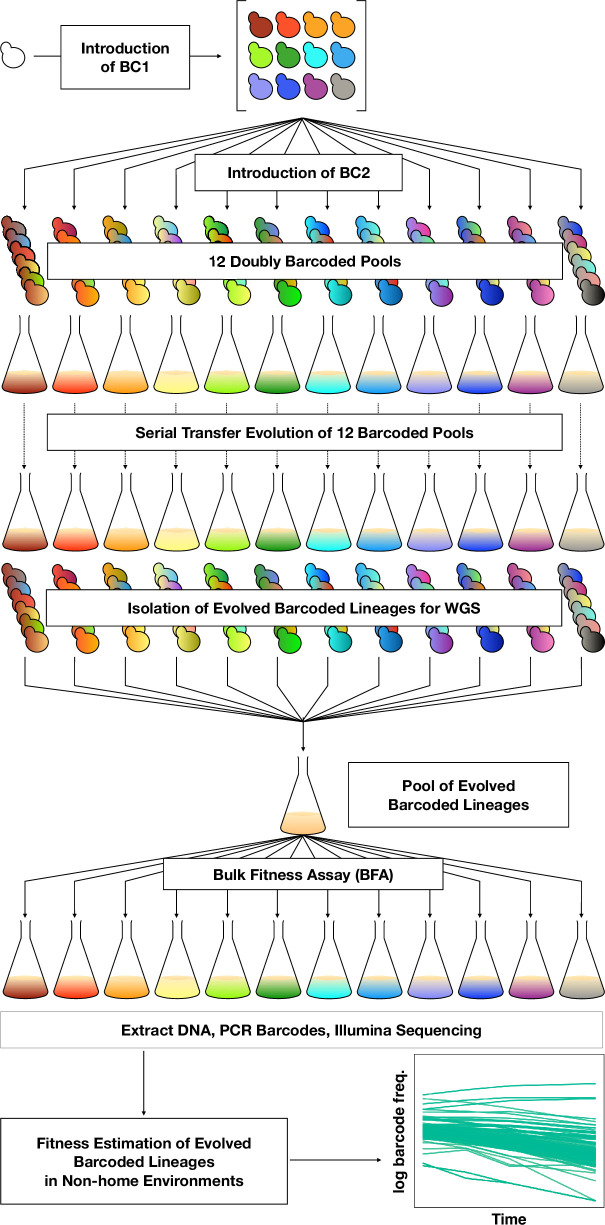
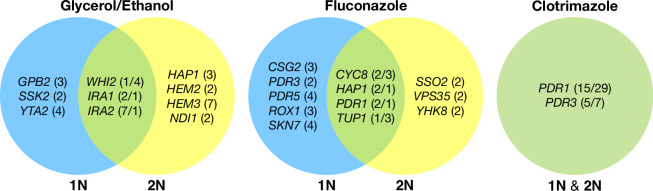
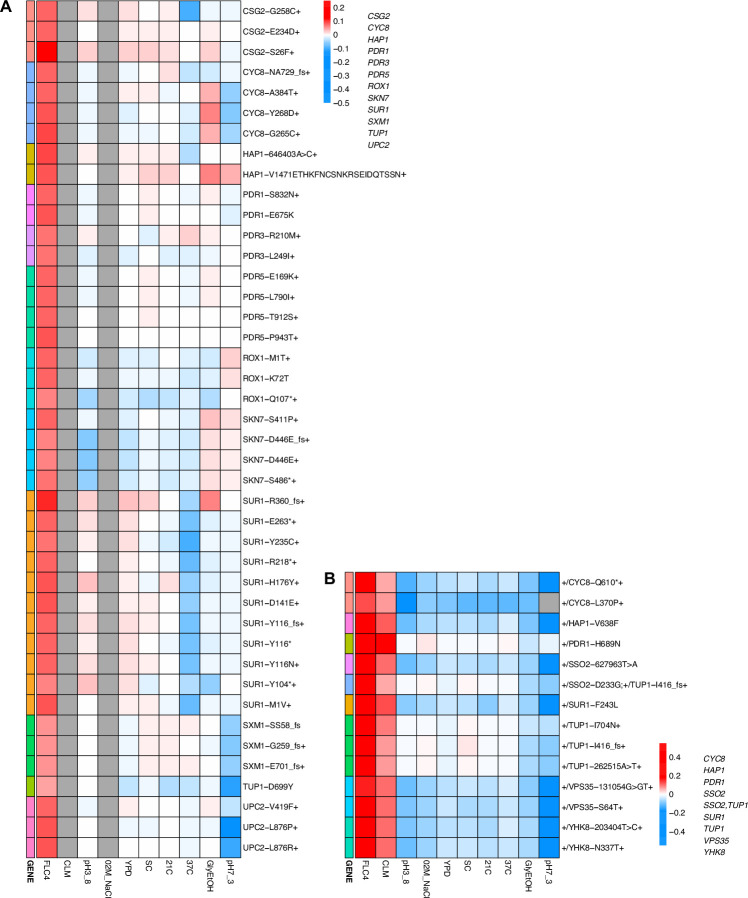
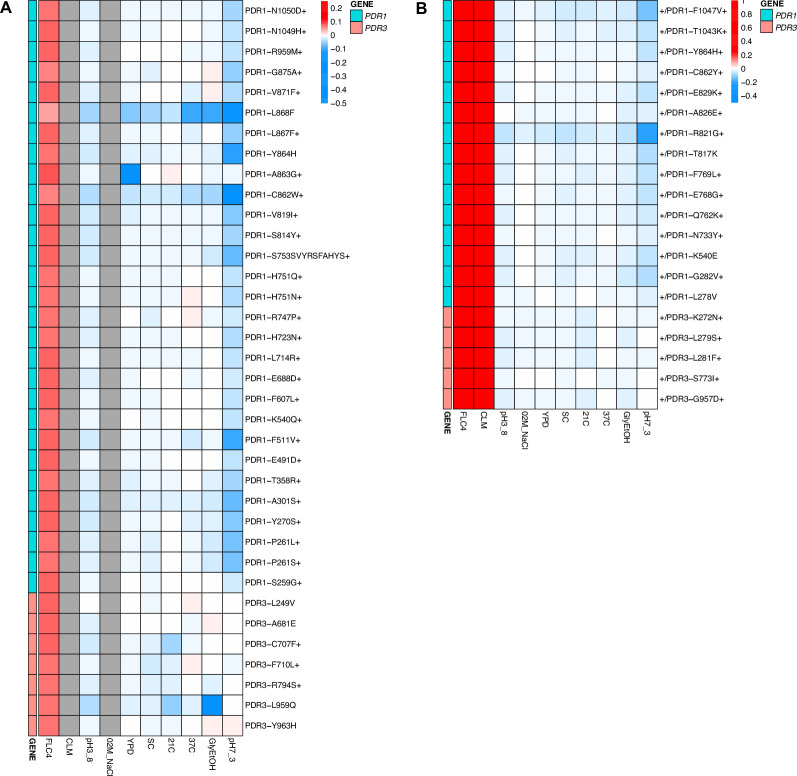
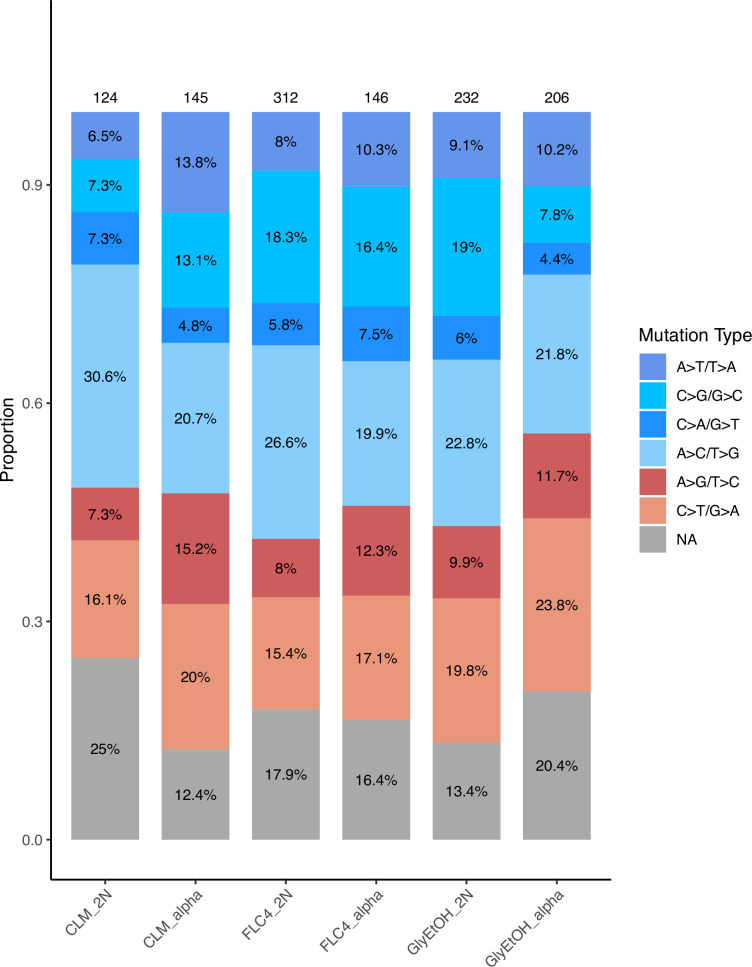
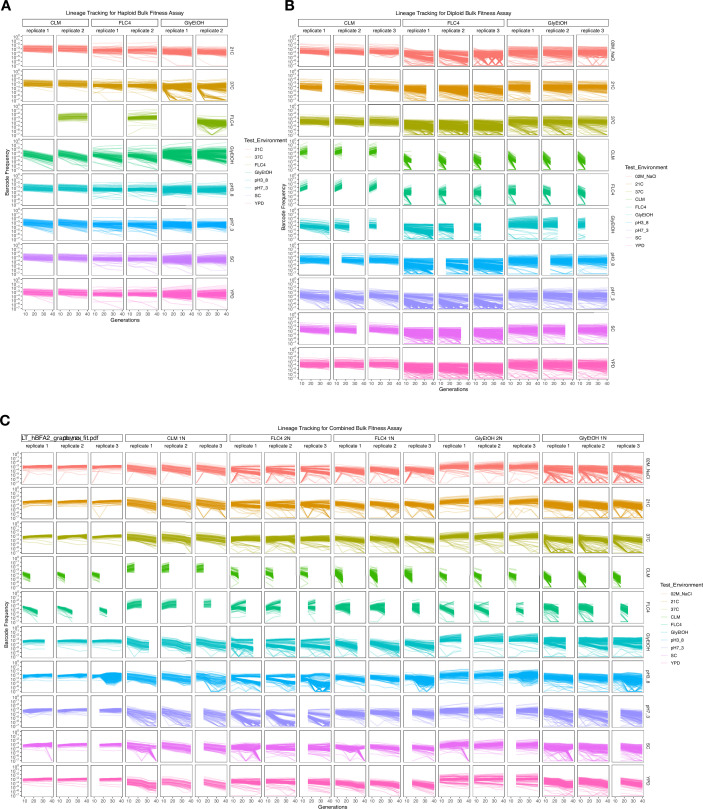
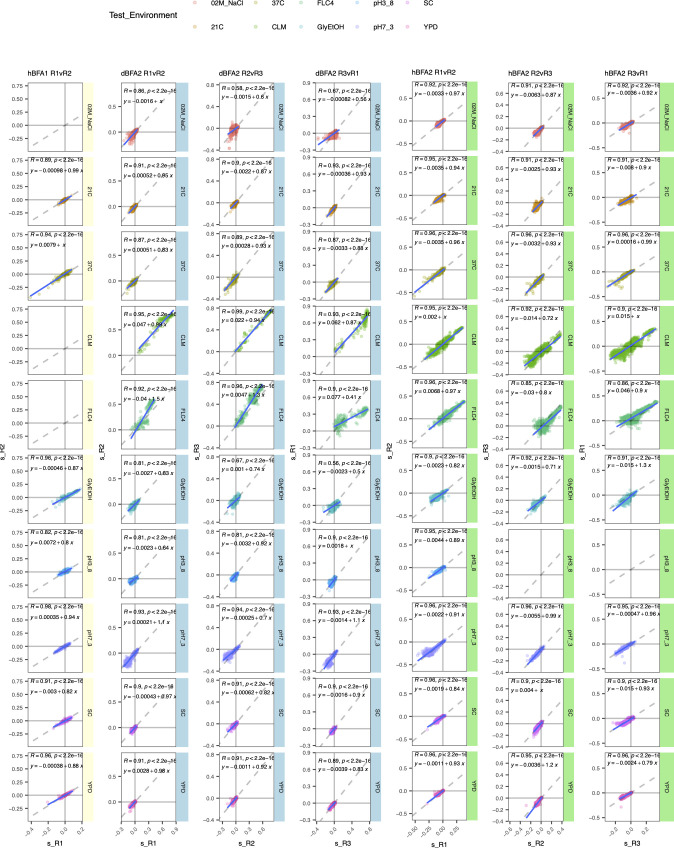
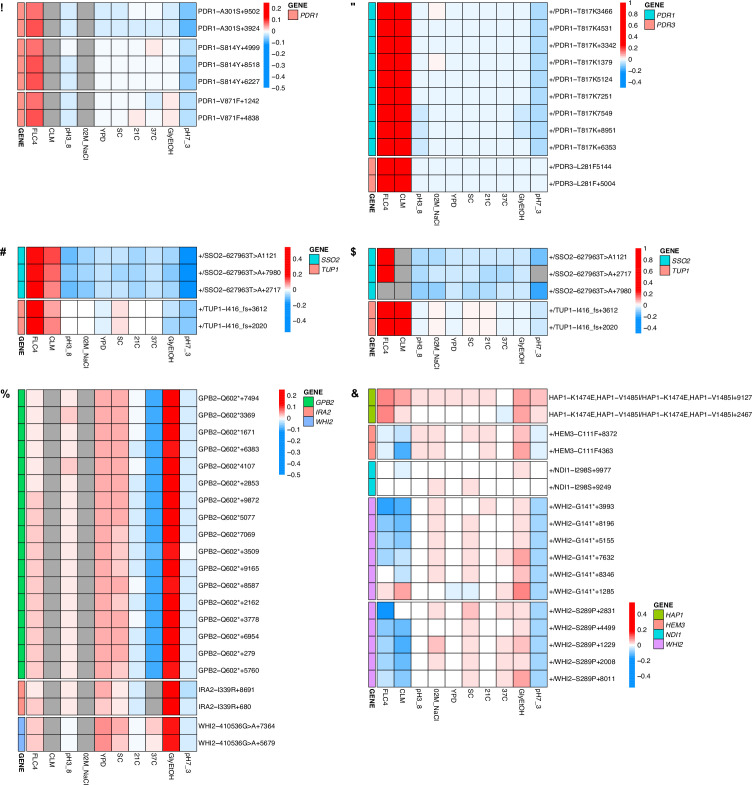
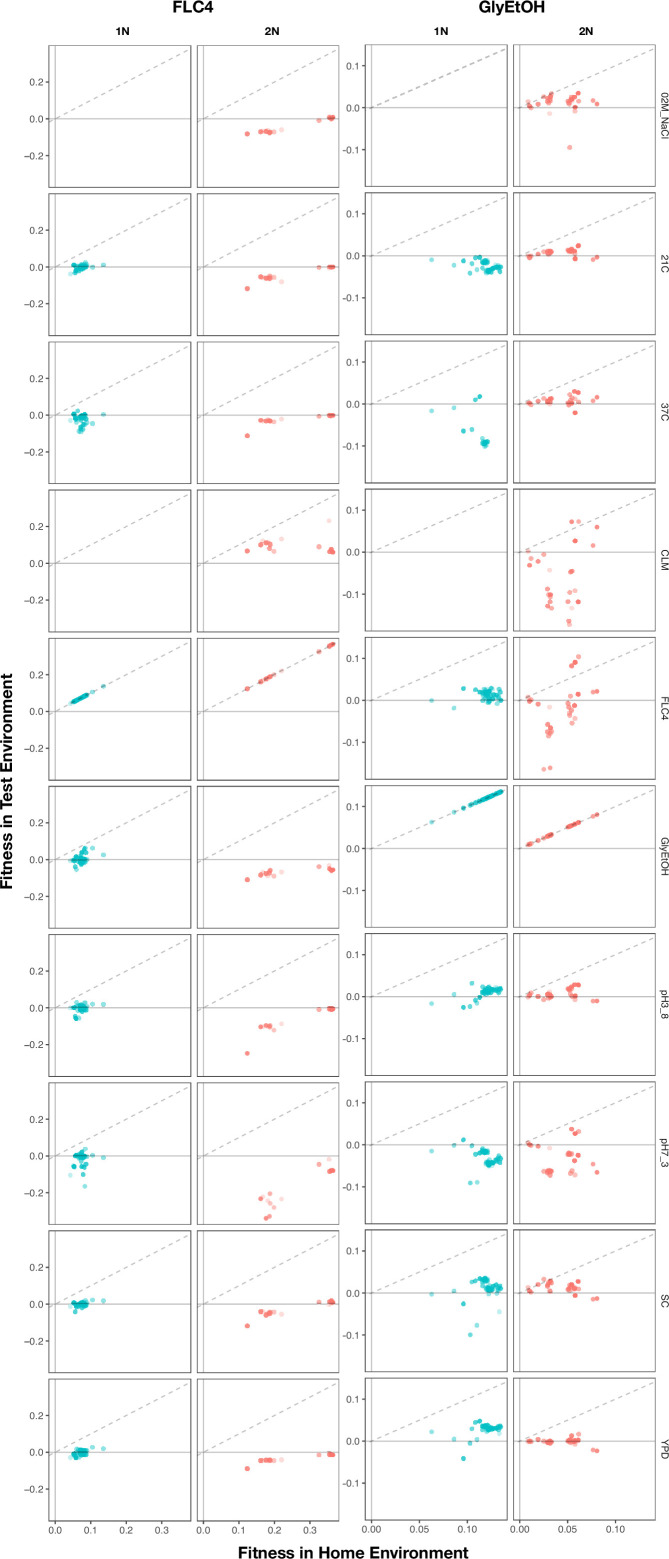
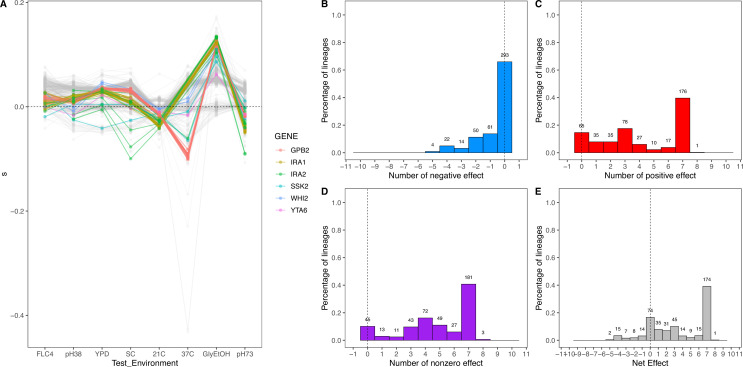
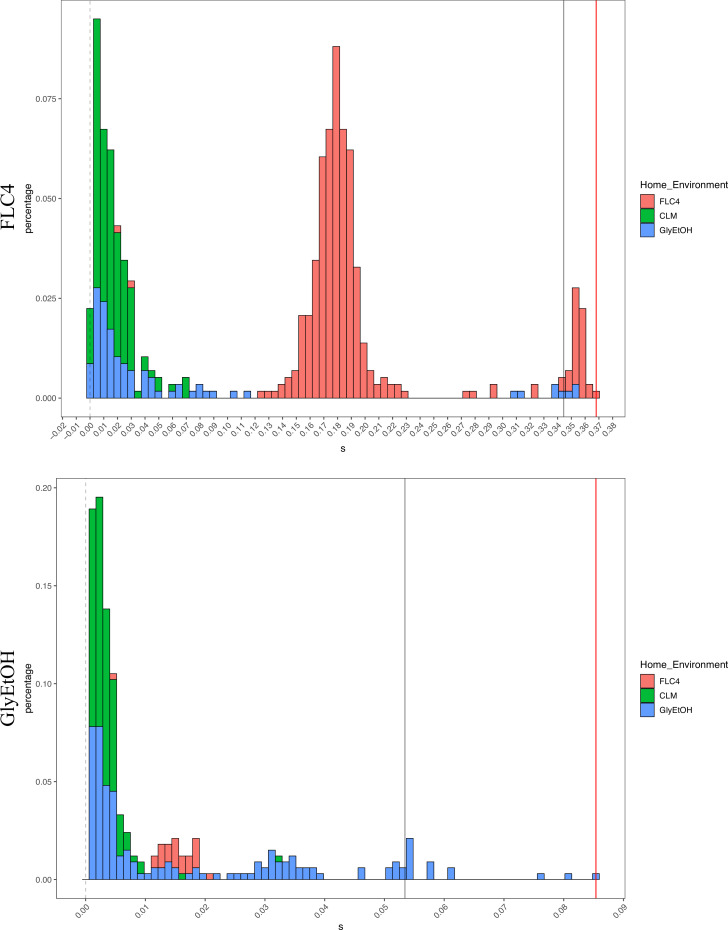
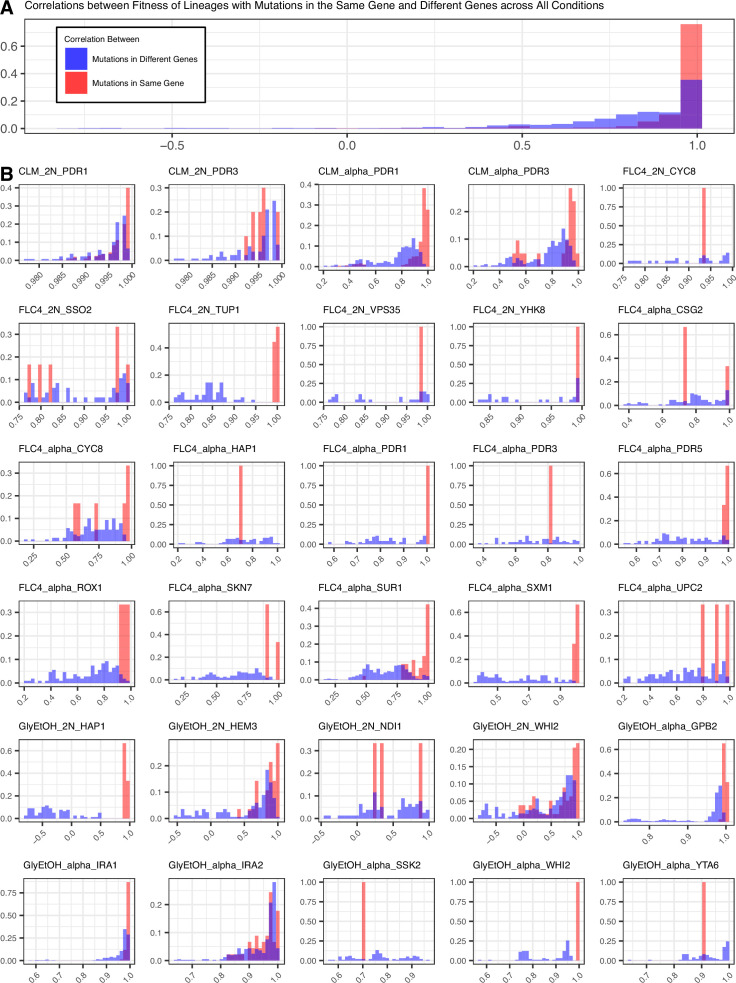
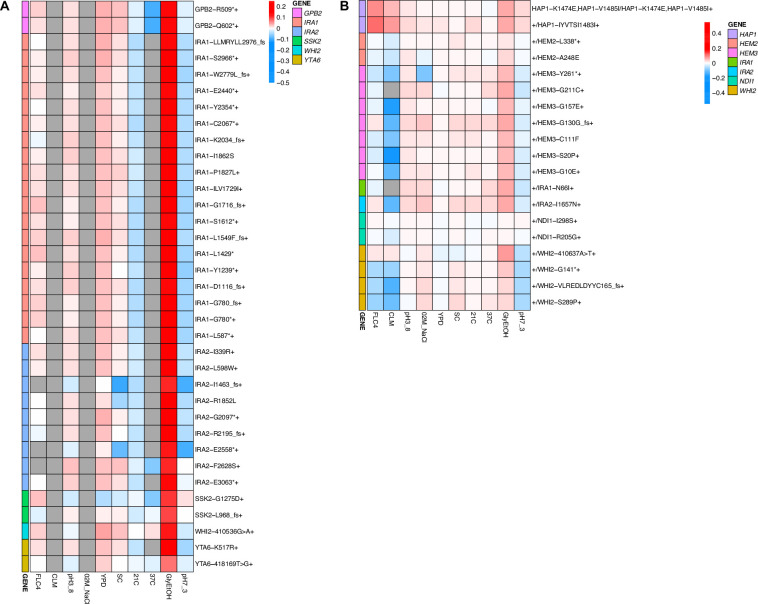
Adaptation is driven by the selection for beneficial mutations that provide a fitness advantage in the specific environment in which a population is evolving. However, environments are rarely constant or predictable. When an organism well adapted to one environment finds itself in another, pleiotropic effects of mutations that made it well adapted to its former environment will affect its success. To better understand such pleiotropic effects, we evolved both haploid and diploid barcoded budding yeast populations in multiple environments, isolated adaptive clones, and then determined the fitness effects of adaptive mutations in 'non-home' environments in which they were not selected. We find that pleiotropy is common, with most adaptive evolved lineages showing fitness effects in non-home environments. Consistent with other studies, we find that these pleiotropic effects are unpredictable: they are beneficial in some environments and deleterious in others. However, we do find that lineages with adaptive mutations in the same genes tend to show similar pleiotropic effects. We also find that ploidy influences the observed adaptive mutational spectra in a condition-specific fashion. In some conditions, haploids and diploids are selected with adaptive mutations in identical genes, while in others they accumulate mutations in almost completely disjoint sets of genes.

Keywords: S. cerevisiae; evolution; evolutionary biology; genetics; genomics; pleiotropy; trade-offs; yeast.


Conflict of interest statement

VC, MJ, LH, PH, DY, YL, AA, SH, DP, MD, GS No competing interests declared

Figures

Figure 1.
Figure 1.. DNA double-barcoding strategy enables massively parallel bulk ‘common garden’ fitness remeasurements across many environments.
For both ploidies (1N and 2N) 12 pools of singly barcoded yeast were generated. A second, high complexity barcode was then introduced into each pool, creating 24 (12 haploid and 12 diploid) pools of uniquely double barcoded yeast. Each pool was evolved in a specific environment (Table 1) for up to 440 generations (55 transfers). Evolved strains were isolated from each pool and whole-genome sequenced to identify any mutations that arose. Strains were pooled for bulk fitness assays in the same environments used for the evolutions, in duplicate or triplicate. The barcodes were then sequenced and the barcode frequencies were used to estimate fitness.
Figure 1—figure supplement 1.
Figure 1—figure supplement 1.. Double barcoding system.
A Gal-Cre-NatMX cassette was homologously recombined into the YBF209W dubious open reading frame region in an S288C derivative, BY4709. The NatMX marker was replaced with a DNA fragment containing a lox66 site, a random sequence of 20 nucleotides (BC1), half of an artificial intron (AI) and the 3’ half of the URA3 selectable marker. This strain was then transformed with a plasmid library containing the 5’ half of the URA3 selectable marker, another random sequence of 20 nucleotides (BC2), the other half of an artificial intron, and a lox71 site. Gal-Cre-induced recombination between the lox66 and plasmid lox71 sites was used to insert the plasmid region containing BC2, AI, and the 5’ half of the URA3 marker. This insertion creates a genomic locus that contains a complete URA3 artificial intron, BC2, a crippled loxP site, BC1, and a complete URA3 gene. The barcodes residing in between the artificial intron regions are maintained due to selection for URA3.
Figure 2.
Figure 2.. Lineage tracking data for evolutions in clotrimazole, fluconazole, and glycerol/ethanol.
The lines correspond to 10,000 barcoded lineages (the 5000 lineages with highest abundance, and 5000 additional randomly chosen lineages). The intensity of the color of the line indicates the highest barcode frequency reached by that lineage. The y axis represents the barcode frequency in log scale. The dashed vertical lines indicate from which timepoint clones were isolated.
Figure 2—figure supplement 1.
Figure 2—figure supplement 1.. Lineage tracking for all evolutions.
(A) Lineage tracking data for each haploid experimental evolution. The lines correspond to barcoded lineages. Each row represents the home environment in which the evolution was conducted. Each column represents the ploidy. (B) Lineage tracking data for each diploid experimental evolution.
Figure 3.
Figure 3.. Haploid and diploid mutational spectra.
For each focal condition, the mutations are grouped by the ploidy they were identified in: blue (haploids), yellow (diploids). The genes listed in the overlap region are genes that had acquired mutations in evolutions of both ploidies. The number listed in parentheses is the number of unique mutations observed in that gene for that ploidy. Genes listed in the green overlap region are observed to have mutations in both ploidies. In the parentheses, the left number is the number of mutations observed in haploid evolutions and the number on the right is the number of mutations observed in that gene in the diploid evolutions. See Methods for selection criteria of mutations.
Figure 4.
Figure 4.. Heatmaps representing pleiotropic profiles of adaptive mutant lineages from populations evolved in fluconazole.
Each heatmap shows the lineages evolved in a particular condition and their fitness remeasurements in a specific bulk fitness assay. Each square on the heatmap shows the average fitness of the lineage measured in each environment (columns) for approximately 40 generations, specifically for mutant lineages we identified in Table 1 (rows). The ‘+’ indicates that in that lineage there are other background mutations, the ‘++’ indicates that this specific mutation was observed in multiple lineages and what is shown in the row is the median fitness of all the lineages that have that mutation. (A) shows the haploids and (B) shows the diploids from the fluconazole evolution.
Figure 4—figure supplement 1.
Figure 4—figure supplement 1.. Heatmaps representing pleiotropic profiles of adaptive mutant lineages from populations evolved in clotrimazole.
Each heatmap shows the lineages evolved in a particular condition and their fitness remeasurements in a specific bulk fitness assay. Each square on the heatmap shows the average fitness of the lineage measured in each environment (columns) for approximately 40 generations, specifically for mutant lineages we identified in Table 1 (rows). The ‘+’ indicates that in that lineage there are other background mutations, the ‘++’ indicates that this specific mutation was observed in multiple lineages and what is shown in the row is the median fitness of all the lineages that have that mutation. (A) shows the haploids and (B) shows the diploids from the fluconazole evolutions.
Appendix 1—figure 1.
Appendix 1—figure 1.. Relative mutation rates of each of the six possible nucleotide changes for each condition and ploidy tested.
Appendix 1—figure 2.
Appendix 1—figure 2.. Lineage Tracking Data for Fitness Remeasurement Assays.
(A) Lineage tracking data of haploid bulk fitness assay (hBFA) for lineages evolved in fluconazole, clotrimazole, and glycerol/ethanol. Each column represents a replicate. The columns are grouped together by the evolution environment: fluconazole, clotrimazole, glycerol/ethanol. Each row represents the ‘test environment’. Each line represents one lineage evolved in the home environments that corresponds with its column group. The color of the line indicates the test environment in which that lineage was remeasured. (B) Lineage tracking data of diploid bulk fitness assay (dBFA) for lineages evolved in fluconazole, clotrimazole, and glycerol/ethanol. (C) Lineage tracking data of combined bulk fitness assay (cBFA) for lineages evolved in fluconazole, clotrimazole, and glycerol/ethanol.
Appendix 1—figure 3.
Appendix 1—figure 3.. Comparison of replicates for each bulk fitness assay (BFA).
Each panel corresponds to a BFA and two replicates within that assay. Each row corresponds to a test environment. We plot the fitness of a lineage in one replicate against its fitness in another replicate. Haploid BFA (hBFA) only had two replicates.
Appendix 1—figure 4.
Appendix 1—figure 4.. Heatmaps for all adaptive lineages with shared mutations.
These heatmaps show the fitnesses of all lineages including lineages that had the same mutation and were collapsed into a single row using the median fitnesses in Figure 4. The number at the end of the name represents numerical barcode identification number. (A) Mutations identified in clotrimazole 1N measured in haploid bulk fitness assay (hBFA). (B) Mutations identified in clotrimazole 2N measured in diploid bulk fitness assay (dBFA). (C) Mutations identified in fluconazole 2N measured in combined bulk fitness assay (cBFA). (D) Mutations identified in fluconazole 2N measured in dBFA. (E) Mutations identified in glycerol/ethanol 1N measured in hBFA. (F) Mutations identified in glycerol/ethanol 2N measured in cBFA.
Appendix 1—figure 5.
Appendix 1—figure 5.. Home environment compared to test environments for all adaptive lineages.
The columns are the home environments that lineages evolved in and the rows are the test environments in which their fitnesses were remeasured. X axis is the fitness of the lineages remeasured in the bulk fitness assay (BFA) in their home environment. Y axis is the fitness of the lineages in a non-home environment. No fitness remeasurements are available from BFAs grown in clotrimazole.
Appendix 1—figure 6.
Appendix 1—figure 6.. Net effect of mutant haploid lineages evolved in glycerol/ethanol.
(A) Fitness measurements, s, of haploid lineages adapted to glycerol/ethanol. The colored lines represent lineages that have a mutation identified to be adaptive. The colors represent which gene the mutation is in. (B) Negative effect of lineages adapted to glycerol/ethanol. This describes the number of lineages that had a negative effect (fitness <–0.018) in a specific number of non-home environments. (C) Positive effect of lineages adapted to glycerol/ethanol. This describes the number of lineages that had a positive effect (fitness >0.018) in a specific number of non-home environments. (D) Nonzero effect of lineages adapted to glycerol/ethanol. This describes the number of lineages that had a nonzero effect (fitness >0.018 or fitness <–0.018) in a specific number of non-home environments. (E) Net effect of lineages adapted to glycerol/ethanol. The sum of each lineage’s effect across all non-home environment.
Appendix 1—figure 7.
Appendix 1—figure 7.. Distribution of fitness effects for fitness estimates of all adaptive diploid lineages remeasured in clotrimazole, fluconazole, and glycerol/ethanol.
The distribution of fitness effects for all adaptive diploid lineages remeasured in clotrimazole, fluconazole, and glycerol/ethanol. The gray vertical line delineates the fitness threshold of the top 10% of mutants that were evolved in the labeled environment. The red line delineated the top fitness of all mutants that were evolved in the labeled environment. The y axis delineates the percentage of mutants that have a specific fitness (x axis).
Appendix 1—figure 8.
Appendix 1—figure 8.. Mutations in the same gene tend to lead to more similar pleiotropic profiles than in different genes for the same evolution condition.
(A) Correletions aggregated across all conditions. (B) Correlations by condition and ploidy. The fitnesses of lineages with candidate adaptive mutations in the same gene that arose in the same condition were compared to each other and a Pearson correlation was calculated for each comparison. Then the fitnesses of lineages with candidate adaptive mutations in the same gene were compared to the fitnesses of all the other lineages evolved in that condition that have adaptive mutations in a different gene and a Pearson correlation was calculated for each comparison.
Appendix 1—figure 9.
Appendix 1—figure 9.. Heatmaps representing pleiotropic profiles of adaptive mutant lineages from populations evolved in glycerol/ethanol.
Each heatmap shows the lineages evolved in a particular condition and their fitness remeasurements in a specific bulk fitness assay. Each square on the heatmap shows the average fitness of the lineage measured in each environment (columns) for approximately 40 generations, specifically for mutant lineages we identified in Table 1 (rows). The ‘+’ indicates that in that lineage there are other background mutations, the ‘++’ indicates that this specific mutation was observed in multiple lineages and what is shown in the row is the median fitness of all the lineages that have that mutation. (A) shows the haploids and (B) shows the diploids from the fluconazole evolutions.
Appendix 1—figure 10.
Appendix 1—figure 10.. The mean frequency of putatively neutral barcodes with different minimum GC-contents.
The y axis represents the log10 of the mean frequency of the putatively neutral barcodes with different minimum GC-contents of a 26 bp sliding window measured across the barcode region. The ordering of the deviations here demonstrates that GC-content bias is affecting measured frequency.

Update of

  • doi: 10.1101/2023.02.28.530341

Similar articles

Cited by

References

    1. Abdul-Rahman F, Tranchina D, Gresham D. Fluctuating environments maintain genetic diversity through neutral fitness effects and balancing selection. Molecular Biology and Evolution. 2021;38:4362–4375. doi: 10.1093/molbev/msab173. - DOI - PMC - PubMed
    1. Aggeli D, Li Y, Sherlock G. Changes in the distribution of fitness effects and adaptive mutational spectra following a single first step towards adaptation. Nature Communications. 2021;12:5193. doi: 10.1038/s41467-021-25440-7. - DOI - PMC - PubMed
    1. Aggeli D, Marad DA, Liu X, Buskirk SW, Levy SF, Lang GI. Overdominant and partially dominant mutations drive clonal adaptation in diploid Saccharomyces cerevisiae. Genetics. 2022;221:iyac061. doi: 10.1093/genetics/iyac061. - DOI - PMC - PubMed
    1. Avecilla G, Chuong JN, Li F, Sherlock G, Gresham D, Ram Y. Neural networks enable efficient and accurate simulation-based inference of evolutionary parameters from adaptation dynamics. PLOS Biology. 2022;20:e3001633. doi: 10.1371/journal.pbio.3001633. - DOI - PMC - PubMed
    1. Bakerlee CW, Phillips AM, Nguyen Ba AN, Desai MM. Dynamics and variability in the pleiotropic effects of adaptation in laboratory budding yeast populations. eLife. 2021;10:e70918. doi: 10.7554/eLife.70918. - DOI - PMC - PubMed

Publication types