. 2023 Dec 1;211(11):1643-1655.
doi: 10.4049/jimmunol.2300424.

Immune Activation Profiles Elicited by Distinct, Repeated TLR Agonist Infusions in Rhesus Macaques

Affiliations

Immune Activation Profiles Elicited by Distinct, Repeated TLR Agonist Infusions in Rhesus Macaques

Hannah A D King et al. J Immunol. .

Abstract

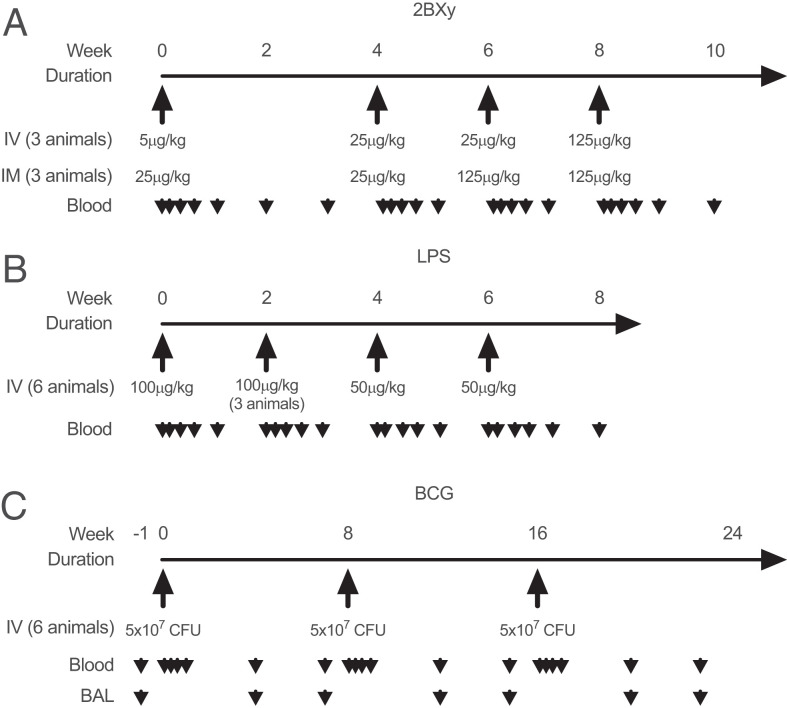
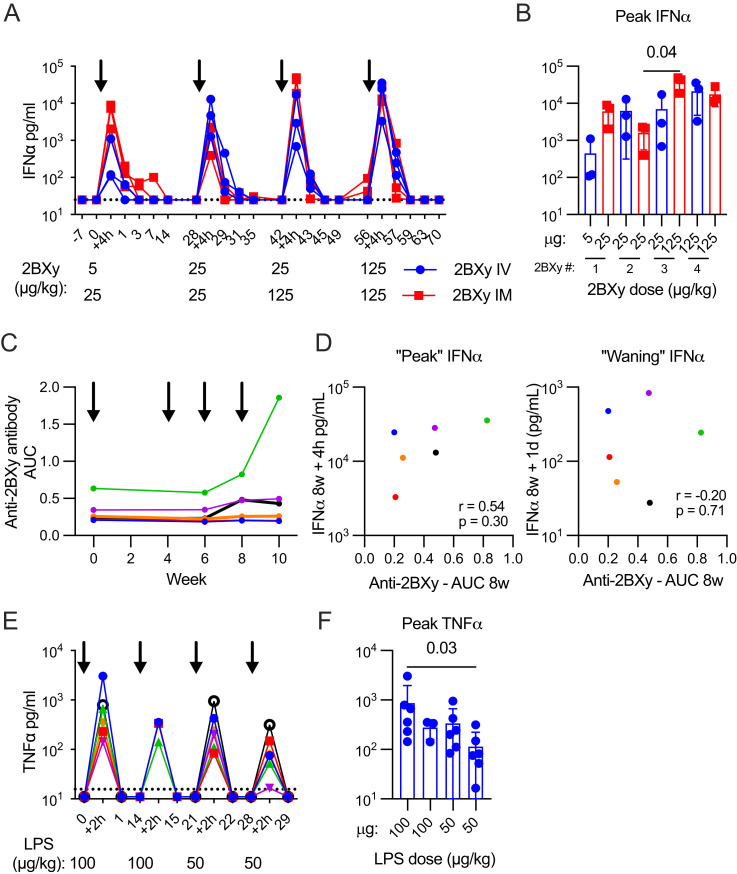
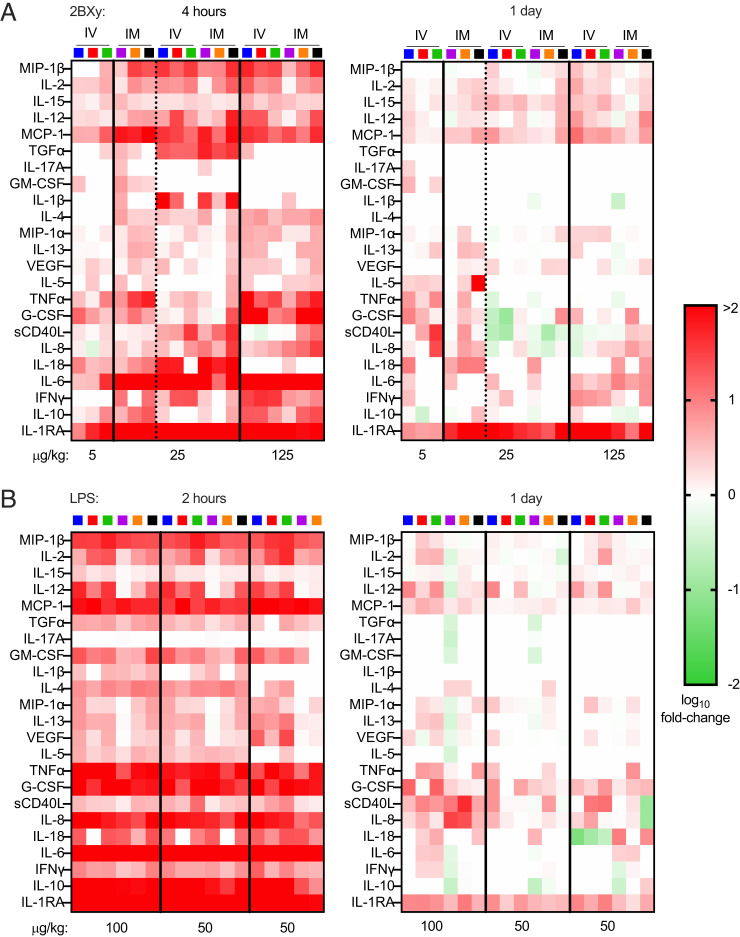
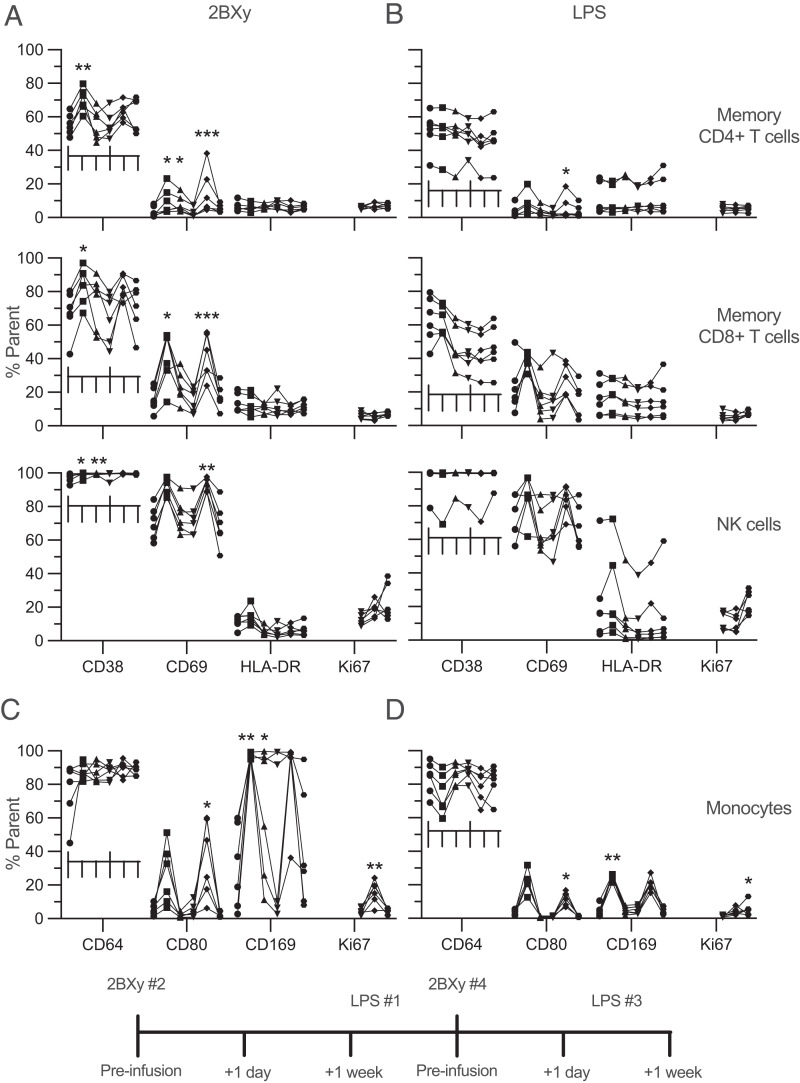
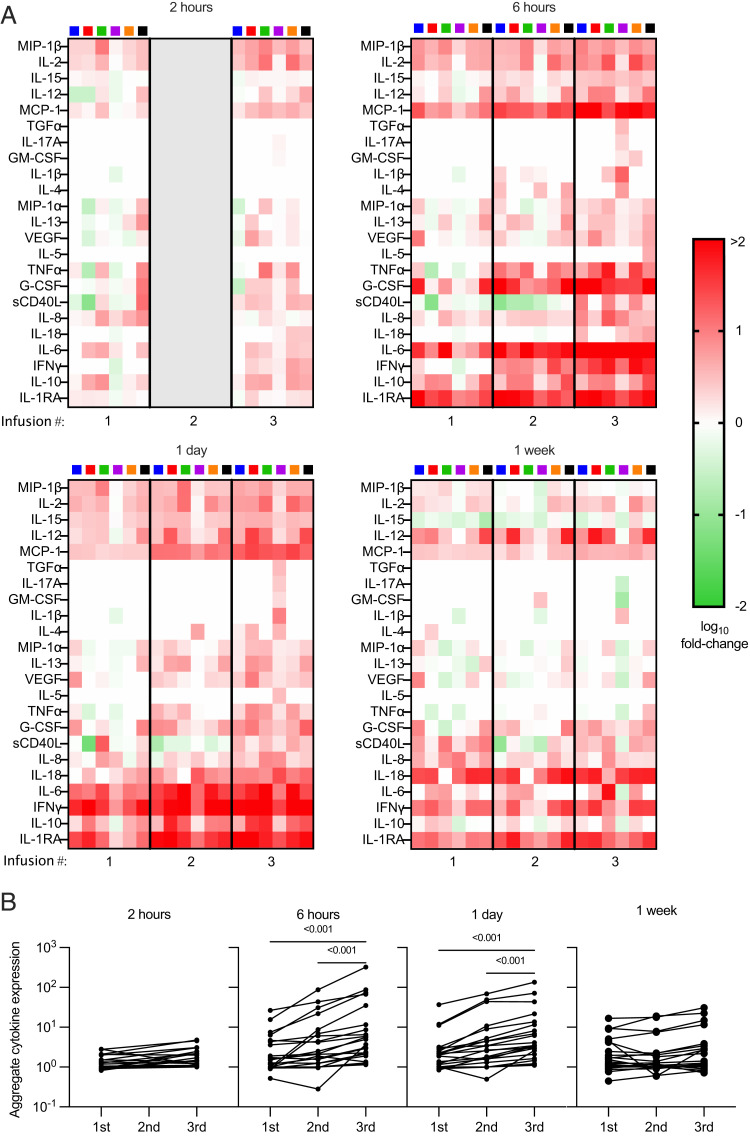
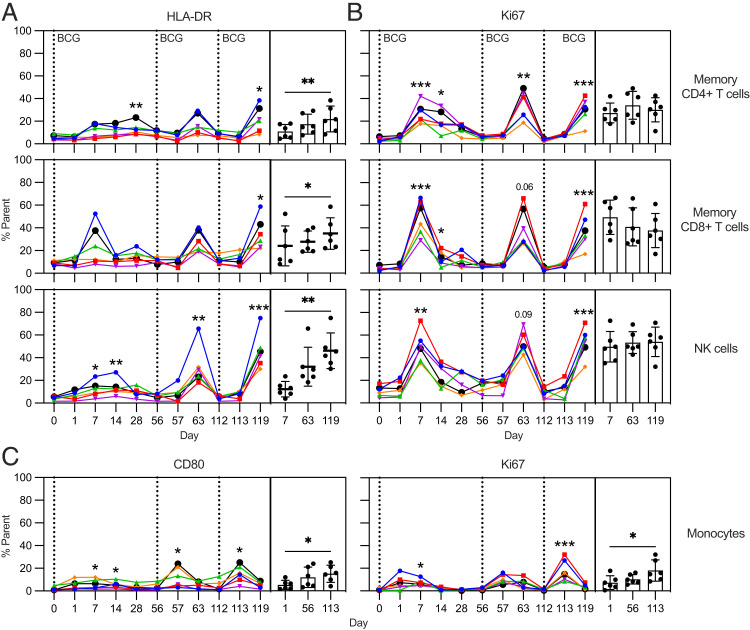
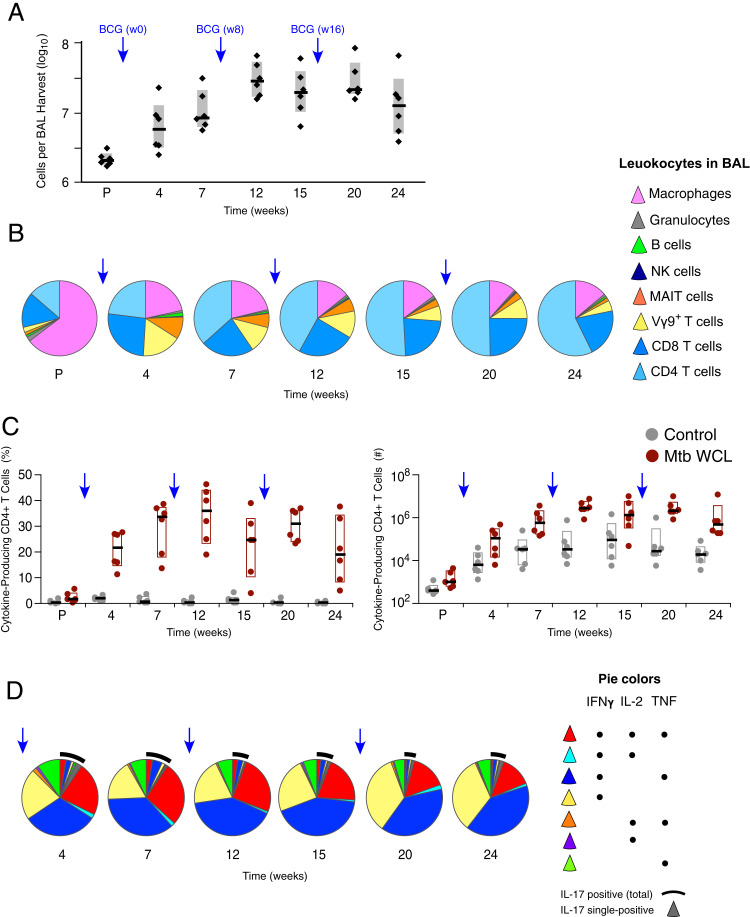
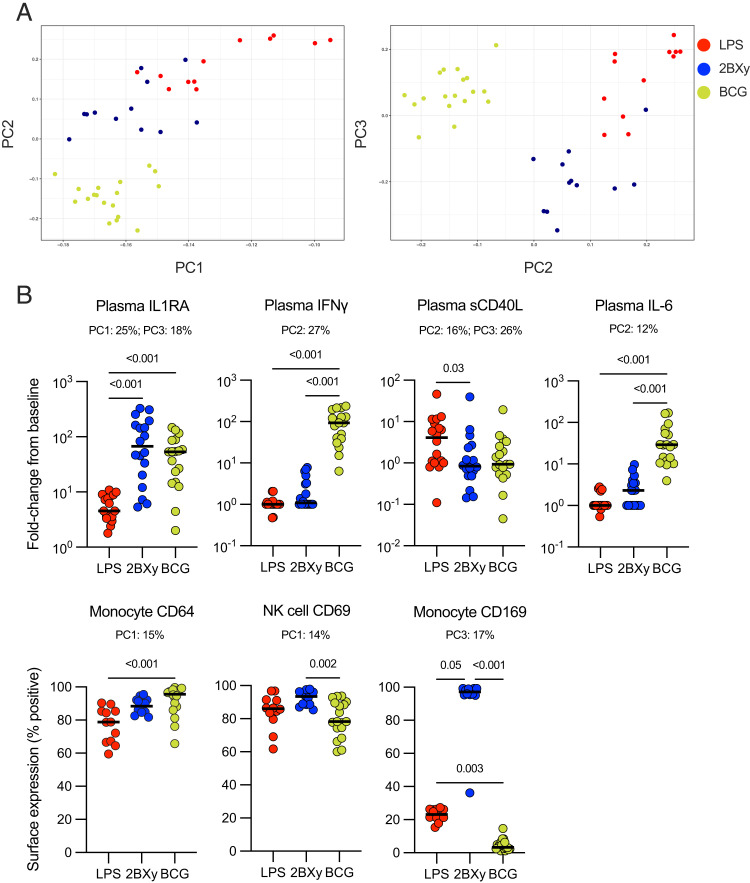
TLR agonists are a promising class of immune system stimulants investigated for immunomodulatory applications in cancer immunotherapy and viral diseases. In this study, we sought to characterize the safety and immune activation achieved by different TLR agonists in rhesus macaques (Macaca mulatta), a useful preclinical model of complex immune interactions. Macaques received one of three TLR agonists, followed by plasma cytokine, immune cell subset representation, and blood cell activation measurements. The TLR4 agonist LPS administered i.v. induced very transient immune activation, including TNF-α expression and monocyte activation. The TLR7/8 agonist 2BXy elicited more persistent cytokine expression, including type I IFN, IL-1RA, and the proinflammatory IL-6, along with T cell and monocyte activation. Delivery of 2BXy i.v. and i.m. achieved comparable immune activation, which increased with escalating dose. Finally, i.v. bacillus Calmette-Guérin (BCG) vaccination (which activates multiple TLRs, especially TLR2/4) elicited the most pronounced and persistent innate and adaptive immune response, including strong induction of IFN-γ, IL-6, and IL-1RA. Strikingly, monocyte, T cell, and NK cell expression of the proliferation marker Ki67 increased dramatically following BCG vaccination. This aligned with a large increase in total and BCG-specific cells measured in the lung. Principal component analysis of the combined cytokine expression and cellular activation responses separated animals by treatment group, indicating distinct immune activation profiles induced by each agent. In sum, we report safe, effective doses and routes of administration for three TLR agonists that exhibit discrete immunomodulatory properties in primates and may be leveraged in future immunotherapeutic strategies.


Conflict of interest statement

The authors have no financial conflicts of interest.

Figures

FIGURE 1.
FIGURE 1.
Design of NHP studies. (AC) 2BXy (A), LPS (B), or BCG (C) was administered to NHPs at the indicated time points. 2BXy was administered either i.v. or i.m. to groups of three animals. LPS and BCG were both administered i.v. to groups of 6 animals. Blood samples were collected for 2BXy at 0 and 4 h on the day of administration, then 1, 3, 7, and 14 d (and, where applicable, 21 d). For LPS, blood samples were collected at 0 and 2 h on the day of administration, then at 1, 3, 7, and 14 d. For the BCG-immunized animals, blood samples were collected at −7 d, then at 0, 2, and 6 h on the day of administration, and then 1, 3, 7, 14, 21, 28, and 49 d (and 56 d following the third administration). BAL samples were taken for BCG-immunized animals at −7, 28, and 49 d (and 56 d following the third administration).
FIGURE 2.
FIGURE 2.
Cytokine elicitation following LPS and 2BXy administration and 2BXy-reactive Ab responses. Plasma cytokine levels following TLR stimulation were measured by ELISA at the indicated time points. (A and B) Longitudinal (A) and peak (B) IFN-α concentration following 2BXy administration via i.v. (blue) or i.m. (red) routes. The dose at each administration (arrows) is given underneath the graphs, numbers under (B) indicate the administration number. Dashed lines represent the limit of detection of the assay. All times are in days unless otherwise indicated. Bars indicate mean value. Statistics were assessed using a Kruskal–Wallis test followed by a Dunn multiple comparison test comparing samples across all time points, within the same administration route. (C) Anti-2BXy titers were measured longitudinally by ELISA. Titers are expressed as area under the curve (AUC) for each time point. Each animal is represented by a unique colored line. (D) The relationships between the anti-2BXy titers measured at 8 wk and plasma IFN-α levels at 8 wk + 4 h or 8 wk + 1 d following the final 2BXy administration were assessed using a nonparametric Spearman correlation. Colors of data points correspond to individual animals in (C). (E and F) Longitudinal (E) and peak (F) TNF-α concentration following LPS administration. Each animal is represented by a unique colored line. All times are in days unless otherwise indicated. Bars indicate mean value. Statistics were assessed using a Kruskal–Wallis test followed by a Dunn multiple comparison test comparing samples across all time points.
FIGURE 3.
FIGURE 3.
Cytokine elicitation following 2BXy and LPS administration. (A and B) Plasma cytokine levels at 2/4 h and 1 d following each of three administrations of either 2BXy (A) or LPS (B). Heatmaps represent the log10 fold change in cytokine expression as measured by Luminex in each animal between the time of administration and the indicated time point. Each column is an individual animal, represented by a colored square above each column. The dashed lines in (A) delineate between animals receiving their first or second administration of 2BXy. TLR agonist dose is given below the graph.
FIGURE 4.
FIGURE 4.
Cellular activation following 2BXy and LPS administration. (AD) Expression of cell surface activation markers was measured by flow cytometry at baseline, 1 d and 1 wk following the second and fourth infusions of 2BXy (A and C), and following the first and third infusions of LPS (B and D). Data represent the percentage of the cell population labeled expressing the indicated marker at the time points indicated at bottom. Statistics were assessed using a Friedman test followed by a Dunn multiple comparison test comparing matched samples from postadministration to the most recent infusion baseline. *p > 0.05, **p > 0.01, ***p > 0.001.
FIGURE 5.
FIGURE 5.
Cytokine elicitation following BCG immunization. Cytokines in plasma were measured using a Luminex panel at time of administration, 2 h, 6 h, 1 d, and 1 wk following immunization with BCG. (A) Heatmaps represent the log10 fold change in cytokine expression in each animal between the time of administration and the indicated time point. Each column is an individual animal, represented by a colored square above each column. (B) Geometric mean fold change in expression of each of the cytokines measured in plasma by Luminex compared following each BCG vaccination at the time points indicated. Each dot represents the geometric mean fold change in expression of an individual cytokine at that time point. Significance was assessed by a Friedman test followed by a Dunn multiple comparison test comparing samples across each BCG administration.
FIGURE 6.
FIGURE 6.
Cellular activation following BCG immunization. (AC) Expression levels of (A) HLA-DR, (B) Ki67, and (C) monocyte cell surface activation markers were measured by flow cytometry at baseline and indicated time points following BCG vaccination. Data represent the percentage of the cell population labeled expressing the indicated marker. Bar graphs to the right of each panel indicate the peak cytokine expression time point following each immunization. Bars indicate mean expression. Statistics were assessed using a Friedman test followed by a Dunn multiple comparison test comparing matched samples after administration time points to the baseline at the most recent infusion (left of each panel) or comparing each of the peak cytokine expression time points (bar graph at right of each panel). *p > 0.05, **p > 0.01, ***p > 0.001.
FIGURE 7.
FIGURE 7.
Tuberculosis-specific T cell responses following BCG immunization. M. tuberculosis T cell responses were measured in the BAL of macaques following BCG vaccination. (A) Total numbers of viable leukocytes per BAL collection were quantified at each time point. Blue arrows indicate timing of BCG vaccinations. Black lines indicate medians and gray bars indicate interquartile ranges. P, prevaccination. (B) Cellular composition of leukocyte populations within BAL at each time point. (C) Percentage and total number of memory CD4+ T cells in PBMCs producing IFN-γ, IL-2, TNF-α, or IL-17 after stimulation with M. tuberculosis whole-cell lysate (Mtb WCL) or DMSO (control). Black horizontal lines indicate medians and boxes indicate interquartile ranges. (D) Quality of the T cell response following each immunization. Pie graphs represent the proportion of the total response comprising each cytokine combination, averaged for all NHPs. The proportion of the response producing IL-17 (with or without other cytokines) is indicated with a black arc.
FIGURE 8.
FIGURE 8.
PCA of integrated Luminex and flow cytometry data for TLR agonist groups. (A) A PCA analysis was performed on flow cytometry and Luminex data from 1 d following TLR agonist administration. Data are shown from the two LPS and 2BXy administrations where flow cytometry data were collected, and all three BCG administrations were used. Two-dimensional plots display scores of the first PCs (PC1 versus PC2 and PC2 versus PC3) for samples exposed to 2BXy (blue), BCG (green), and LPS (red) TLR agonists. The PCA was conducted using R with the prcomp, ggplot, and factoextra libraries. (B) The highest ranked variable contributions to each PC is graphed. The legend beneath each graph title indicates the relative contribution to the PCs for each parameter. Horizontal bars indicate median. Statistics were assessed using a Kruskal–Wallis test followed by a Dunn posttest.

Similar articles

Cited by

References

    1. Zhang, H., Chen J.. 2018. Current status and future directions of cancer immunotherapy. J. Cancer 9: 1773–1781. - PMC - PubMed
    1. Tashiro, H., Brenner M. K.. 2017. Immunotherapy against cancer-related viruses. Cell Res. 27: 59–73. - PMC - PubMed
    1. Botos, I., Segal D. M., Davies D. R.. 2011. The structural biology of Toll-like receptors. Structure 19: 447–459. - PMC - PubMed
    1. Kawai, T., Akira S.. 2010. The role of pattern-recognition receptors in innate immunity: update on Toll-like receptors. Nat. Immunol. 11: 373–384. - PubMed
    1. Kawasaki, T., Kawai T.. 2014. Toll-like receptor signaling pathways. Front. Immunol. 5: 461. - PMC - PubMed

Publication types