

Soluble LDL-receptor is induced by TNF-α and inhibits hepatocytic clearance of LDL-cholesterol
- PMID: 37861809
- PMCID: PMC10697900
- DOI: 10.1007/s00109-023-02379-4
Soluble LDL-receptor is induced by TNF-α and inhibits hepatocytic clearance of LDL-cholesterol
Abstract
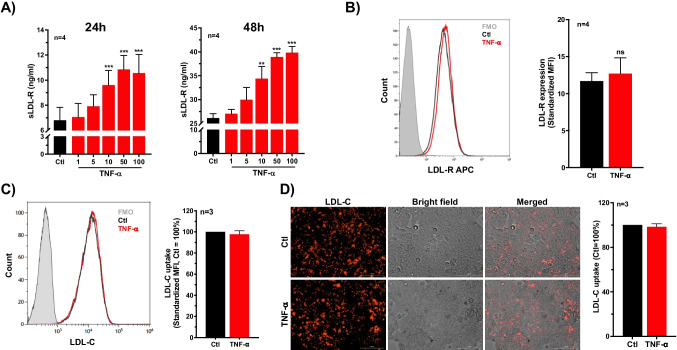
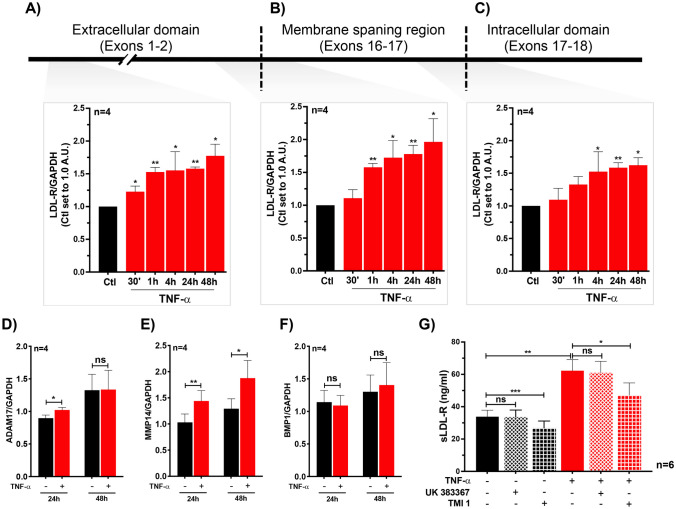
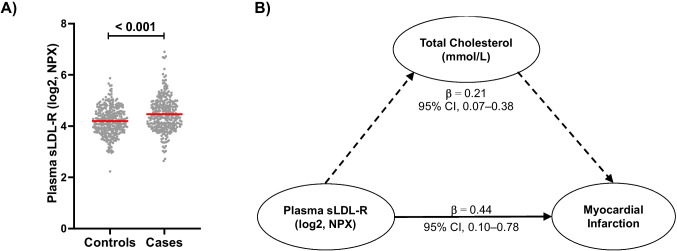
Defective LDL-C clearance and hence its elevation in the circulation is an established risk factor for cardiovascular diseases (CVDs) such as myocardial infarction (MI). A soluble LDL-receptor (sLDL-R) has been detected in human plasma which correlates strongly with circulating LDL-C and classical conditions that promote chronic inflammation. However, the mechanistic interplay between sLDL-R, inflammation, and CVDs remains to be investigated. Here, we report that stimulation of HepG2 cells with TNF-α induces the release of sLDL-R into culture supernatants. In addition, TNF-α induces gene expression of peptidases ADAM-17 and MMP-14 in HepG2 cells, and inhibiting these peptidases using TMI 1 significantly reduces the TNF-α induced sLDL-R release. We found that a soluble form of recombinant LDL-R (100 nM) can strongly bind to LDL-C and form a stable complex (KD = E-12). Moreover, incubation of HepG2 cells with this recombinant LDL-R resulted in reduced LDL-C uptake in a dose-dependent manner. In a nested case-control study, we found that baseline sLDL-R in plasma is positively correlated with plasma total cholesterol level. Furthermore, a twofold increase in plasma sLDL-R was associated with a 55% increase in the risk of future MI [AOR = 1.55 (95% CI = 1.10-2.18)]. Nevertheless, mediation analyses revealed that a significant proportion of the association is mediated by elevation in plasma cholesterol level (indirect effect β = 0.21 (95% CI = 0.07-0.38). Collectively, our study shows that sLDL-R is induced by a pro-inflammatory cytokine TNF-α via membrane shedding. Furthermore, an increase in sLDL-R could inhibit hepatic clearance of LDL-C increasing its half-life in the circulation and contributing to the pathogenesis of MI. KEY MESSAGES: TNF-α causes shedding of hepatocytic LDL-R through induction of ADAM-17 and MMP-14. sLDL-R binds strongly to LDL-C and inhibits its uptake by hepatocytic cells. Plasma sLDL-R is positively correlated with TNF-α and cholesterol. Plasma sLDL-R is an independent predictor of myocardial infarction (MI). Plasma cholesterol mediates the association between sLDL-R and MI.
Keywords: ADAM-17; Chronic inflammation; Hypercholesterolemia; MMP-14; Mediation analyses; Myocardial infarction.
© 2023. The Author(s).
Conflict of interest statement
The authors declare no competing interests.
Figures


References
-
- Borén J, John Chapman M, Krauss RM, Packard CJ, Bentzon JF, Binder CJ et al (2020) Low-density lipoproteins cause atherosclerotic cardiovascular disease: pathophysiological, genetic, and therapeutic insights: a consensus statement from the European Atherosclerosis Society Consensus Panel. Eur Heart J 41(24):2313–30 - PMC - PubMed
-
- Südhof TC, Goldstein JL, Brown MS, Russell DW (1979) The LDL receptor gene: a mosaic of exons shared with different proteins. Science 1985;228(4701):815–22. Available from: https://www.science.org/doi/10.1126/science.2988123 - DOI - PMC - PubMed
-
- Benito-Vicente A, Uribe K, Jebari S, Galicia-Garcia U, Ostolaza H, Martin C. Validation of LDLr activity as a tool to improve genetic diagnosis of familial hypercholesterolemia: a retrospective on functional characterization of LDLr variants. Int J Mol Sci. 2018;19(6):1676. doi: 10.3390/ijms19061676. - DOI - PMC - PubMed
Publication types
MeSH terms
Substances
Grants and funding
LinkOut - more resources
Full Text Sources
Medical
Miscellaneous
