. 2023 Oct 20;258(5):102.
doi: 10.1007/s00425-023-04255-4.

Ionic, not the osmotic component, is responsible for the salinity-induced inhibition of greening in etiolated wheat (Triticum aestivum L. cv. Mv Béres) leaves: a comparative study

Affiliations

Ionic, not the osmotic component, is responsible for the salinity-induced inhibition of greening in etiolated wheat (Triticum aestivum L. cv. Mv Béres) leaves: a comparative study

Adél Sóti et al. Planta. .

Abstract

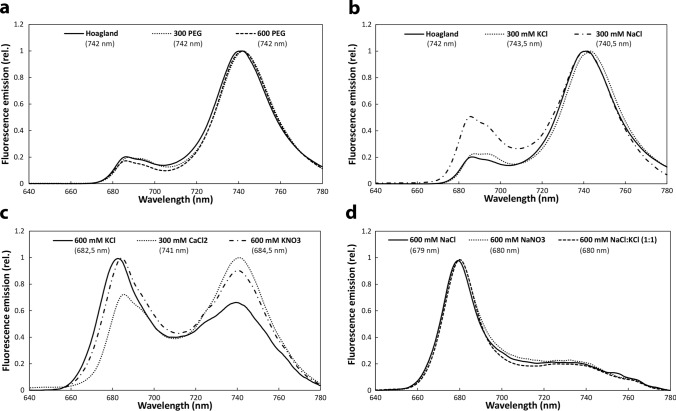
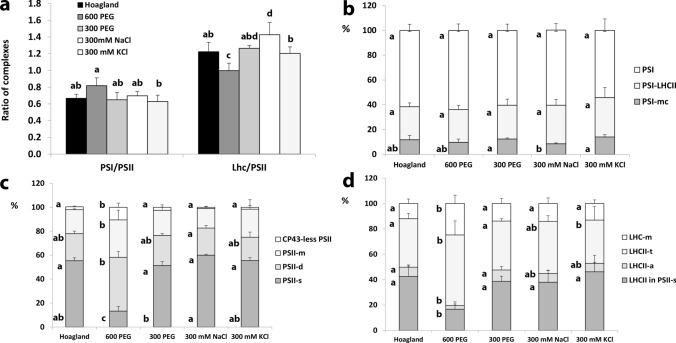
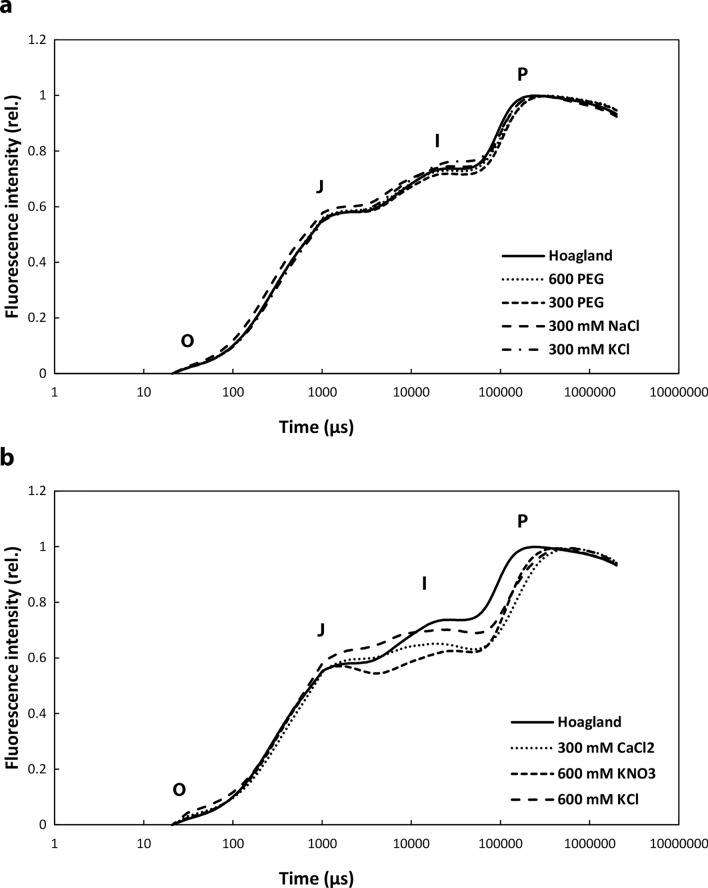
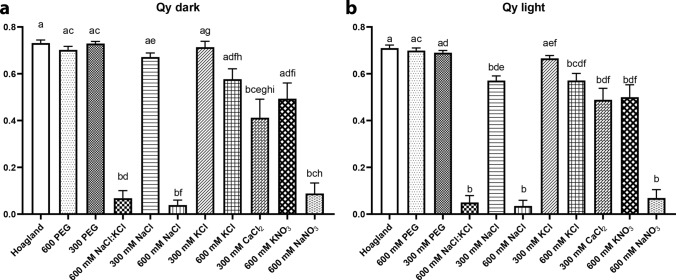
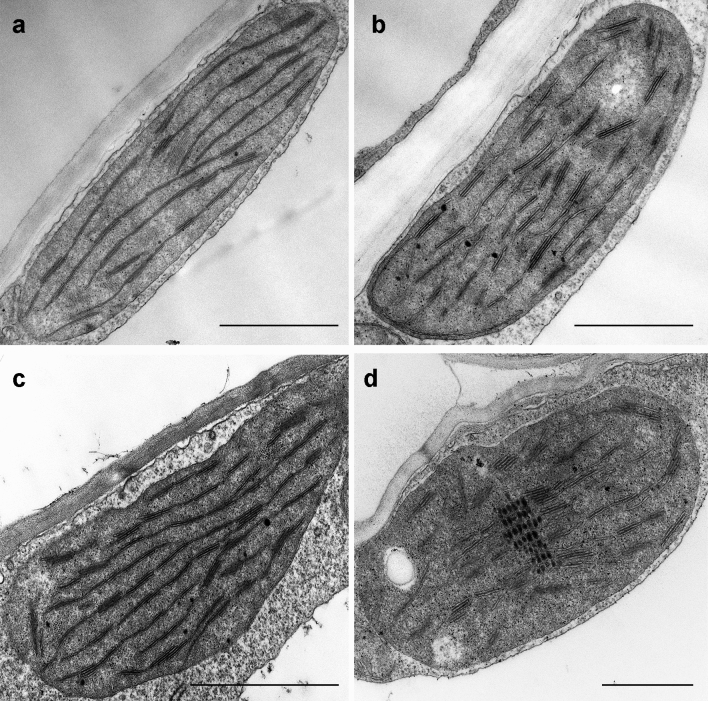
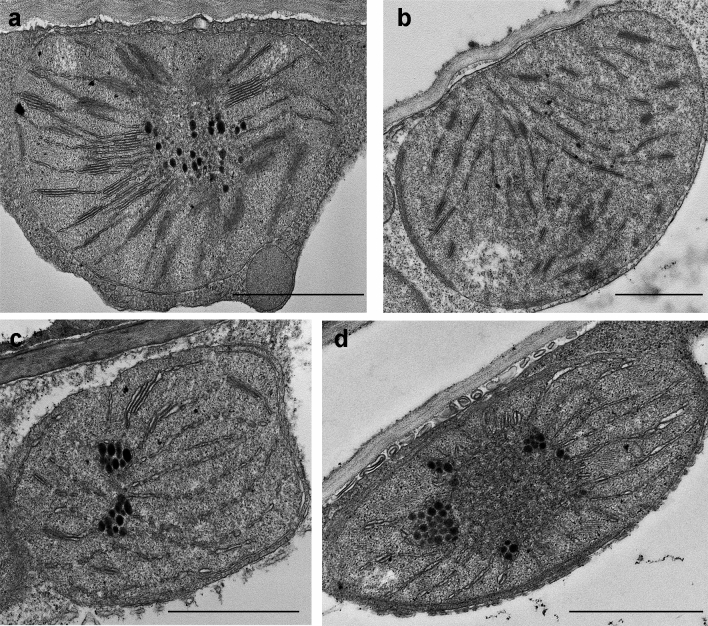
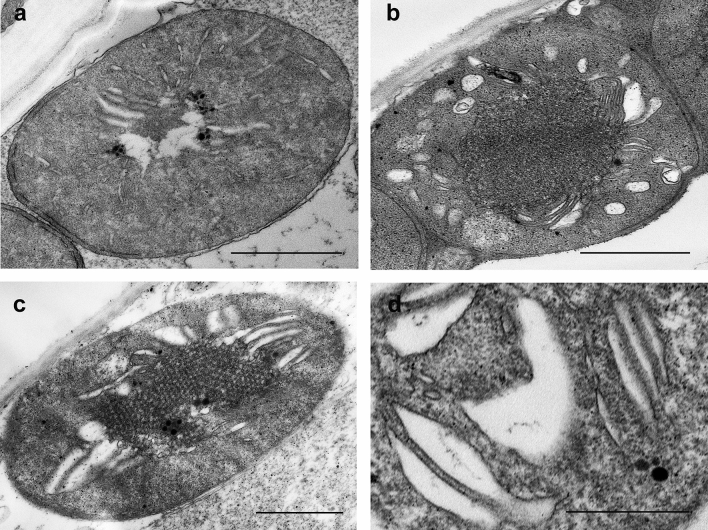
Greening was partially (in 300 mM NaCl, CaCl2, 600 mM KNO3 or KCl) or fully inhibited (in 600 mM NaCl, NaNO3 or NaCl:KCl) by the ionic and not the osmotic component of salinity. Although high soil salinity is an increasing global problem, not much is known about how direct exposure to salinity affects etiolated leaves of seedlings germinating in the soil and then reaching the surface. We investigated the effect of various salt treatments on the greening process of leaves in 8- to 11-day-old etiolated wheat (Triticum aestivum L. Mv. Béres) seedlings. Etiolated leaf segments pre-treated on different salt (600 mM NaCl:KCl 1:1, 600 mM NaCl, 600 mM KCl, 600 mM NaNO3, 600 mM KNO3, 300 mM KCl, 300 mM NaCl or 300 mM CaCl2) or isosmotic polyethylene glycol 6000 (PEG) solutions for 1.5 h in the dark and then greened for 16 h on the same solutions were studied. Leaf segments greened on PEG (osmotic stress) or on 300 mM KCl had similar chloroplasts compared to control samples greened on Hoagland solution. Slightly slower development of chloroplast structure and function (photosynthetic activity) was observed in segments greened on 300 mM NaCl or CaCl2, 600 mM KNO3 or KCl. However, etioplast-to-chloroplast transformation and chlorophyll accumulation were fully inhibited and peculiar prothylakoid swelling occurred in segments greened on 600 mM NaCl, NaNO3 or NaCl:KCl (1:1) solutions. The data indicate that not the high osmolarity of the used salt solution, but its ions, especially Na+, had the strongest negative impact on these processes.

Keywords: Chloroplast; Etioplast; Greening; Osmotic stress; Prolamellar body; Salt stress.


Conflict of interest statement

The authors have no competing interests to declare that are relevant to the content of this article.

Figures

Fig. 1
Fig. 1
Normalised and averaged 77 K fluorescence emission spectra of etiolated wheat (Triticum aestivum L. cv. Mv. Béres) leaf segments floated on various solutions for 1.5 h in the dark and then greened for 16 h on the same solution. Applied solutions: Hoagland, 300 PEG, 600 PEG (a), Hoagland, 300 mM KCl, 300 mM NaCl (b), 300 mM CaCl2, 600 mM KCl, 600 mM KNO3 (c), 600 mM NaCl, 600 mM NaNO3, 600 mM NaCl:KCl (1:1) (d). Excitation wavelength: 440 nm. The positions of the fluorescence emission maxima of the spectra are also indicated in parenthesis for all treatments (n = 11–44)
Fig. 2
Fig. 2
Thylakoid complexes present in the wheat (Triticum aestivum L. cv. Mv Béres) leaf segments floated on various solutions for 1.5 h in the dark and then greened for 16 h on the same solution. Applied solutions: Hoagland, 600 PEG, 300 PEG, 300 mM NaCl, 300 mM KCl. a Thylakoids (250 µg Chl ml−1; µg protein µg−1 Chl ~ 10) were solubilised using 2% n-dodecyl-β-D-maltoside plus 1% digitonin and separated in 4.5–12% BN gel gradient. PS, photosystem; LHC, Lhc—light-harvesting complex; LHCII-a—LHCII-assembly: CP29-CP24-LHCII trimer; mc, megacomplex; s, supercomplex; t, trimer; d, dimer; m, monomer; Cyt b/f-d, cytochrome b6f complex; ATPs, ATP synthase; C, core complex of PSII; S and M, strongly and moderately bound LHCII trimers, respectively. b 2D BN/SDS-PAGE of 300 PEG sample. Standard proteins: PageRuler™ Plus Prestained Protein Ladder (ThermoFisher Scientific 26,619, Lot #00803392). c Distribution of leaf Chl content amongst the complexes. Error bars represent SD values (n = 3–20). Different letters indicate statistically significant differences between the samples according to 1-way ANOVA followed by Tukey’s multiple comparisons test (P < 0.05)
Fig. 3
Fig. 3
Ratios of thylakoid complexes and distribution amongst their assembly forms in the wheat (Triticum aestivum L. cv. Mv Béres) leaf segments floated on various solutions for 1.5 h in the dark and then greened for 16 h on the same solution. Applied solutions: Hoagland, 600 PEG, 300 PEG, 300 mM NaCl, 300 mM KCl. a Characteristic ratios of the main Chl-containing complexes calculated as the sum of PSI and PSII bands in the 1st-dimensional BN PAGE patterns, i.e. they contain the core complexes together with their antennae (Sárvári et al. 2022). Distribution of PSI (b), PSII (c), and LHCII complexes (d) amongst their different assembly forms calculated from the 1st-dimensional BN PAGE (PSI) and the 2nd-dimensional SDS-PAGE patterns (PSII, LHCII), respectively. Error bars represent SD values. Different letters indicate statistically significant differences between the samples according to 1-way ANOVA followed by Tukey’s multiple comparisons test or according to Kruskal–Wallis non-parametric ANOVA followed by Dunn’s multiple comparisons test (P < 0.05) (n = 4–14)
Fig. 4
Fig. 4
Fast chlorophyll a fluorescence OJIP transients of the wheat (Triticum aestivum L. cv. Mv Béres) leaf segments floated on various solutions for 1.5 h in the dark and then greened for 16 h on the same solution. Applied solutions: Hoagland, 600 PEG, 300 PEG, 300 mM NaCl, 300 mM KCl (a), Hoagland, 300 mM CaCl2, 600 mM KNO3, 600 mM KCl (b). Plants were dark-adapted for 20 min before the OJIP transients were recorded, and the transients were double normalised to F0 and Fm and then averaged (n = 10–17)
Fig. 5
Fig. 5
The maximal (Qy dark) and actual (Qy light) quantum efficiency of PS II of the wheat (Triticum aestivum L. cv. Mv Béres) leaf segments floated on various solutions for 1.5 h in the dark and then greened for 16 h on the same solution. Applied solutions: Hoagland, 600 PEG, 300 PEG, 600 mM NaCl:KCl (1:1), 300 mM NaCl, 600 mM NaCl, 300 mM KCl, 600 mM KCl, 300 mM CaCl2, 600 mM KNO3, 600 mM NaNO3. Plants were dark-adapted for 20 min before the Qy dark data were recorded. Error bars represent standard error. Different letters indicate statistically significant differences between the samples according to Kruskal–Wallis non-parametric ANOVA followed by Dunn’s multiple comparisons test (P < 0.05) (Qy dark, n = 10–20; Qy light, n = 10–33)
Fig. 6
Fig. 6
Typical plastid ultrastructure after 1.5 h dark pretreatment followed by 16 h greening of wheat (Triticum aestivum L. cv. Mv. Béres) leaf segments floating on different solutions: Hoagland (a), 600 PEG (b), 300 PEG (c), 300 mM KCl (d). Bar = 1 μm
Fig. 7
Fig. 7
Typical plastid ultrastructure after 1.5 h dark pretreatment followed by 16 h greening of wheat (Triticum aestivum L. Cv. Mv. Béres) leaf segments floating on different solutions: 300 mM NaCl (a), 300 mM CaCl2 (b), 600 mM KNO3 (c), 600 mM KCl (d). Bar = 1 μm
Fig. 8
Fig. 8
Typical plastid ultrastructure after 1.5 h dark pretreatment followed by 16 h greening of wheat (Triticum aestivum L. Cv. Mv. Béres) leaf segments floating on different solutions: 600 mM NaCl:KCl (1:1) (a), 600 mM NaCl (b), 600 mM NaNO3 (c−d). d The characteristic swelling observed in all samples. Bar = 1 μm (a−c) and 0.5 μm (d)

References

    1. Abdelkader AF, Aronsson H, Solymosi K, et al. High salt stress induces swollen prothylakoids in dark-grown wheat and alters both prolamellar body transformation and reformation after irradiation. J Exp Bot. 2007;58:2553–2564. doi: 10.1093/jxb/erm085. - DOI - PubMed
    1. Abdelkader AF, Aronsson H, Sundqvist C. High salt stress in wheat leaves causes retardation of chlorophyll accumulation due to a limited rate of protochlorophyllide formation. Physiol Plant. 2007;130:157–166. doi: 10.1111/j.1399-3054.2007.00885.x. - DOI
    1. Allakhaverdiev SI, Nishiyama Y, Miyairi S, et al. Salt stress inhibits the repair of photodamaged photosystem II by suppressing the transcription and translation of psbA genes in Synechocystis. Plant Physiol. 2002;130:1443–1453. doi: 10.1104/pp.011114. - DOI - PMC - PubMed
    1. Armarego-Marriott T, Sandoval-Ibañez O, Kowalewska Ł. Beyond the darkness: recent lessons from etiolation and de-etiolation studies. J Exp Bot. 2020;71:1215–1225. doi: 10.1093/jxb/erz496. - DOI - PMC - PubMed
    1. Aro E-M, Suorsa M, Rokka A, et al. Dynamics of photosystem II: a proteomic approach to thylakoid protein complexes. J Exp Bot. 2005;56:347–356. doi: 10.1093/jxb/eri041. - DOI - PubMed

LinkOut - more resources