

Optimization of Q.Clear reconstruction for dynamic 18F PET imaging
- PMID: 37861929
- PMCID: PMC10589167
- DOI: 10.1186/s40658-023-00584-1
Optimization of Q.Clear reconstruction for dynamic 18F PET imaging
Abstract
Background: Q.Clear, a Bayesian penalized likelihood reconstruction algorithm, has shown high potential in improving quantitation accuracy in PET systems. The Q.Clear algorithm controls noise during the iterative reconstruction through a β penalization factor. This study aimed to determine the optimal β-factor for accurate quantitation of dynamic PET scans.
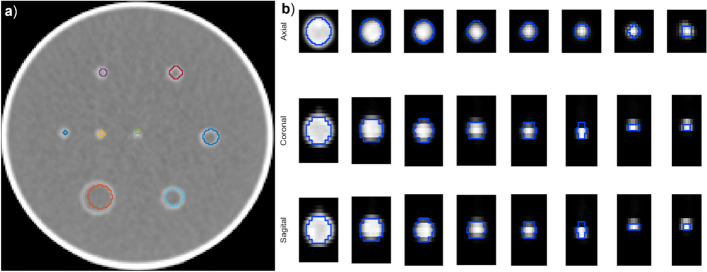
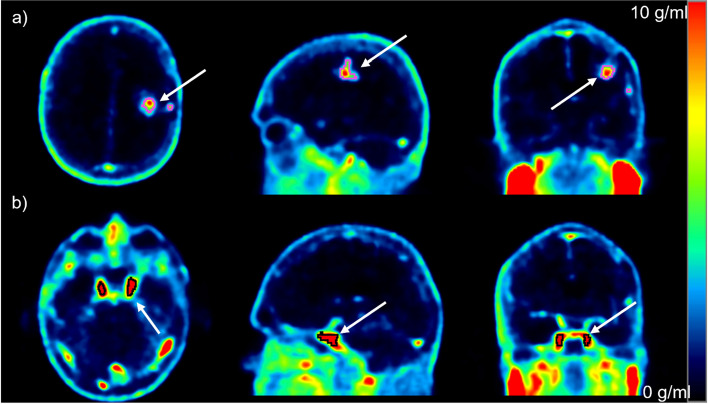
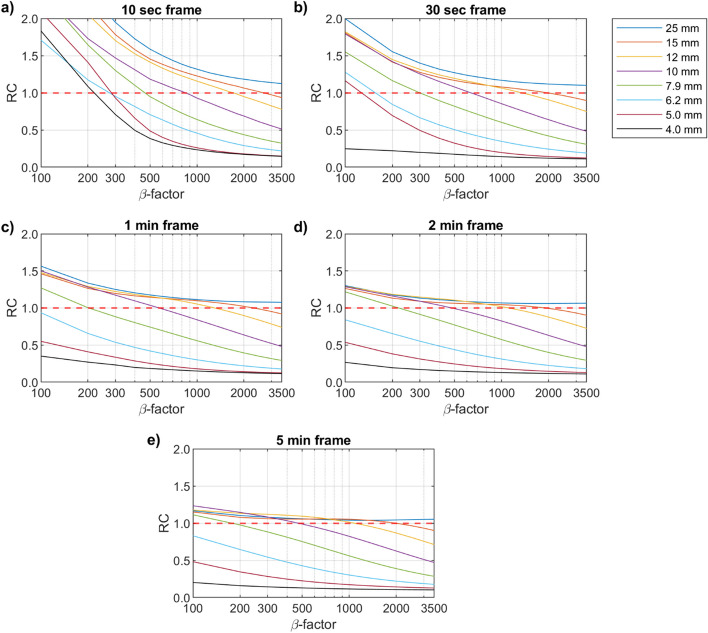
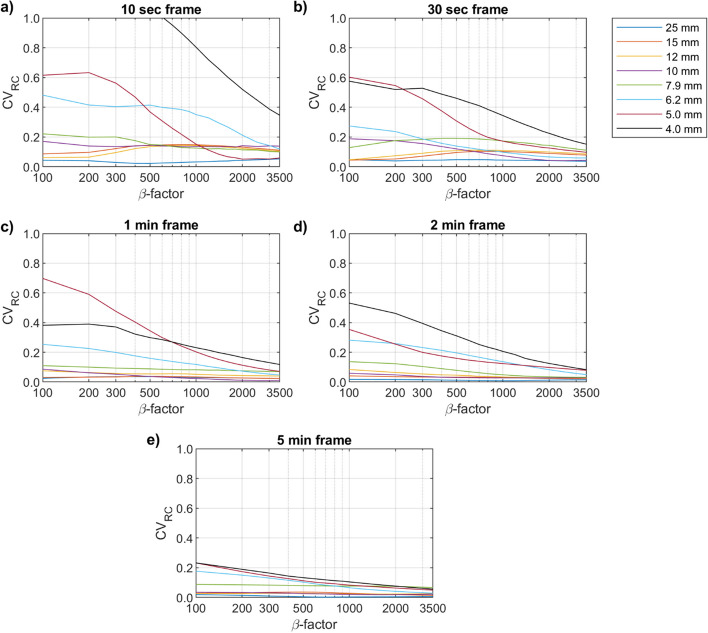
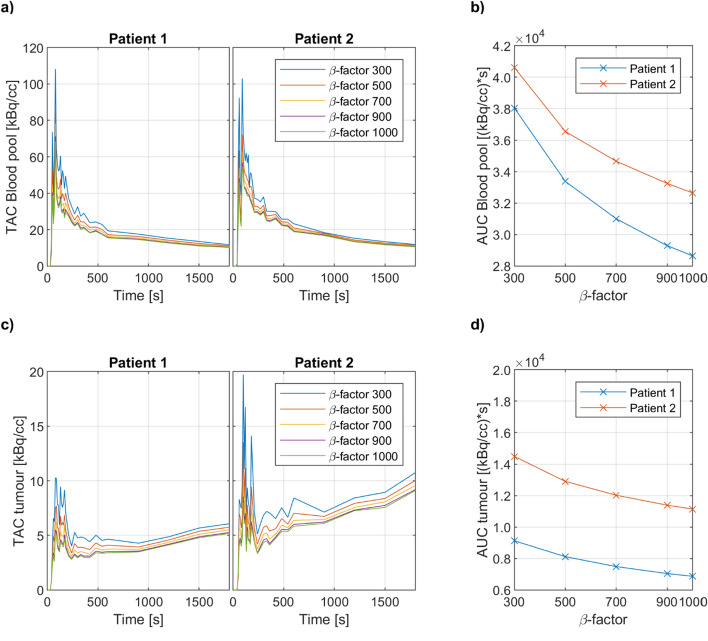
Methods: A Flangeless Esser PET Phantom with eight hollow spheres (4-25 mm) was scanned on a GE Discovery MI PET/CT system. Data were reconstructed into five sets of variable acquisition times using Q.Clear with 18 different β-factors ranging from 100 to 3500. The recovery coefficient (RC), coefficient of variation (CVRC) and root-mean-square error (RMSERC) were evaluated for the phantom data. Two male patients with recurrent glioblastoma were scanned on the same scanner using 18F-PSMA-1007. Using an irreversible two-tissue compartment model, the area under curve (AUC) and the net influx rate Ki were calculated to assess the impact of different β-factors on the pharmacokinetic analysis of clinical PET brain data.
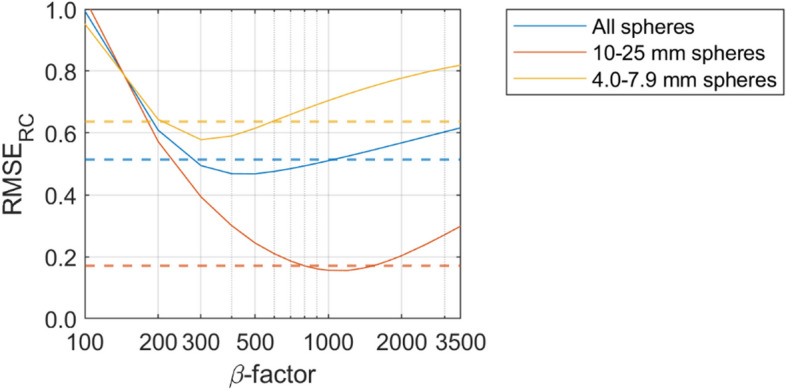
Results: In general, RC and CVRC decreased with increasing β-factor in the phantom data. For small spheres (< 10 mm), and in particular for short acquisition times, low β-factors resulted in high variability and an overestimation of measured activity. Increasing the β-factor improves the variability, however at a cost of underestimating the measured activity. For the clinical data, AUC decreased and Ki increased with increased β-factor; a change in β-factor from 300 to 1000 resulted in a 25.5% increase in the Ki.
Conclusion: In a complex dynamic dataset with variable acquisition times, the optimal β-factor provides a balance between accuracy and precision. Based on our results, we suggest a β-factor of 300-500 for quantitation of small structures with dynamic PET imaging, while large structures may benefit from higher β-factors.
Trial registration: Clinicaltrials.gov, NCT03951142. Registered 5 October 2019, https://clinicaltrials.gov/ct2/show/NCT03951142 . EudraCT no 2018-003229-27. Registered 26 February 2019, https://www.clinicaltrialsregister.eu/ctr-search/trial/2018-003229-27/NO .
Keywords: Dynamic PET; Q.Clear; Quantitation; Recovery coefficient; β-factor.
© 2023. Springer Nature Switzerland AG.
Conflict of interest statement
The authors declare that they have no competing interests.
Figures
References
-
- Croteau E, Lavallée E, Labbe SM, Hubert L, Pifferi F, Rousseau JA, et al. Image-derived input function in dynamic human PET/CT: methodology and validation with 11C-acetate and 18F-fluorothioheptadecanoic acid in muscle and 18F-fluorodeoxyglucose in brain. Eur J Nucl Med Mol Imaging. 2010;37(8):1539–1550. doi: 10.1007/s00259-010-1443-z. - DOI - PMC - PubMed
Associated data
Grants and funding
LinkOut - more resources
Full Text Sources
Medical
Miscellaneous
