. 2023 Oct 31;42(10):113291.
doi: 10.1016/j.celrep.2023.113291. Epub 2023 Oct 19.

Mitochondria-lysosome-related organelles mediate mitochondrial clearance during cellular dedifferentiation

Affiliations

Mitochondria-lysosome-related organelles mediate mitochondrial clearance during cellular dedifferentiation

Xiaowen Ma et al. Cell Rep. .

Abstract

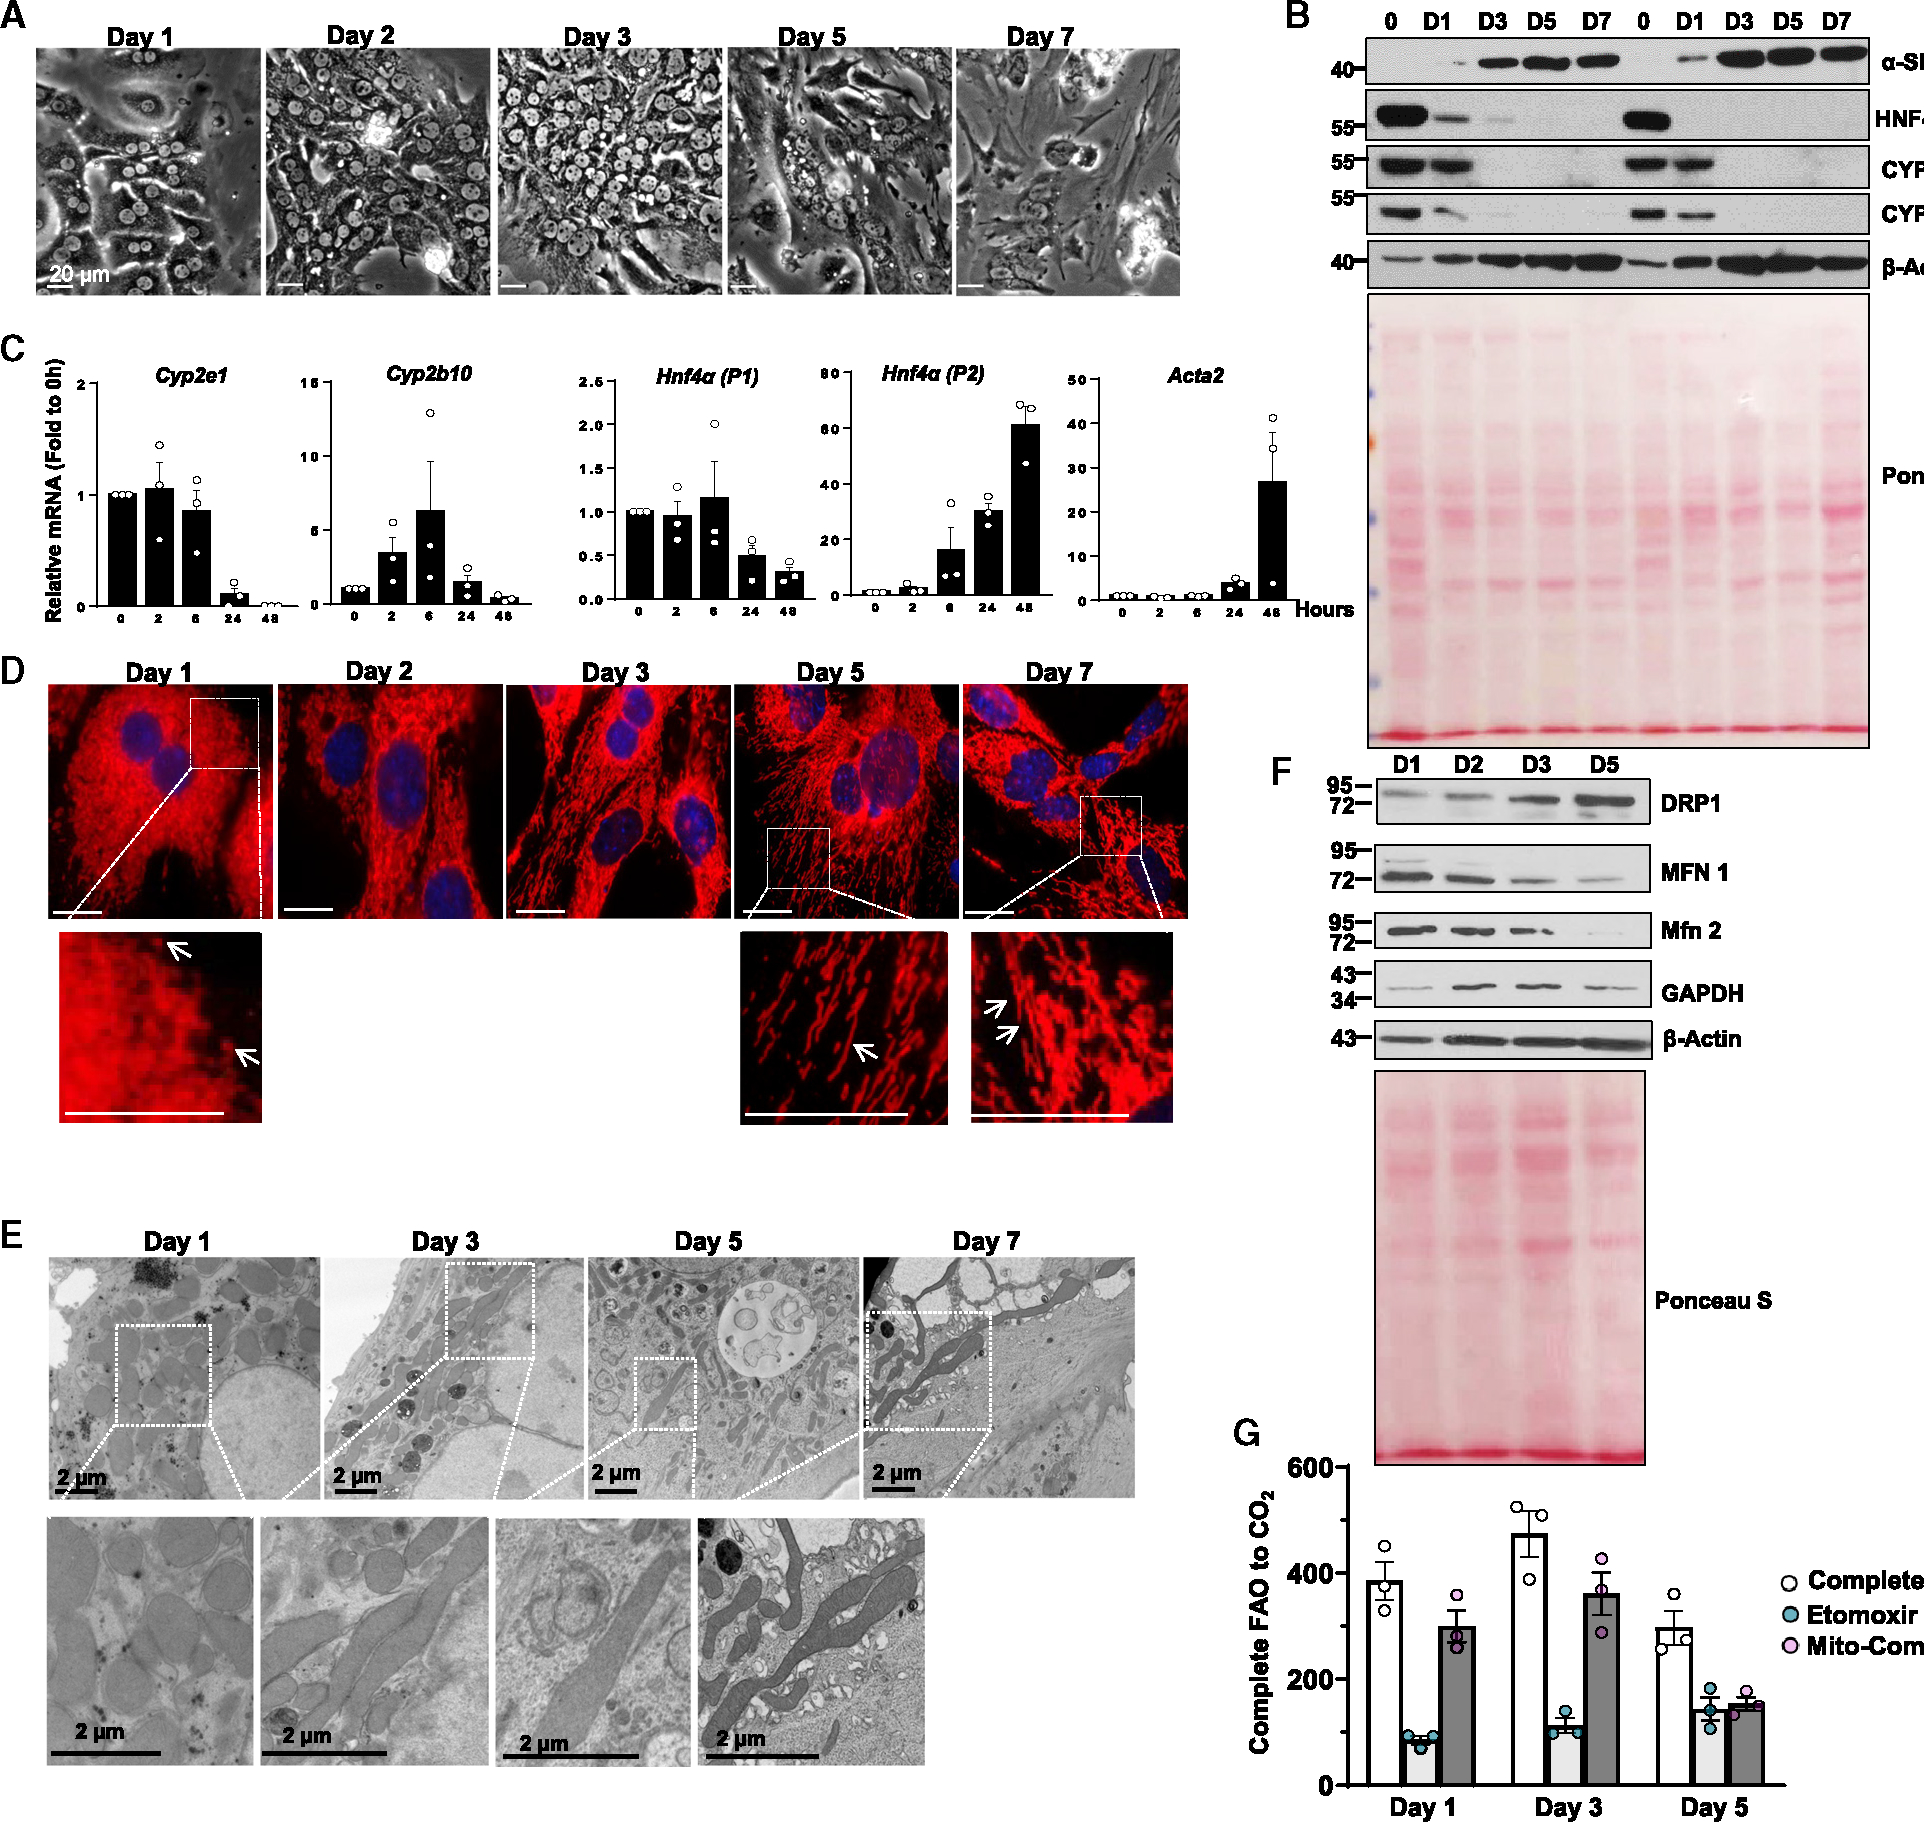
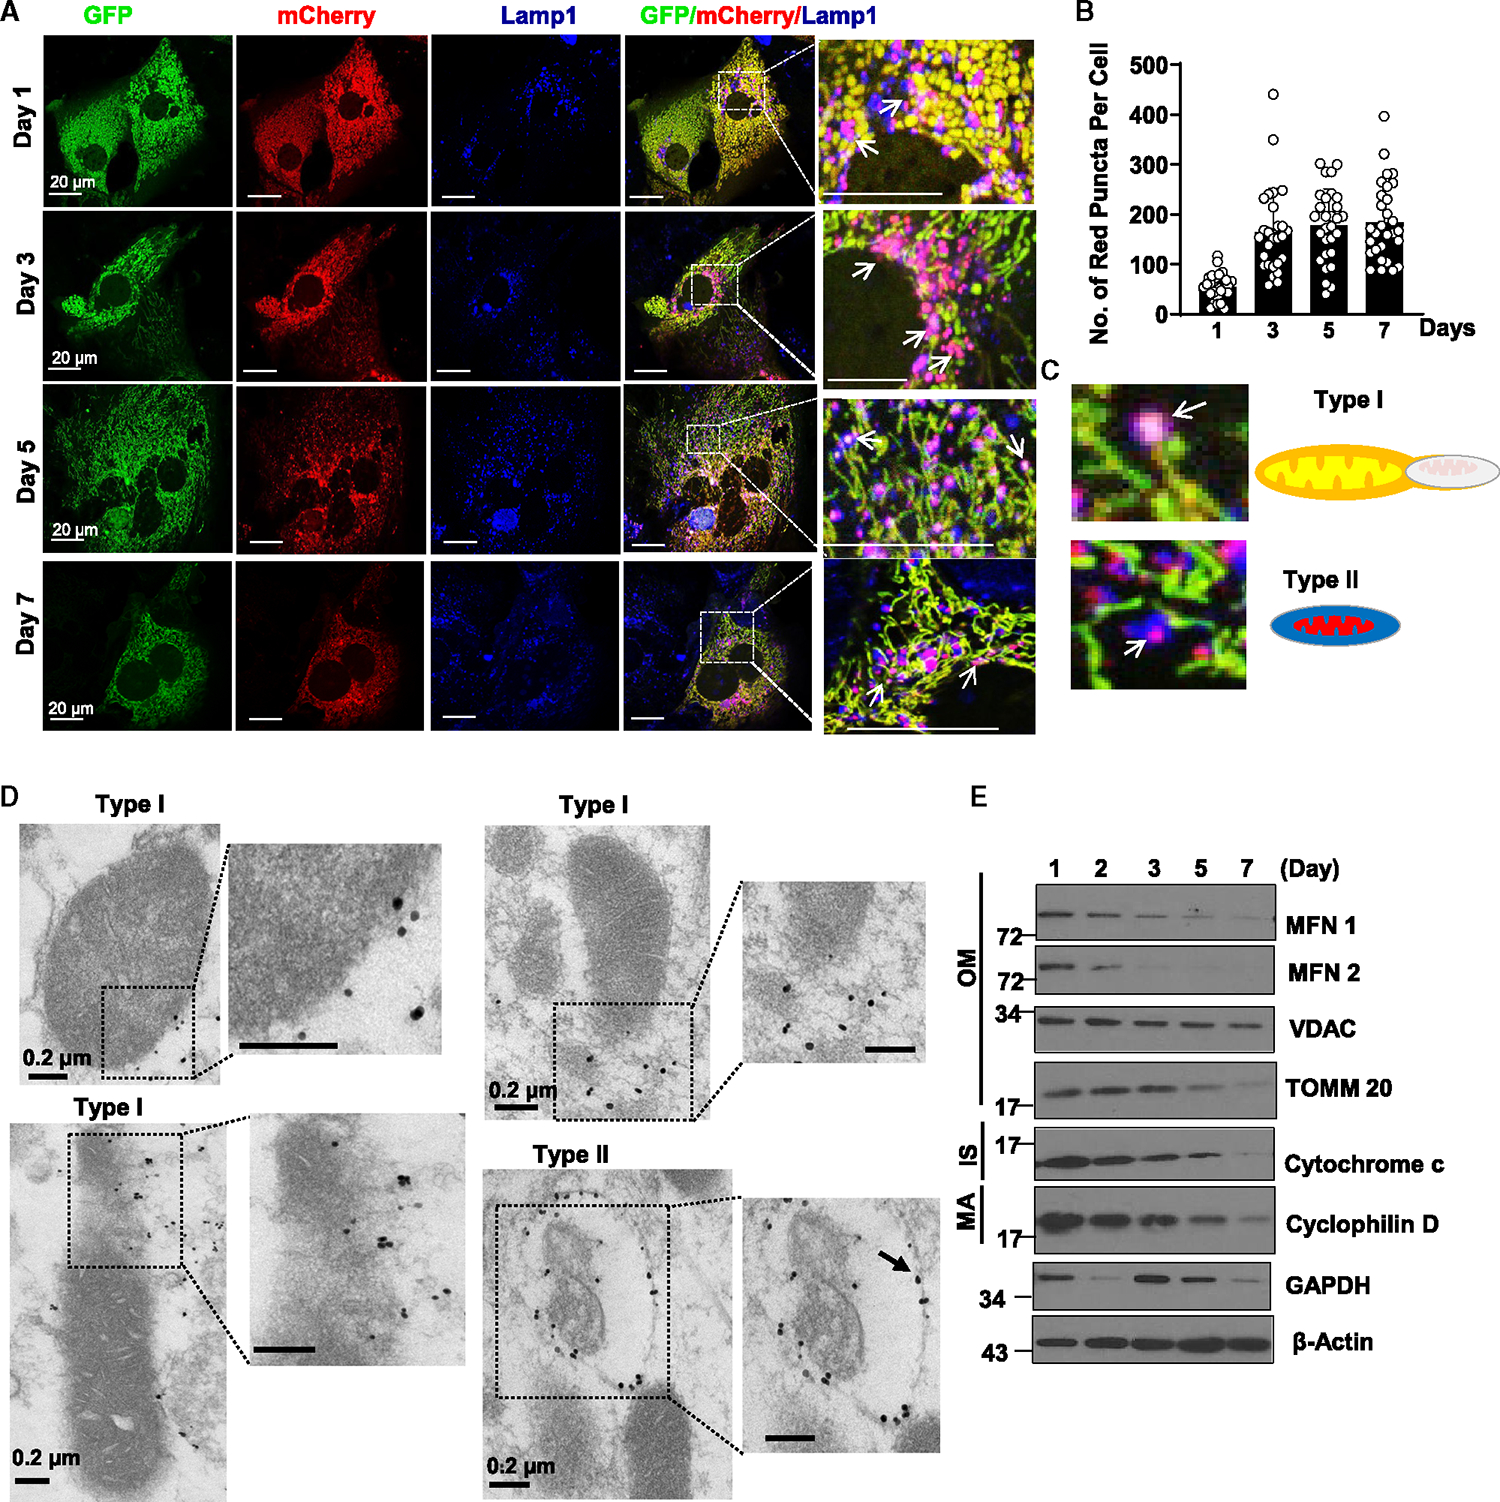
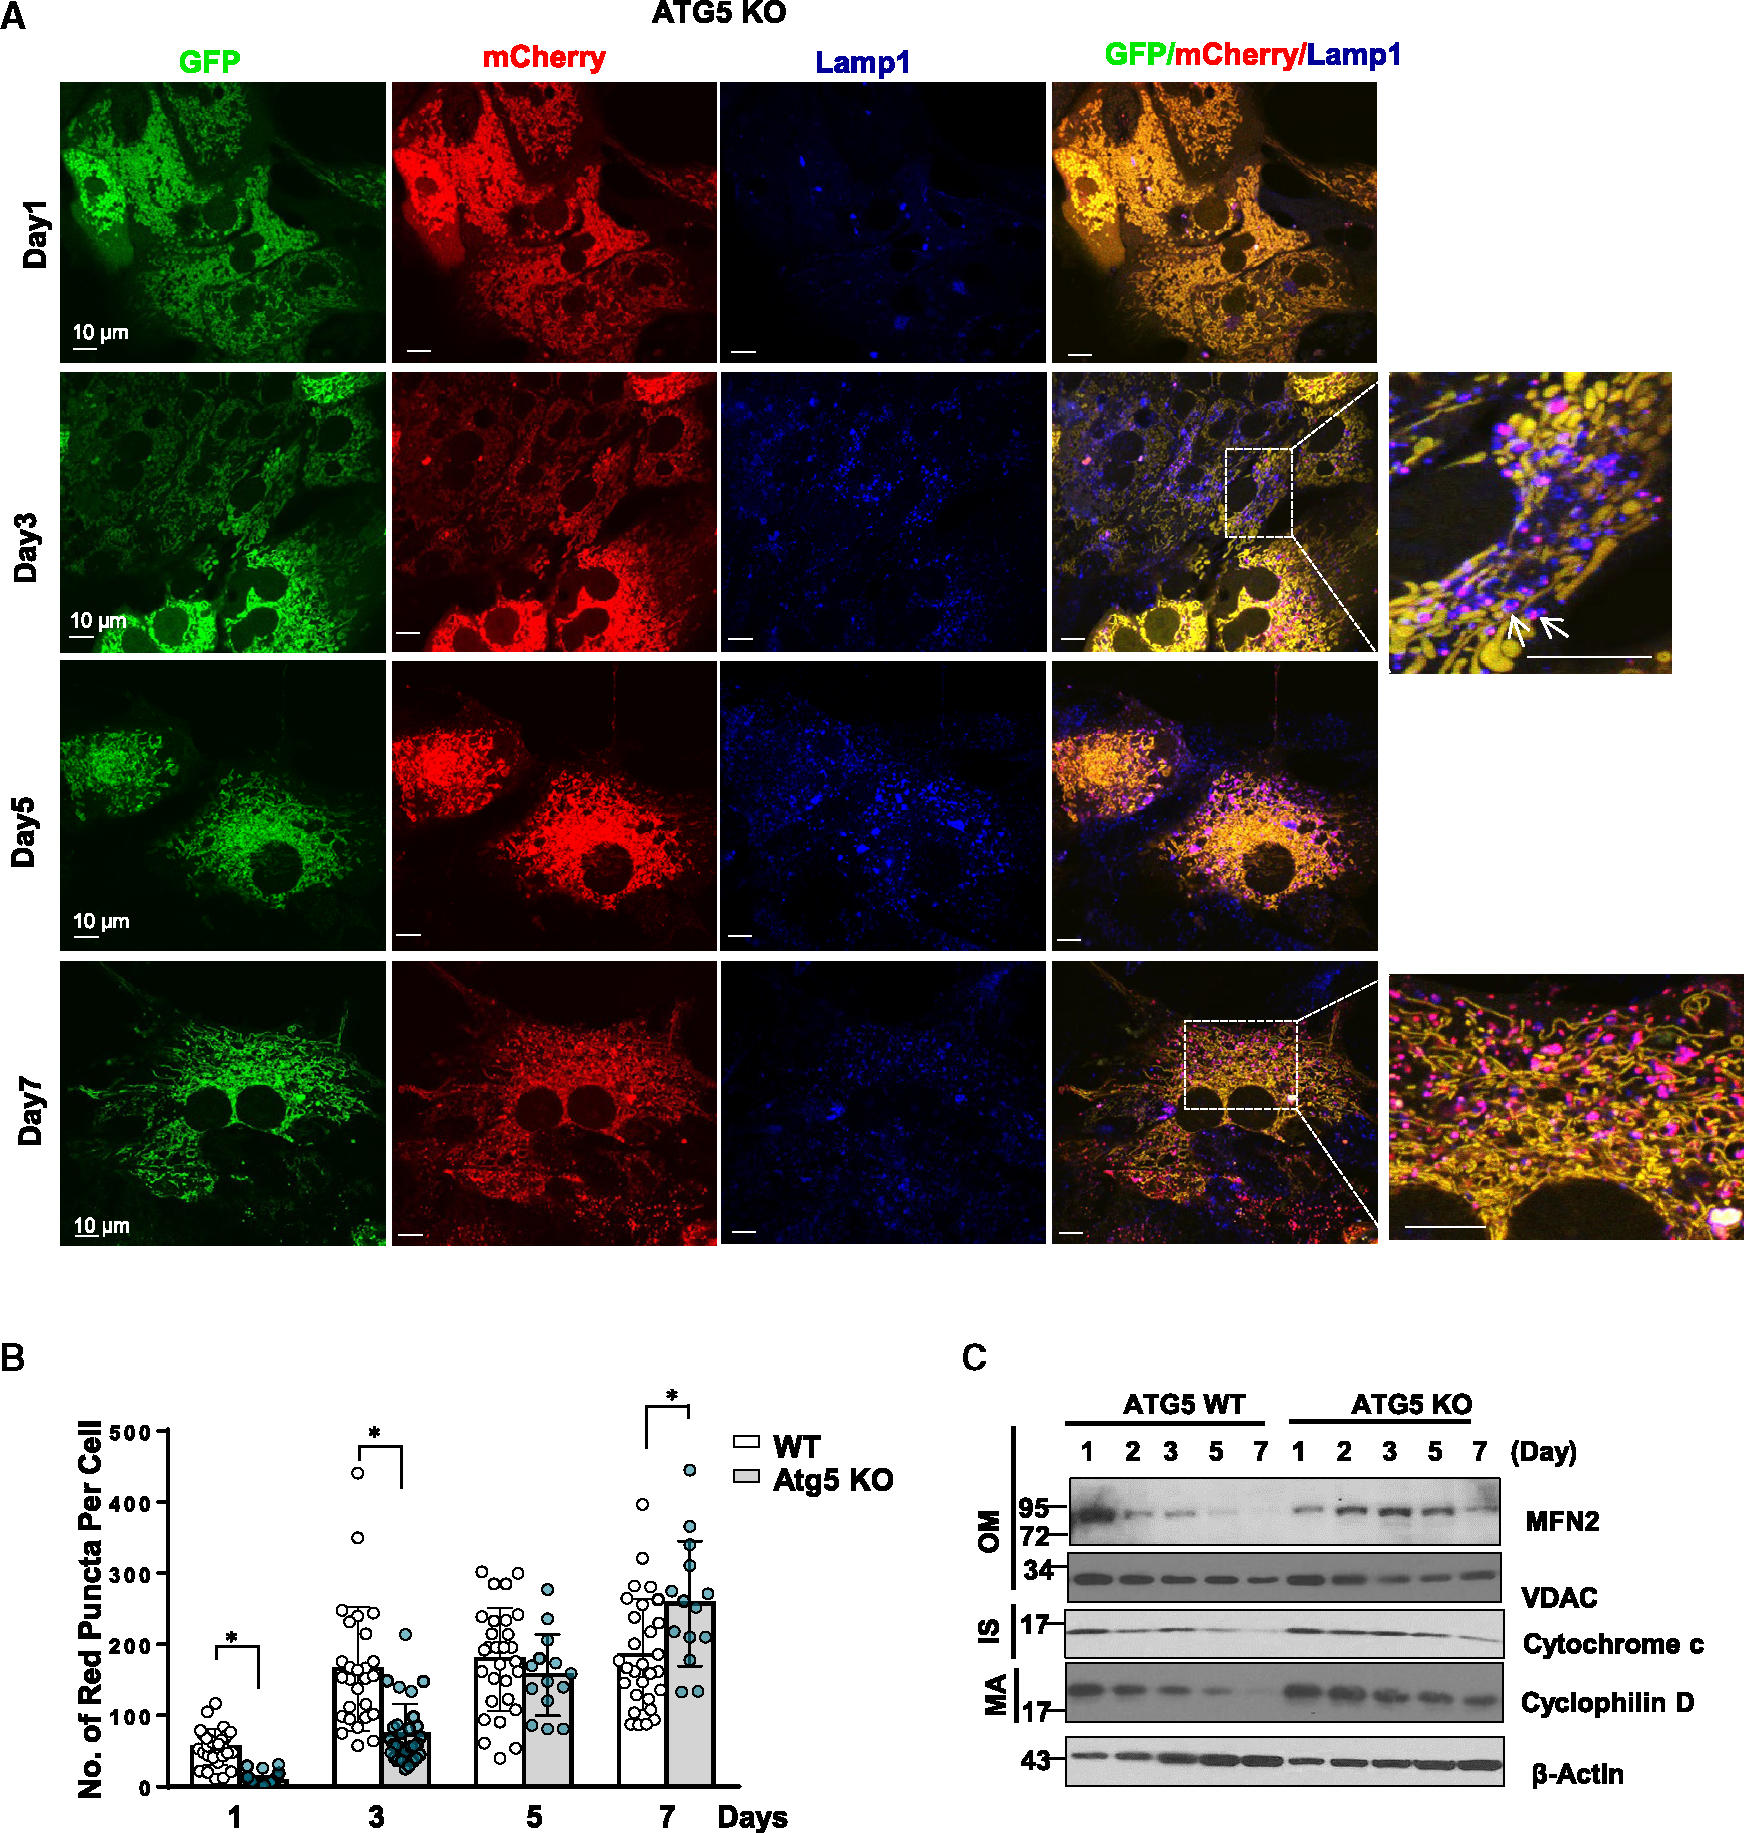
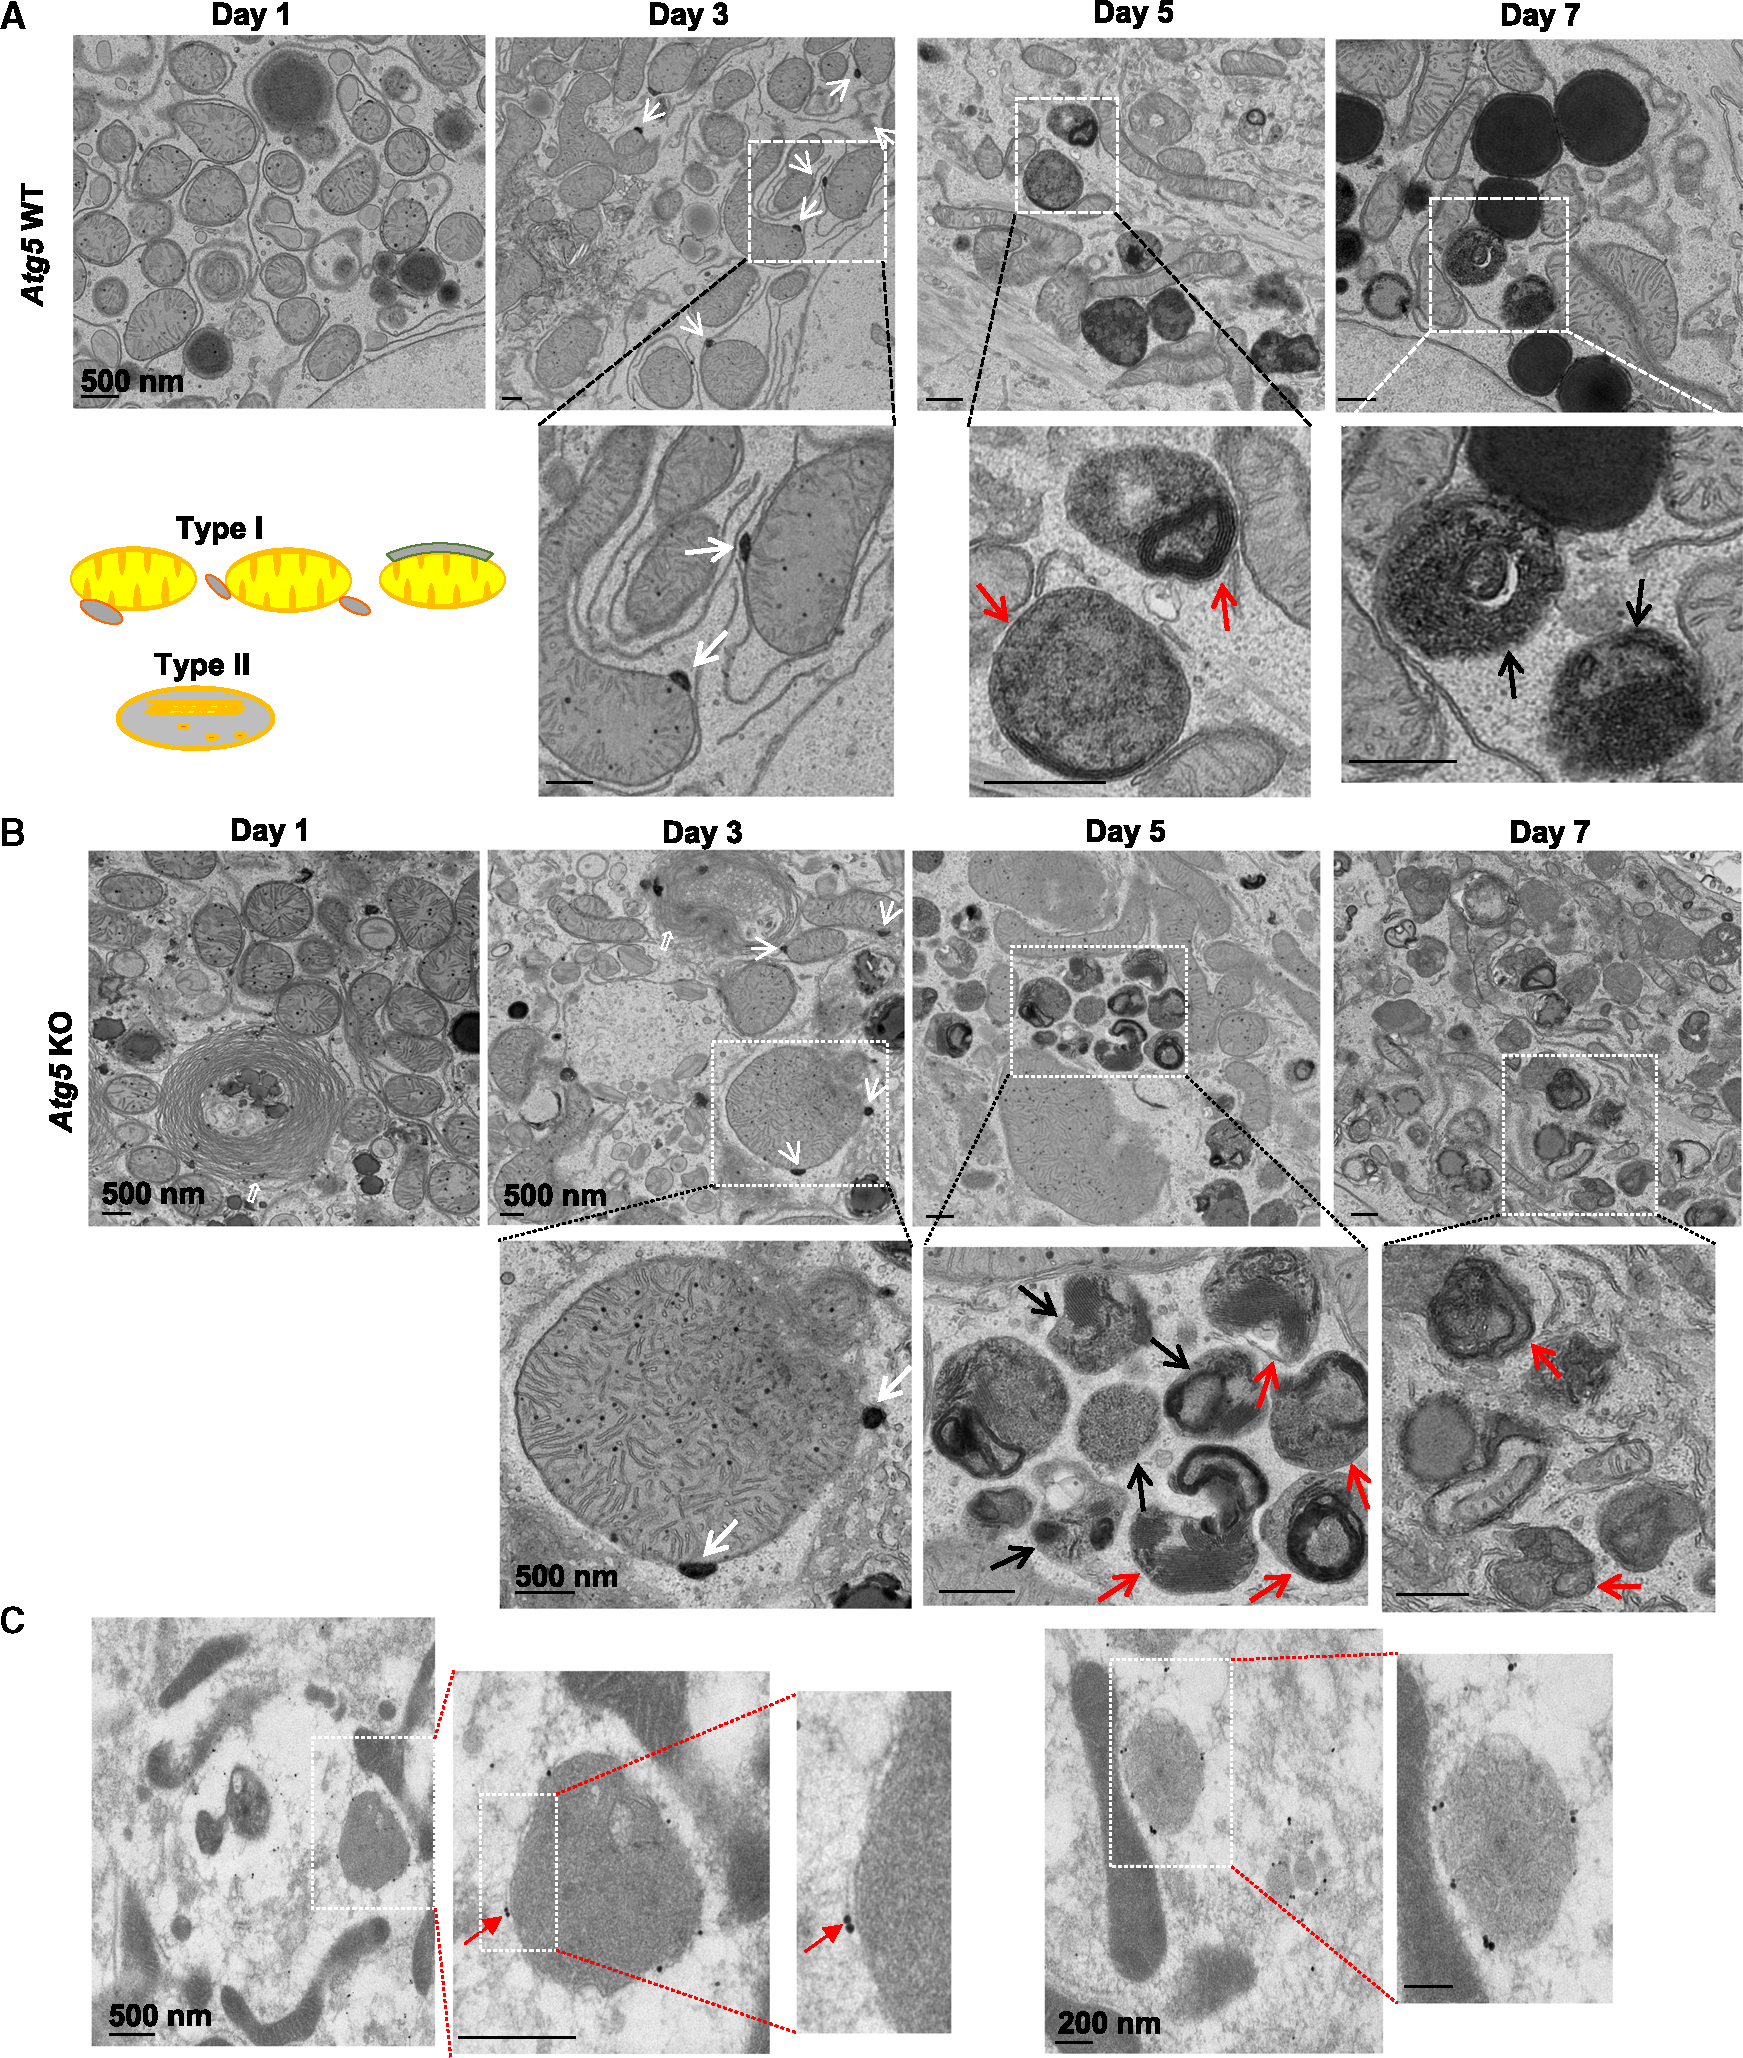
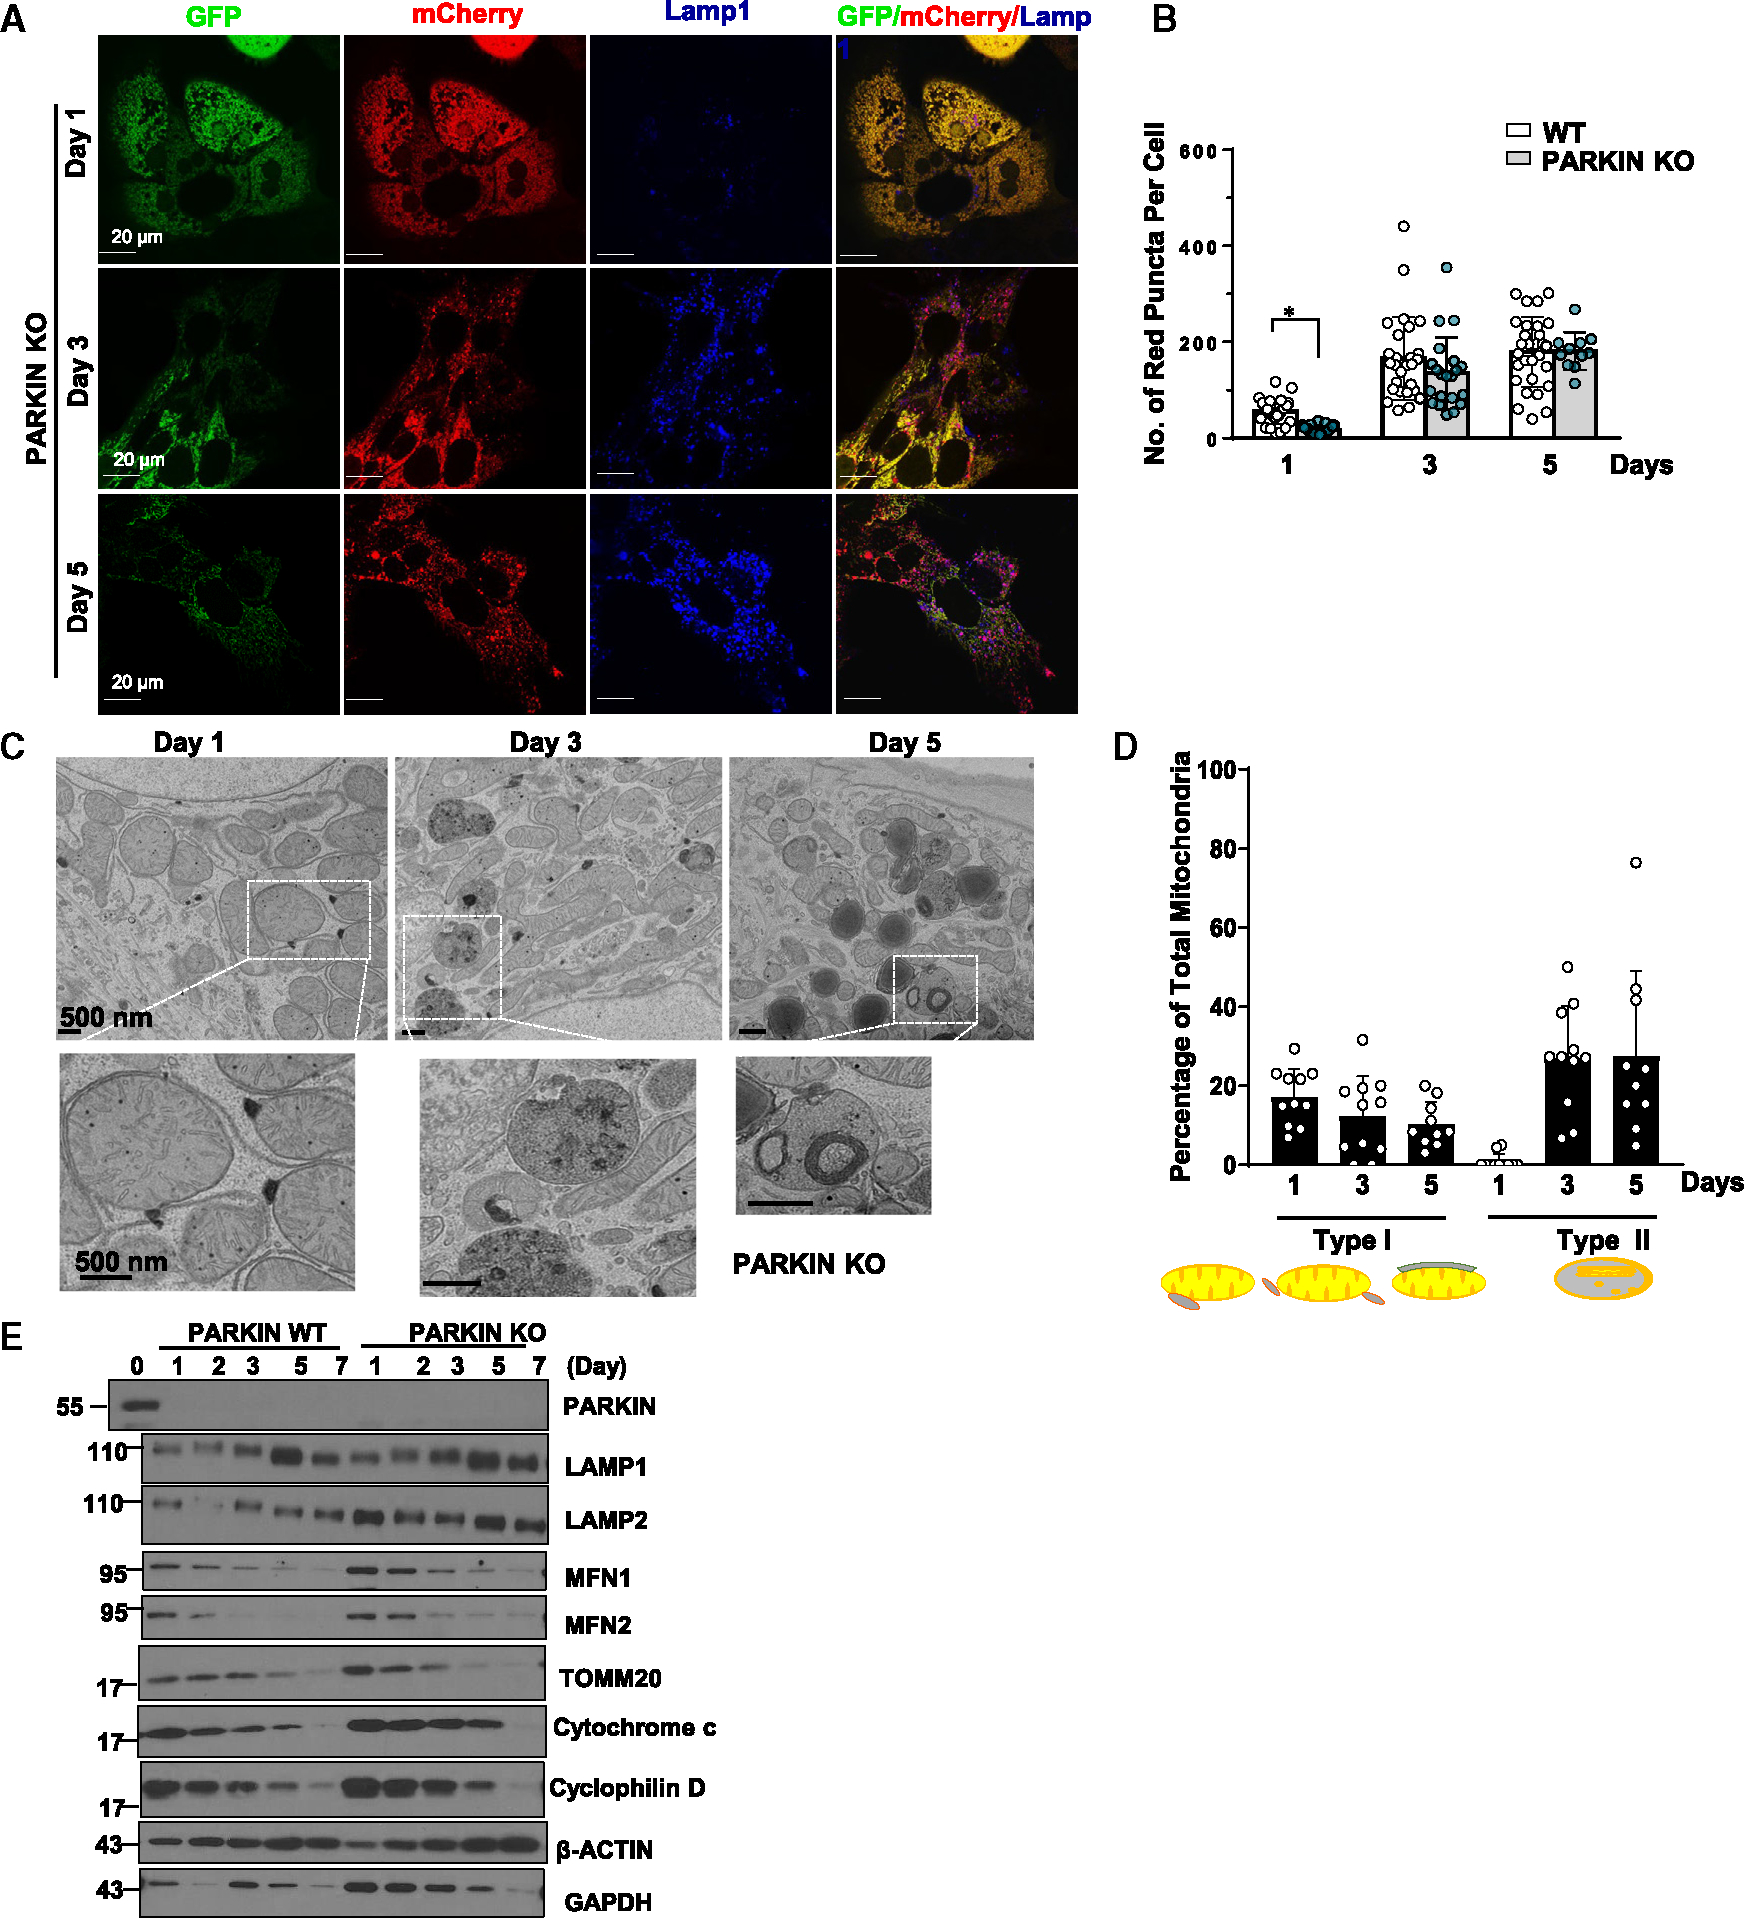
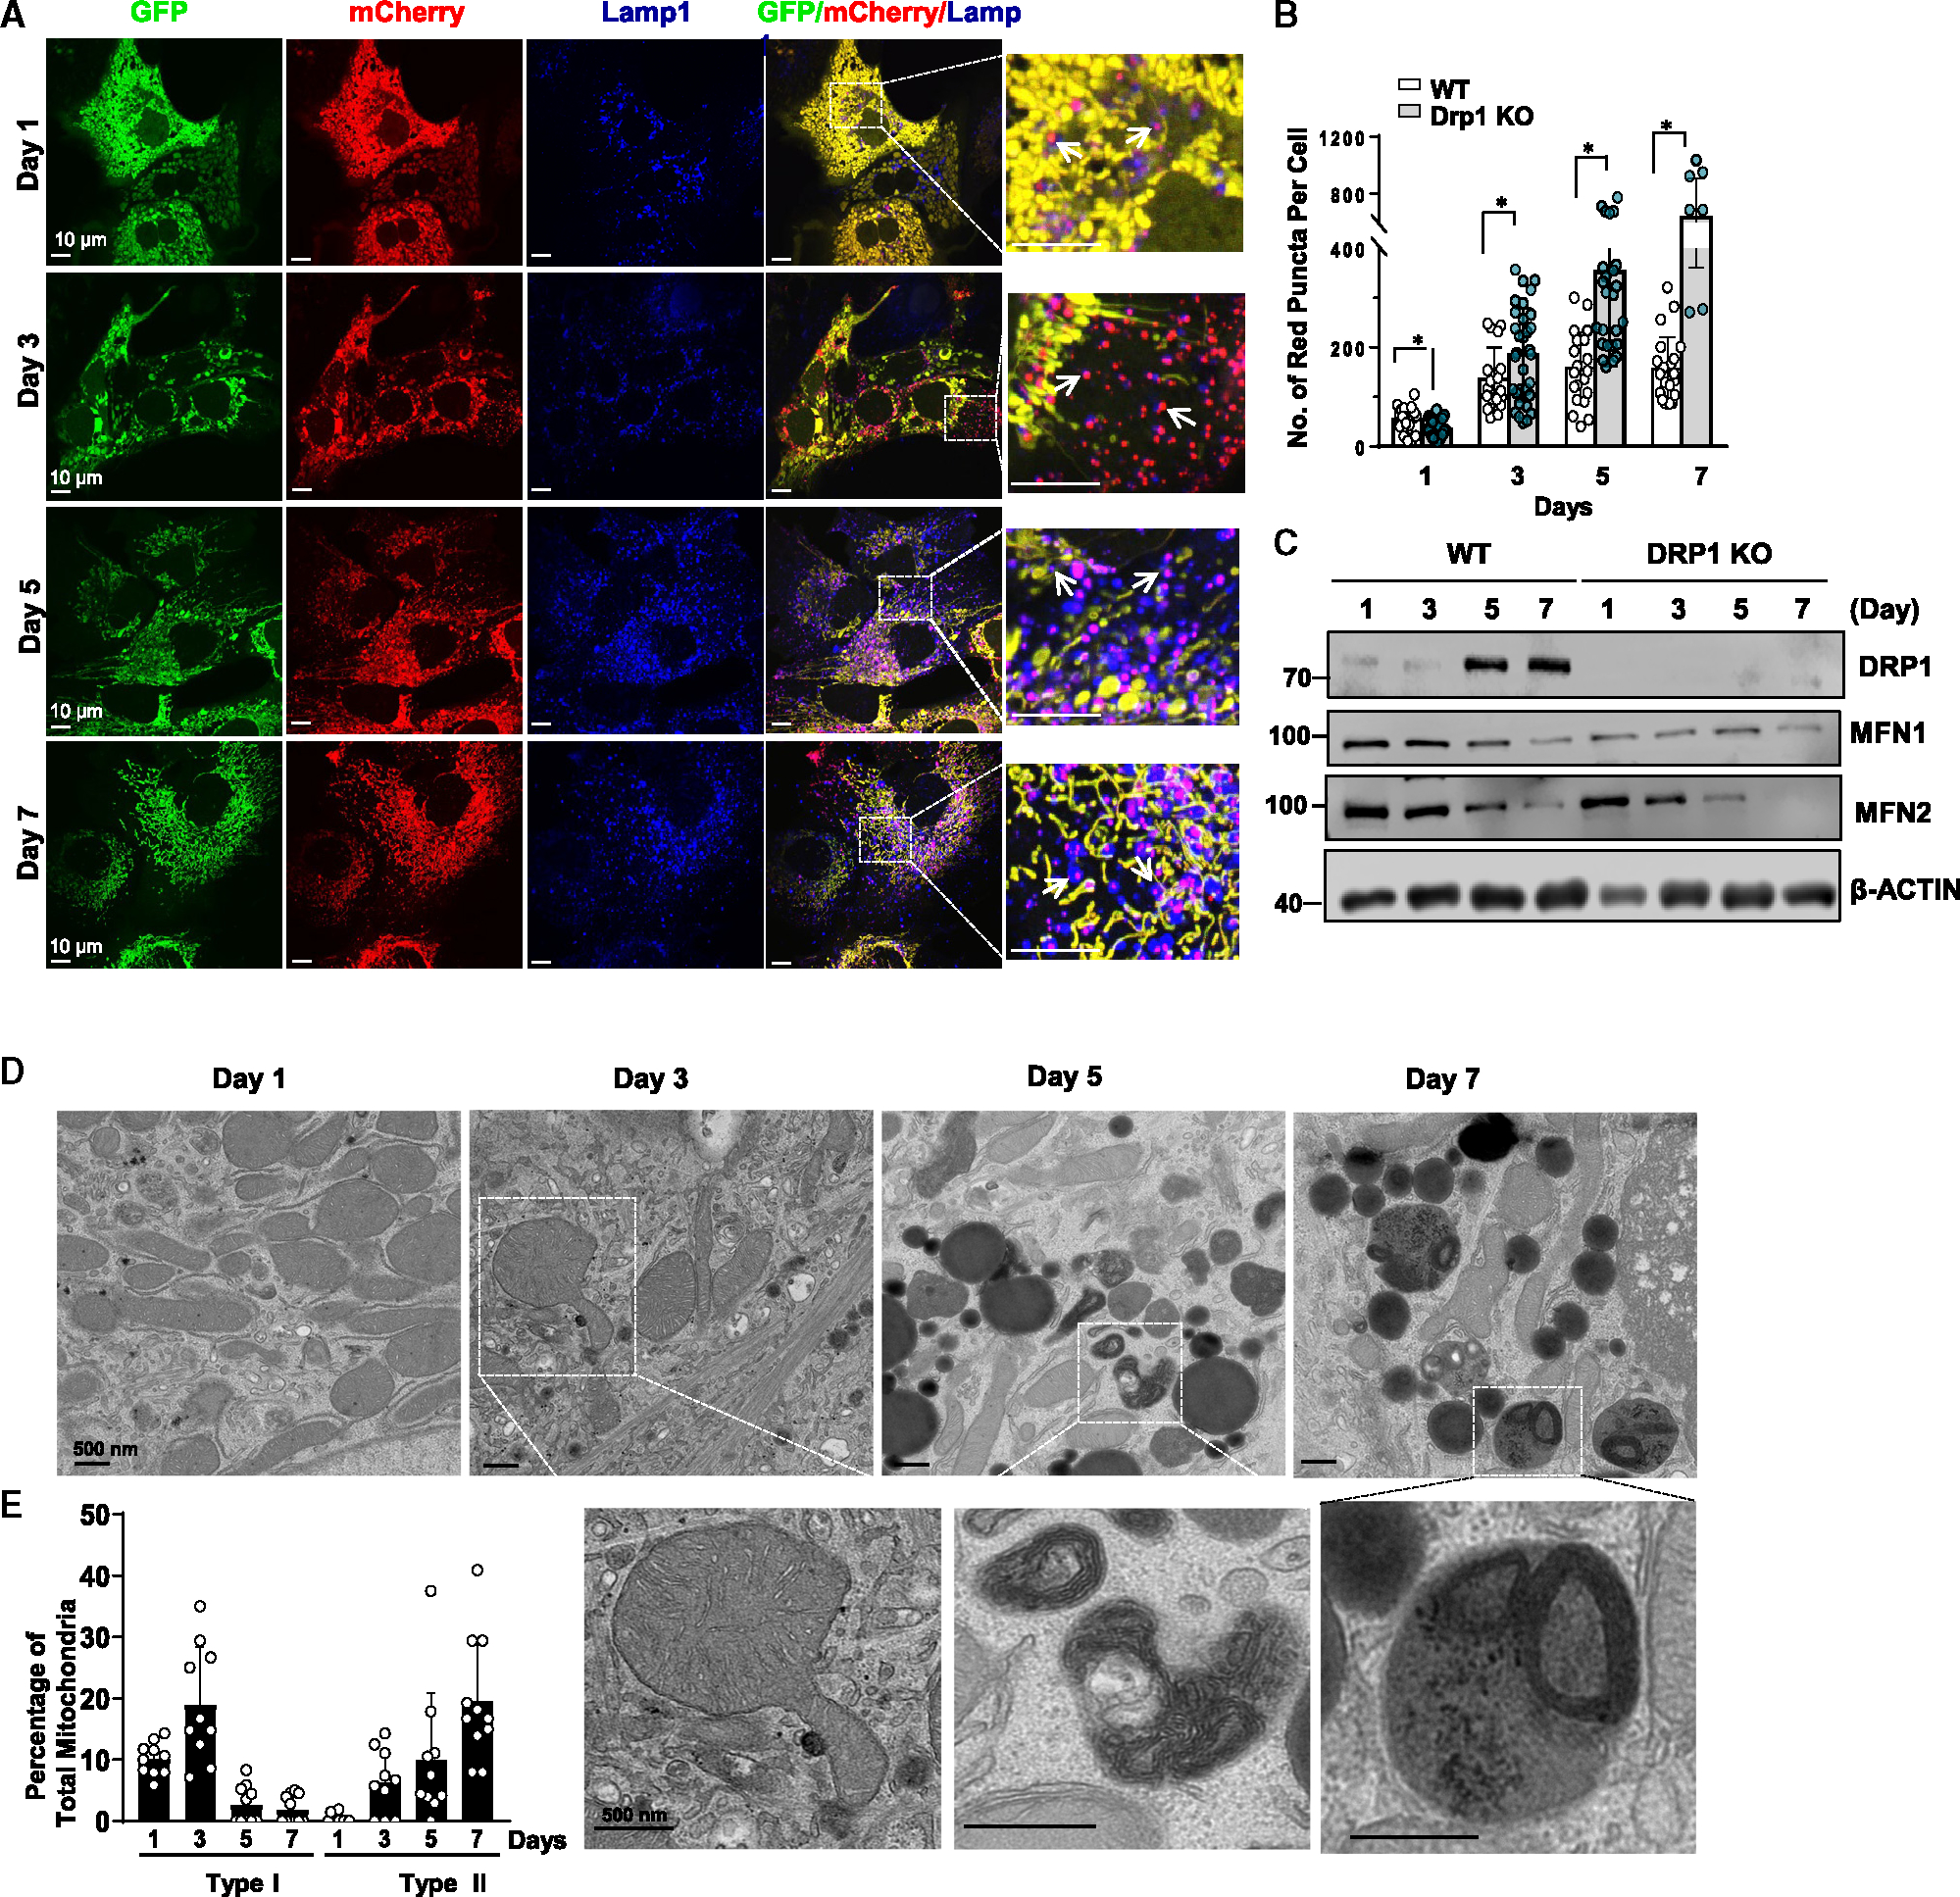
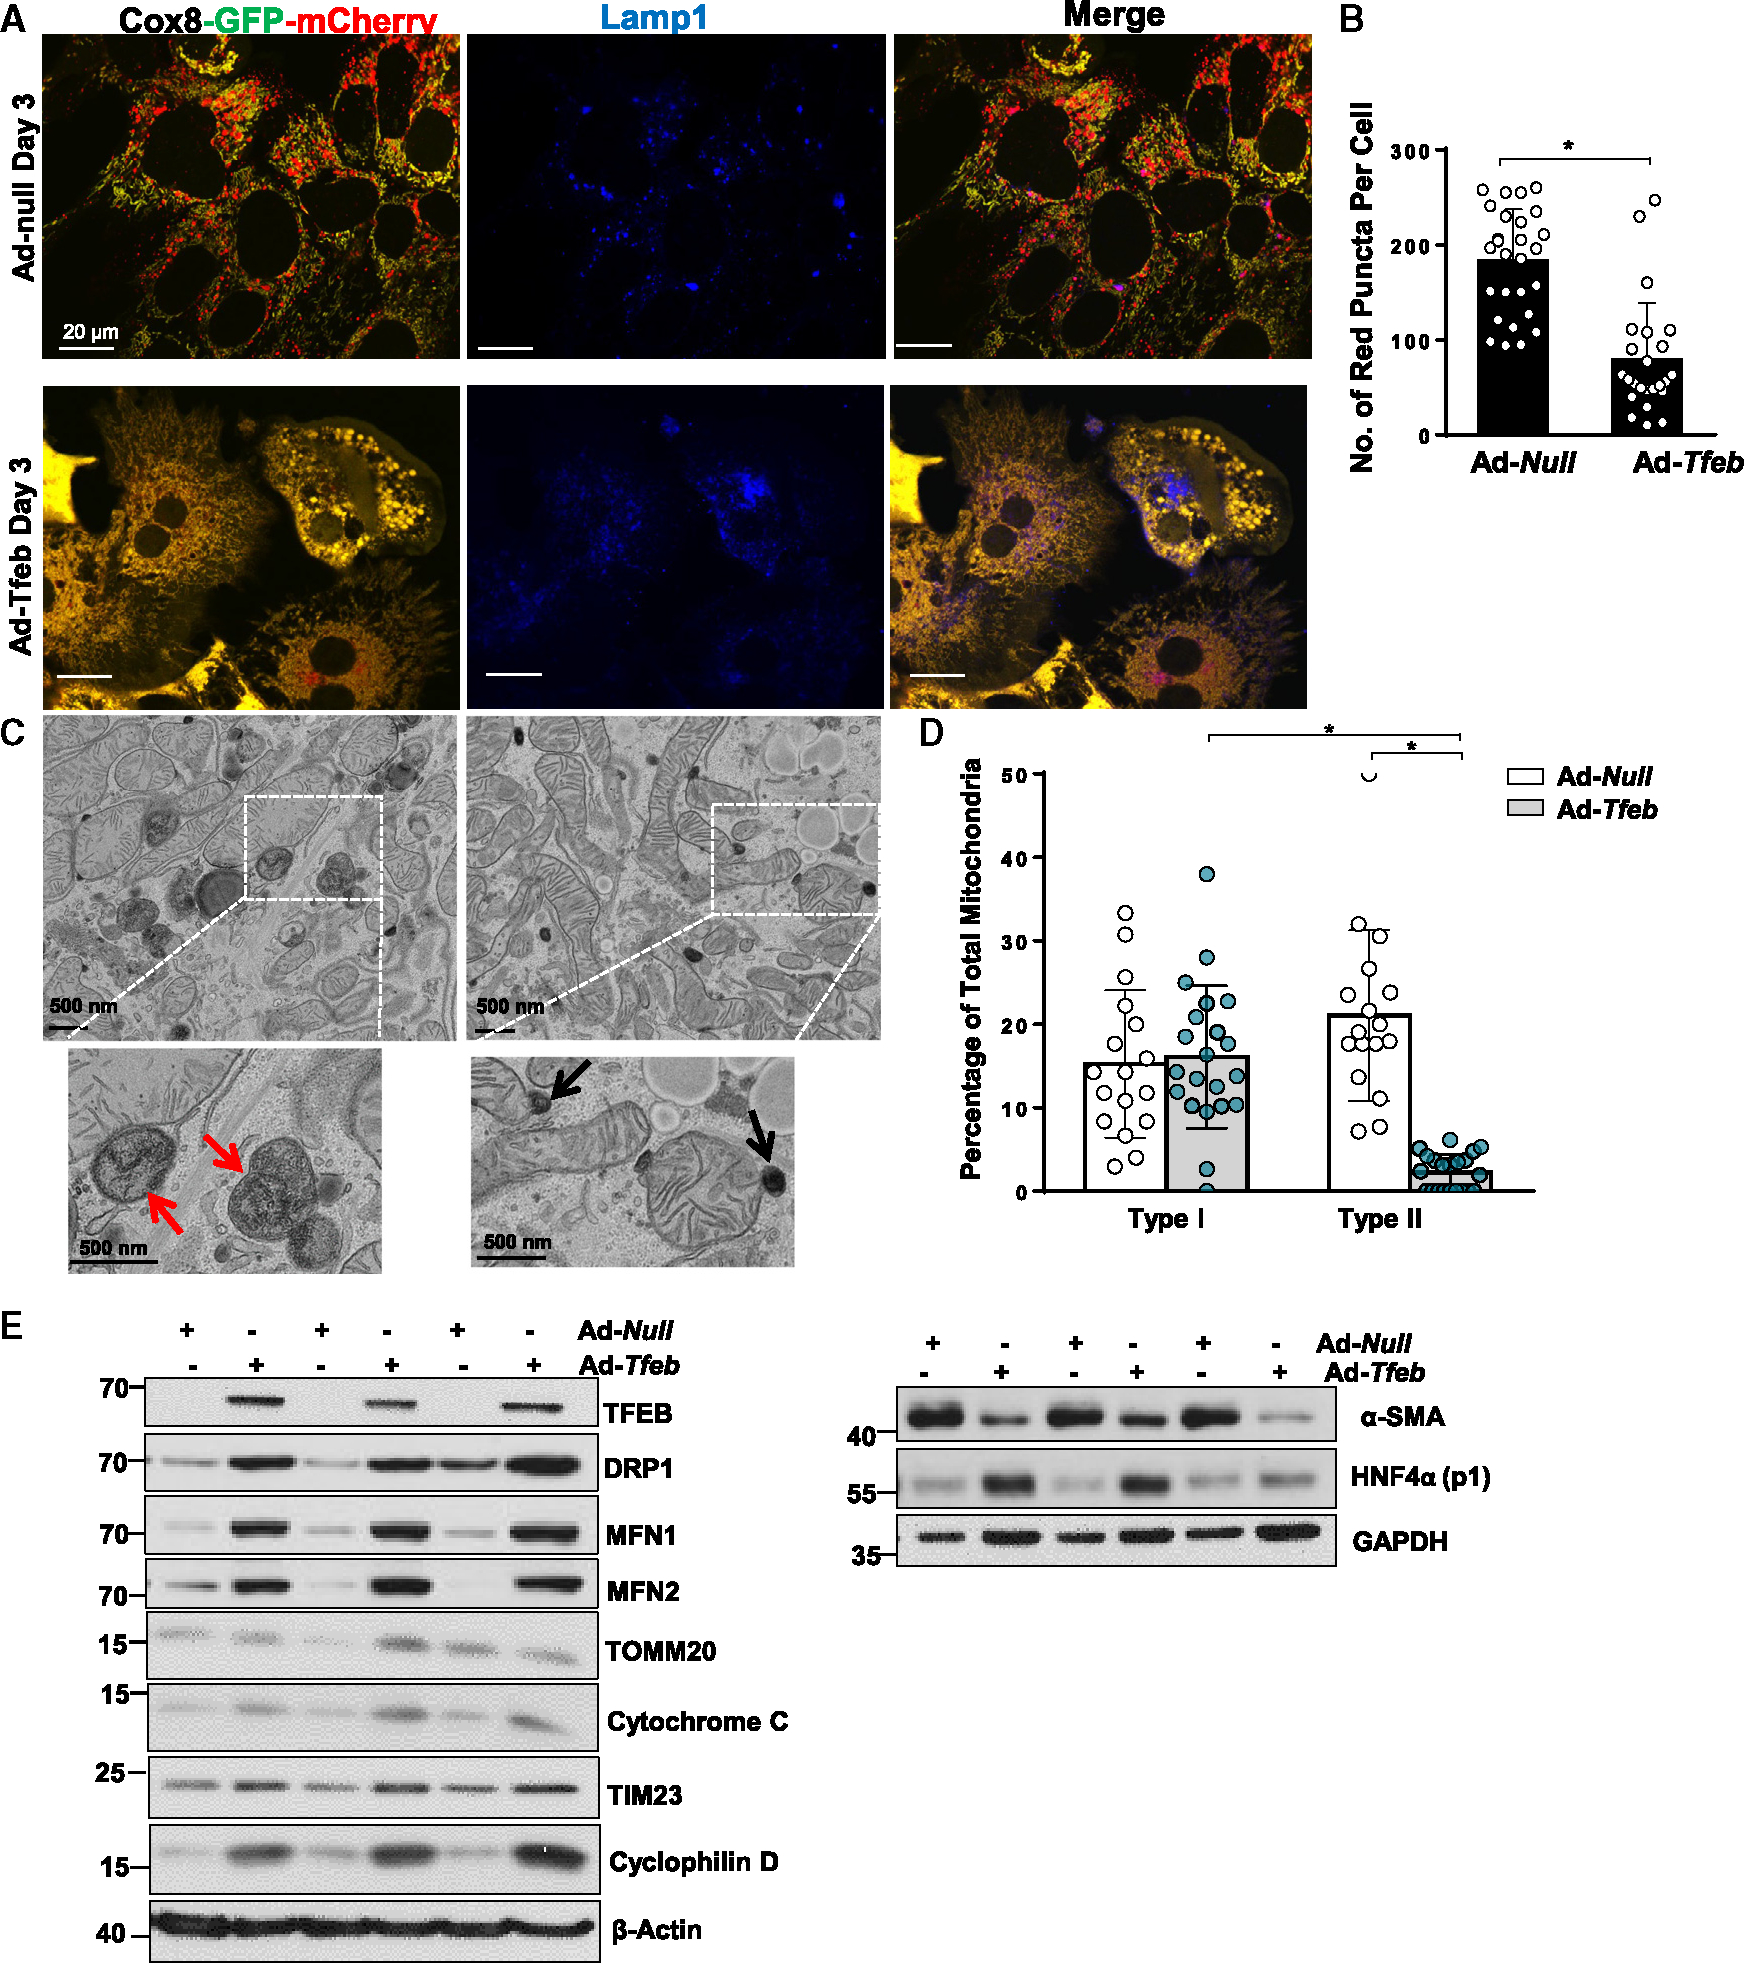
Dysfunctional mitochondria are removed via multiple pathways, such as mitophagy, a selective autophagy process. Here, we identify an intracellular hybrid mitochondria-lysosome organelle (termed the mitochondria-lysosome-related organelle [MLRO]), which regulates mitochondrial homeostasis independent of canonical mitophagy during hepatocyte dedifferentiation. The MLRO is an electron-dense organelle that has either a single or double membrane with both mitochondria and lysosome markers. Mechanistically, the MLRO is likely formed from the fusion of mitochondria-derived vesicles (MDVs) with lysosomes through a PARKIN-, ATG5-, and DRP1-independent process, which is negatively regulated by transcription factor EB (TFEB) and associated with mitochondrial protein degradation and hepatocyte dedifferentiation. The MLRO, which is galectin-3 positive, is reminiscent of damaged lysosome and could be cleared by overexpression of TFEB, resulting in attenuation of hepatocyte dedifferentiation. Together, results from this study suggest that the MLRO may act as an alternative mechanism for mitochondrial quality control independent of canonical autophagy/mitophagy involved in cell dedifferentiation.

Keywords: ATG5; CP: Cell biology; DRP1; autophagy; hepatocytes; lysosome; mitophagy.


Conflict of interest statement

Declaration of interests The authors declare no competing interests.

Figures

Figure 1.
Figure 1.. Fibroblastic transformation of prolonged cultured primary mouse hepatocytes associated with increased elongated mitochondria
(A) Representative bright-field images of primary mouse hepatocytes cultured for indicated times. (B) Total cell lysates from indicated mouse hepatocytes were subjected to western blot analysis. Reversible Ponceau S staining was applied as loading controls. (C) Total mRNA was extracted from cultured mouse hepatocytes followed by real-time qPCR analysis. Data are presented as mean ± SE (n = 3 independent experiments). (D) Immunofluorescence staining of TOMM20 in cultured mouse hepatocytes at indicated time points. Arrows denote elongated mitochondria. (E) Representative images of transmission electron microscopy analysis of hepatocytes ad indicated time points. (F) Total cell lysates from primary mouse hepatocytes cultured for indicated times were subjected to western blot analysis. Reversible Ponceau S staining was applied to indicate equal loadings. (G) Mouse hepatocytes were cultured at indicated time points, and mitochondria FAO was measured as described in STAR Methods. Data are presented as mean ± SE (n = 3 independent experiments).
Figure 2.
Figure 2.. Increased acidic fragmented mitochondrial compartments that are colocalized with a lysosomal marker in prolonged cultured hepatocytes
(A) Primary mouse hepatocytes were infected with adenovirus-COX8-GFP-mCherry (multiplicity of infection [MOI] = 10) from seeding for overnight. Cells grown on coverslips were fixed in 4% paraformaldehyde (PFA) at indicated time points followed by LAMP1 immunofluorescence staining. Representative images from confocal microscopy analysis are shown. Arrows denote the colocalization of red-only mitochondria from COX8-GFP-mCherry assay with the lysosomal marker LAMP1. (B) Quantification data for the number of red-only mitochondria in each cell from COX8-GFP-mCherry assay. Data are presented as mean ± SD. At least 15 fields from 2 or 3 independent mouse hepatocytes isolation were quantified. (C) Schemes for type I and type II LAMP1-associated mitochondrial structures. (D) Representative images of immunogold electron microscopy using an anti-LAMP1 antibody from day 3 cultured mouse hepatocytes. (E) Total cell lysates from primary mouse hepatocytes cultured for indicated times were subjected to western blot analysis. *p < 0.05, two-tailed Student’s t test.
Figure 3.
Figure 3.. The mitochondria-lysosome-related organelle is formed independent of Atg5
(A) Atg5 KO primary mouse hepatocytes were infected with adenovirus-Cox8-GFP-mCherry (MOI = 10) from seeding for overnight. Cells grown on coverslips were fixed in 4% PFA at indicated time points followed by Lamp1 immunofluorescence staining. Images were captured using confocal microscopy. Arrows denote the colocalization of red-only mitochondria in Cox8-GFP-mCherry assay with lysosomal marker LAMP1. (B) Quantification data for the number of red-only mitochondria in each cell from Cox8-GFP-mCherry assay. Data are presented as mean ± SD. At least 15 fields from two independent mouse hepatocytes perfusion were quantified. (C) WT and Atg5 KO mouse hepatocytes were cultured for indicated times. Total cell lysates were subjected to western blot analysis. *p < 0.05, two-tailed Student’s t test.
Figure 4.
Figure 4.. Ultrastructure of the mitochondria-lysosome-related organelle (MLRO) by electron microscopy
(A and B) Representative images of transmission electron microscopic examination of day 1 to day 7 cultured WT (A) and Atg5 KO (B) mouse hepatocytes. White arrows denote the contacts of electron-dense membrane structure with mitochondria. Red arrows denote the double-membrane electron-dense structure that contains heterogeneous undegraded contents. Black arrows denote the end-stage single-membrane MLRO structures. (C) Representative images of immunogold electron microscopy (EM) using an anti-LAMP1 antibody in day 3 cultured mouse hepatocytes. Red arrows denote the LAMP1-positive MLRO structures.
Figure 5.
Figure 5.. PARKIN is dispensable for MLRO formation in prolonged cultured hepatocytes
(A) PARKIN KO primary mouse hepatocytes were infected with adenovirus-Cox8-GFP-mCherry (MOI = 10) from seeding for overnight. Cells grown on coverslips were fixed in 4% PFA at indicated time points followed by LAMP1 immunofluorescence staining. Images were captured using confocal microscopy. (B) Quantification data for the number of red-only mitochondria in each cell from Cox8-GFP-mCherry assay. Data are presented as mean ± SD. At least 15 fields from two independent mouse hepatocytes perfusion were quantified. (C) Day 1 to day 5 cultured PARKIN KO mouse hepatocytes were examined using transmission electron microscopy (TEM). (D) Type I and type II MLRO structure were quantified from (C) and normalized by the total mitochondria number in each field. (E) WT and PARKIN KO primary mouse hepatocytes were cultured for indicated times. Total cell lysates were subjected to western blot analysis. *p < 0.05, two-tailed Student’s t test.
Figure 6.
Figure 6.. DRP1 is not required for the induction of MLRO in prolonged cultured mouse hepatocytes
(A) DRP1 KO primary mouse hepatocytes were infected with adenovirus-COX8-GFP-mCherry (MOI = 10) from seeding for overnight. Cells grown on coverslips were fixed in 4% PFA at indicated time points followed by LAMP1 immunofluorescence staining. Representative images of confocal microscopy are shown. Arrows denote the colocalization of red-only mitochondria in COX8-GFP-mCherry assay with a lysosomal marker LAMP1. (B) Quantification data for the number of red-only mitochondria in each cell from COX8-GFP-mCherry assay. Data are presented as mean ± SD. At least 15 fields from two independent mouse hepatocyte isolations were quantified. (C) Total cell lysates were extracted from primary hepatocytes isolated from WT and liver-specific DRP1 KO mice that were cultured for indicated time points followed by western blot analysis. (D) Representative TEM images from day 1 to day 7 cultured DRP1 KO mouse hepatocytes are shown. (E) Type I and type II MLRO structures were quantified from (D) and normalized by the total mitochondria number in each field. *p < 0.05, two-tailed Student’s t test.
Figure 7.
Figure 7.. Overexpression of TFEB inhibits the formation of MLRO in prolonged cultured mouse hepatocytes
(A) Primary mouse hepatocytes were infected with adenovirus (Ad)-COX8-GFP-mCherry (MOI = 10) and adenovirus-TFEB (MOI = 1) or adenovirus-null from seeding for overnight. Cells grown on coverslips were fixed in 4% PFA on Day3 followed by LAMP1 immunofluorescence staining. Representative images of confocal microscopy are shown. (B) Quantification data for the number of red-only mitochondria in each cell from COX8-GFP-mCherry assay. Data are presented as mean ± SD. At least 15 fields of cells from three independent hepatocytes perfusion were quantified. (C) Represented EM image of day 3 cultured mouse hepatocytes with TFEB overexpression are shown. (D) Type I and type II MLRO structure were quantified from Ad-null- and Ad-TFEB-infected mouse hepatocytes at day 3 and normalized by the total mitochondria number in each field. (E) Total cell lysate from day 3 cultured mouse hepatocytes with or without TFEB overexpression were subjected to western blot analysis. *p < 0.05, one-way ANOVA with Bonferroni’s post hot test for (D), two-tailed Student’s t test for (B).

References

    1. Sorrentino V, Menzies KJ, and Auwerx J (2018). Repairing Mitochondrial Dysfunction in Disease. Annu. Rev. Pharmacol. Toxicol. 58, 353–389. 10.1146/annurev-pharmtox-010716-104908. - DOI - PubMed
    1. Lin MT, and Beal MF (2006). Mitochondrial dysfunction and oxidative stress in neurodegenerative diseases. Nature 443, 787–795. 10.1038/nature05292. - DOI - PubMed
    1. Ma X, McKeen T, Zhang J, and Ding WX (2020). Role and Mechanisms of Mitophagy in Liver Diseases. Cells 9. 10.3390/cells9040837. - DOI - PMC - PubMed
    1. Chan DC (2020). Mitochondrial Dynamics and Its Involvement in Disease. Annu. Rev. Pathol. 15, 235–259. 10.1146/annurev-pathmechdis-012419-032711. - DOI - PubMed
    1. Giacomello M, Pyakurel A, Glytsou C, and Scorrano L (2020). The cell biology of mitochondrial membrane dynamics. Nat. Rev. Mol. Cell Biol. 21, 204–224. 10.1038/s41580-020-0210-7. - DOI - PubMed

Publication types

LinkOut - more resources