. 2023 Oct 31;42(10):113298.
doi: 10.1016/j.celrep.2023.113298. Epub 2023 Oct 19.

An essential role for miR-15/16 in Treg suppression and restriction of proliferation

Affiliations

An essential role for miR-15/16 in Treg suppression and restriction of proliferation

Kristina Johansson et al. Cell Rep. .

Abstract

The miR-15/16 family targets a large network of genes in T cells to restrict their cell cycle, memory formation, and survival. Upon T cell activation, miR-15/16 are downregulated, allowing rapid expansion of differentiated effector T cells to mediate a sustained response. Here, we used conditional deletion of miR-15/16 in regulatory T cells (Tregs) to identify immune functions of the miR-15/16 family in T cells. miR-15/16 are indispensable to maintain peripheral tolerance by securing efficient suppression by a limited number of Tregs. miR-15/16 deficiency alters expression of critical Treg proteins and results in accumulation of functionally impaired FOXP3loCD25loCD127hi Tregs. Excessive proliferation in the absence of miR-15/16 shifts Treg fate and produces an effector Treg phenotype. These Tregs fail to control immune activation, leading to spontaneous multi-organ inflammation and increased allergic inflammation in a mouse model of asthma. Together, our results demonstrate that miR-15/16 expression in Tregs is essential to maintain immune tolerance.

Keywords: CP: Immunology; T cell; T regulatory cell; TCF1; Treg; allergy; effector Treg; immunosuppression; miR-15; miR-16; miRNA.


Conflict of interest statement

Declaration of interests The authors declare no competing interests.

Figures

Figure 1.
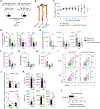
Figure 1.. Treg-specific miR-15/16 expression is essential to prevent spontaneous and induced tissue inflammation
(A) H&E-stained sections of lung, liver, skin, and pancreas; control mice with miR-15/16-sufficient Tregs (miR-15/16wt/wtFoxp3Cre or miR-15/16fl/flFoxp3Wt; “WT”) on the top row and mice with miR-15/16-deficient Tregs (miR-15/16fl/flFoxp3Cre, “KO”) on the bottom row. Representative image of spleen (Spl) and inguinal lymph nodes (LN) (B), spleen weight quantified (C), and total cells quantified in spleen and lymph nodes (D) from the same mice. Total spleen B cells (CD45+CD4CD8NK1.1CD19+), CD4+ T cells (CD45+CD11bCD11cCD8CD4+), CD8+ T cells (CD45+CD11bCD11cCD4CD8+), NK cells (CD45+CD4CD8CD19NK1.1+), monocytes (Mono) (CD45+CD11bint-hiCD11cint-loNK1.1Ly6G), eosinophils (Eos) (CD45+CD11b+Siglec-F+), and neutrophils (Neu) (CD45+CD11b+Ly6G+) in spleen (E). Percentage of CD4+ conventional T cells, CD8+ T cells, and Treg in spleen (F), and total Tregs in spleen and lymph nodes (G) of WT and KO mice. Representative contour plots with frequencies (H) and quantification of total (I) CD44hiCD62Llo T effector cells in spleen and lymph nodes of WT and KO mice. Intracellular cytokine staining of CD4+ T cells from WT and KO mice restimulated ex vivo; contour plots show IFN-γ and IL-10 expression (J) and quantification of IL-2+, IFN-γ+, IL-10+,IL-13+,and IL-17A+ cells (K). (L) Airway inflammation model induced by intraperitoneal (i.p.) OVA sensitization and intranasal (i.n.) OVA challenge. Bronchoalveolar lavage (BAL) and lung tissue were collected 24 h after the last OVA challenge. Frequency of eosinophils (CD11b+Siglec-F+), neutrophils (CD11b+Ly6G+), alveolar macrophage (Mac) (CD11c+CD11blo), CD4+ T cells (CD4, CD11bCD11cCD4+), and CD8+ T cells (CD8, CD11bCD11cCD8+) among live hematopoietic cells in BAL (M), and frequency of tissue-resident Tregs in BAL and lung tissue of OVA-challenged WT and KO mice (N). Twenty-week-old unchallenged mice in (A–K). Data from 7 independent experiments. N = 6–14 mice/group. In (C–G) and (I) unpaired t test two-tailed and two-way ANOVA with Bonferroni’s multiple comparison test in (K, M, and N). Bar graphs are shown with error bars demonstrating standard deviation. *p < 0.05, **p < 0.01, ***p < 0.001, and ****p < 0.0001 for significance.
Figure 2.
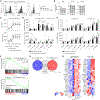
Figure 2.. miR-15/16 specifically restrict the expansion of Tregs and regulate expression of key Treg proteins
Representative contour plots (A) and quantification of frequencies (B) of CD4+FOXP3+ Tregs and CD4+FOXP3 conventional T cells (Tcon) among live hematopoietic cells in thymus (Thy), spleen (Spl), and lymph nodes (LN) of miR-15/16fl/fl WT control and miR-15/16fl/flCd4-Cre mice. (C) Model to track in vivo cell proliferation accomplished by retroorbital (r.o.) injection of 5-ethynyl-2′-deoxyuridine (EdU). Tissues were collected 24 h after the last injection. (D) Representative contour plots of EdU-injected miR-15/16fl/fl WT control, miR-15/16fl/flCd4-Cre mice, and PBS control mice all carrying a FOXP3-GFP reporter. (E) Quantification of frequencies of CD4+GFP+ Tregs and CD4+GFP Tcons of all CD4+ cells in the indicated tissues of the same mice. (F) Contour plot demonstrating gating strategy of thymically derived tTregs (Helios+NRP-1+) and peripherally induced pTregs (HeliosNRP-1). (G) Quantification of frequencies of tTregs and pTregs in the indicated tissues among live hematopoietic cells of miR-15/16fl/fl WT control and miR-15/16fl/flCd4-Cre mice. (H) Fold change of median fluorescent intensity (MFI) by flow cytometry of the indicated proteins in Tregs and Tcons from three tissues (change in miR-15/16fl/flCd4-Cre from miR-15/16fl/fl WT control). (I) Relative MFI (rMFI) of CD127 expression in Tregs from miR-15/16fl/fl WT control, single cluster-deficient miR-15a/16–1fl/flCd4-Cre mice, miR-15b/16–2fl/flCd4-Cre mice, and double cluster-deficient miR-15/16fl/flCd4-Cre mice. Representative contour plots (J) and quantification of frequencies (K) of CD25hi Tregs and CD25lo Tregs among live hematopoietic cells in the indicated tissues of miR-15/16fl/fl WT control and miR-15/16fl/flCd4-Cre mice. Data from a minimum of 2 independent experiments. N = 5–10 mice/group. In all bar graphs except (I), two-way ANOVA with Sidiak’s multiple comparison test. In (I) ordinary ANOVA with Dunnett’s multiple comparison test. Bar graphs are shown with error bars demonstrating standard deviation. Two-way ANOVA with Bonferroni’s multiple comparison test in heatmaps in (H). *p < 0.05, **p < 0.01, and ****p < 0.0001 for significance.
Figure 3.
Figure 3.. Accumulation of CD25lo Tregs provides sufficient protection from intestinal inflammation
(A) Colitis model by T cell transfer accomplished by intravenous injection of FACS-sorted naive T cells and Tregs. Recipient mice were monitored for 8 weeks before analysis. (B) Representative image of colons collected from mice that received naive T cells (“Naive only”), naive T cells together with miR-15/16-sufficient Tregs (“miR-15/16fl/fl”), and naive T cells together with miR-15/16-deficient Tregs (“miR-15/16fl/flCd4-Cre”). (C) Body weight monitored weekly of the same mice. Quantification of frequencies of CD44hiCD62Llo T effector cells among live hematopoietic cells (D), and total CD44hiCD62Llo T effector cells (E) in colon (Col), mesenteric lymph nodes (MLN), and spleen (Spl) of Naive only, miR-15/16fl/fl, and miR-15/16fl/flCd4-Cre-recipient mice. Quantification of frequencies of Tbet+CD4+ T cells among live hematopoietic cells (F) and total Tbet+CD4+ T cells (G) in MLN, and total IFN-γ+CD4+ T cells (H) in mesenteric lymph nodes of Naive only, miR-15/16fl/fl, and miR-15/16fl/flCd4-Cre-recipient mice. Representative contour plots (I) and quantification of frequencies (J) of CD25hi and CD25lo Tregs among all CD4+ T cells in mesenteric lymph nodes and spleen of miR-15/16fl/fl and miR-15/16fl/flCd4-Cre-recipient mice. (K) Expression by median fluorescent intensity (MFI) using flow cytometry of the indicated proteins in spleen Tregs of miR-15/16fl/fl and miR-15/16fl/flCd4-Cre-recipient mice. (L) Ratio of total number of FOXP3+ Tregs over total number of CD44hiCD62Llo T effector cells (Teff) in mesenteric lymph nodes and spleen of miR-15/16fl/fl and miR-15/16fl/flCd4-Cre Treg recipients. Data from 2 independent experiments. N = 5–6 mice/group. Ordinary ANOVA with Dunnett’s multiple comparison test in (D–H). Two-way ANOVA with Bonferroni’s multiple comparison test in (C and J), and unpaired t test two-tailed in (K and L). Graphs are shown with error bars demonstrating standard deviation. *p < 0.05, **p < 0.01, ***p < 0.001, and ****p < 0.0001 for significance.
Figure 4.
Figure 4.. Accumulation of FOXP3loCD25loCD127hi Tregs happens in a cell-intrinsic manner
(A) Co-cultures of naive CD4+ T cells from CD45 congenic mice (miR-15/16fl/fl and miR-15/16fl/flCd4-Cre). (B) Total number of induced Tregs (iTregs) after 5 days in culture under Treg polarizing conditions assessed by FOXP3 expression by flow cytometry. (C) Protein expression by median fluorescent intensity (MFI); paired analysis of co-cultured iTregs. (D–F) (D) Generation of mice with chimeric bone marrow. Recipient mice were analyzed after 9 weeks. Fold difference of cell abundance (E) and MFI by flow cytometry of the indicated proteins in Tregs (F) from three tissues (change in miR-15/16fl/flCd4-Cre from miR-15/16fl/fl WT control). (G) Frequency of Tregs among all CD4+ T cells in natural chimeric female miR-15/16fl/flFoxp3Cre/Wt mice. (H) Representative contour plots of gating strategy to separate FOXP3+ cells based on YFP reporter signal (indicating Cre expression). YFP and YFP+ Treg frequency among all CD4+ T cells (I) and fold difference of flow cytometry MFI of the indicated proteins expressed in Tregs (change in YFP+ Tregs from YFP Tregs) (J). Data from a minimum of 2 independent experiments. N = 4–10 mice/group. Paired t test two-tailed in (C). Ordinary ANOVA with Dunnett’s multiple comparison test in (E and F). Unpaired t test two-tailed in (G), and two-way ANOVA with Sidiak’s multiple comparison test in (I and J). Graphs are shown with error bars demonstrating standard deviation. *p < 0.05, **p < 0.01, ***p < 0.001, and ****p < 0.0001 for significance.
Figure 5.
Figure 5.. Derepression of miR-15/16 target CD127 promotes activation of STAT5 via IL-7
IL-2R subunit expression in representative flow cytometry histograms (A) and fold difference of expression by median fluorescent intensity (MFI) (B) in miR-15/16fl/fl and miR-15/16fl/flCd4-Cre Tregs from the indicated tissues (change in miR-15/16fl/flCd4-Cre from miR-15/16fl/fl WT control). (C) Total number of cells and CD25 expression by MFI in co-cultures of induced Tregs (iTregs) from CD45 congenic mice (miR-15/16fl/fl and miR-15/16fl/flCd4-Cre) under different IL-2 concentrations. (D) CD25 and CD127 expression by MFI in Tregs isolated by FACS and cultured overnight (ON) with IL-2, IL-7, or in medium. (E) Ex vivo CD4+ T cell cultures from miR-15/16wt/wt Foxp3Cre and miR-15/16fl/flFoxp3Cre mice stimulated for 1 h with IL-2, IL-7, or unstimulated medium control followed by flow cytometry analysis of frequency of Tregs with phosphorylated STAT5 (anti-pY694-STAT5) and Treg pSTAT5 MFI. (F) Gene set enrichment analysis (GSEA) of genes upregulated (“STAT5-induced genes”) or downregulated (“STAT5-inhibited genes”) in Tregs with constitutively active STAT5b (extracted from Chinen et al.) in CD4+ T cells from miR-15/16fl/fl Cd4-Cre mice and miR-15/16fl/fl control mice. (G) Venn diagram demonstrating overlap between STAT5-inhibited genes (“Down in STAT5b-CA Tg”), STAT5-induced genes (“Up in STAT5b-CA Tg”), and putative miR-15/16 target genes identified by Ago2 high-throughput sequencing of RNAs isolated by crosslinking immunoprecipitation (AHC) with read depth >5. (H) Expression of overlap genes (“miR-15/16 AHC reads >5” and “Up in STAT5b-CA Tg”) in CD4+ T cells of miR-15/16fl/fl and miR-15/16fl/flCd4-Cre mice by RNA-seq, and their expression in CD4+ T cells after IL-7 stimulation. Data from a minimum of 2 independent experiments. N = 4–9/group. Ordinary ANOVA with Dunnett’s multiple comparison test in (B). Two-way ANOVA with Sidiak’s multiple comparison test in (C–E). Graphs are shown with error bars demonstrating standard deviation. *p < 0.05, **p < 0.01, ***p < 0.001, and ****p < 0.0001 for significance.
Figure 6.
Figure 6.. Treg overgrowth, caused by miR-15/16 deficiency, compensates for impaired suppressive ability
(A) Representative dot plots of CellTrace Violet (CTV) dilution in CD4+CD25CD45.1+ responder cells (Tcons) from WT mice, cultured with CD4+FOXP3-GFP+CD45.1 Tregs from miR-15/16fl/flCd4-Cre Foxp3GFP mice or miR-15/16fl/fl Foxp3GFP control mice. (B) Quantification of Treg suppression calculated based on Treg-to-Tcon seeding ratio at the start of culture. (C) Treg frequency among all T cells. (D) Representative dot plots of CTV dilution CD4+FOXP3-GFP+CD45.1 Tregs from miR-15/16fl/flCd4-Cre Foxp3GFP and miR-15/16fl/fl Foxp3GFP control. (E) Quantification of Treg proliferation (i.e., frequency of Tregs dividing ≥1). (F) Quantification of Treg suppression calculated based on Treg-to-Tcon seeding ratio at the end of culture (72 h post seeding). Data from a minimum of 2 independent experiments. N = 4–5/group. 2-way ANOVA with Sidiak’s multiple comparison test in (C) and (E), and linear regression analysis in (F). Graphs are shown with error bars demonstrating standard deviation. *p < 0.05, **p < 0.01, and ****p < 0.0001 for significance.
Figure 7.
Figure 7.. miR-15/16-mediated suppression of cell-cycle genes prevents downregulation of TCF1 and expansion of TCF1 effector Tregs
(A) Flow cytometry dot plots of Treg populations isolated for RNA-seq analysis (CD25hi Tregs, CD25lo Tregs, WT Tregs, and miR-15/16 cKO Tregs). (B) Heatmap of differentially expressed genes (DEGs) in CD25hi versus CD25lo Tregs and WT versus cKO Tregs (p < 0.05). The whole DEG list is provided as Table S1. The heatmap is plotted alongside a bar graph of AHC read depth at miR-15/16 seed matches for each gene at which they occur. (C) Genes with AHC reads >5 or AHC reads %5 at miR-15/16 seed matches that are downregulated and upregulated in cKO Tregs compared with WT Tregs. (D) Upstream regulators by ingenuity pathway analysis of DEGs in CD25hi Tregs versus CD25lo Tregs (top) and miR-15/16 cKO Tregs versus WT Tregs (bottom). (E) Heatmap expression of transcription factors and key functional molecules that distinguish resting Treg (rTreg) (TCF1+LEF1+CD62L+CD44lo) and effector Treg (eTreg) (TCF1LEF1CD62LCD44hi) subgroups described by Yang et al. Expression in WT Tregs and miR-15/16 cKO Tregs is shown. (F) Gene set enrichment analysis (GSEA) of genes upregulated in cKO Tregs (top) (compared with WT) and AHC hits (reads >5) at miR-15/16 seed matches (bottom) across eTreg and rTreg transcriptomes., Representative dot plots (G) and quantification of total (H) CD62LhiCD44lo Tregs and CD62LloCD44hi Tregs in miR-15/16fl/flFoxp3Cre mice and miR-15/16wt/wt Foxp3Cre and miR-15/16fl/fl Foxp3Wt control mice. (I) Frequency of CD25hi cells among CD62LhiCD44lo Tregs and CD62LloCD44hi Tregs in the same mice. (J) Frequency of CD62LhiCD44lo and CD62LloCD44hi Tregs among all Tregs in heterozygous female miR-15/16fl/flFoxp3Cre/Wt mice and frequency of CD25-expressing cells among the same Treg populations in the same mice (K). Frequency of TCF1 Tregs and TCF1+ Tregs among live hematopoietic cells (L, left), TCF1 among Tregs (L, right), and TCF1 MFI in Tregs (M) in spleen of miR-15/16fl/flFoxp3Cre mice and miR-15/16wt/wt Foxp3Cre and miR-15/16fl/fl Foxp3Wt control mice. (N) Schematic illustration of proposed mechanism where enhanced proliferation due to increased cell-cycle gene expression leads to TCF1 downregulation to promote eTreg generation. eTregs, characterized by lower CD25 expression, have reduced IL-2-induced gene expression and insufficiently suppress immune activation. Data from a minimum of 2 independent experiments. N = 2–10 mice/group. Chi-squared test in (C). Two-way ANOVA with Sidiak’s multiple comparison test in (H and I). Paired t test two-tailed in (J and K), and unpaired t test two-tailed in (L and M). Bar graphs are shown with error bars demonstrating standard deviation. *p < 0.05, **p < 0.01, and ****p < 0.0001 for significance.

Update of

References

    1. Fontenot JD, Rasmussen JP, Gavin MA, and Rudensky AY (2005). A function for interleukin 2 in Foxp3-expressing regulatory T cells. Nat. Immunol. 6, 1142–1151. 10.1038/ni1263. - DOI - PubMed
    1. Liston A, Farr AG, Chen Z, Benoist C, Mathis D, Manley NR, and Rudensky AY (2007). Lack of Foxp3 function and expression in the thymic epithelium. J. Exp. Med. 204, 475–480. 10.1084/jem.20062465. - DOI - PMC - PubMed
    1. Rudensky AY (2011). Regulatory T Cells and Foxp3. Immunol. Rev. 241, 260–268. 10.1111/j.1600-065X.2011.01018.x. - DOI - PMC - PubMed
    1. Feng Y, Arvey A, Chinen T, van der Veeken J, Gasteiger G, and Rudensky AY (2014). Control of the inheritance of regulatory T cell identity by a cis element in the Foxp3 locus. Cell 158, 749–763. 10.1016/j.cell.2014.07.031. - DOI - PMC - PubMed
    1. Li X, Liang Y, LeBlanc M, Benner C, and Zheng Y (2014). Function of a Foxp3 cis-element in protecting regulatory T cell identity. Cell 158, 734–748. 10.1016/j.cell.2014.07.030. - DOI - PMC - PubMed

Publication types