

Key performance indicators of COVID-19 contact tracing in Belgium from September 2020 to December 2021
- PMID: 37862313
- PMCID: PMC10588862
- DOI: 10.1371/journal.pone.0292346
Key performance indicators of COVID-19 contact tracing in Belgium from September 2020 to December 2021
Abstract
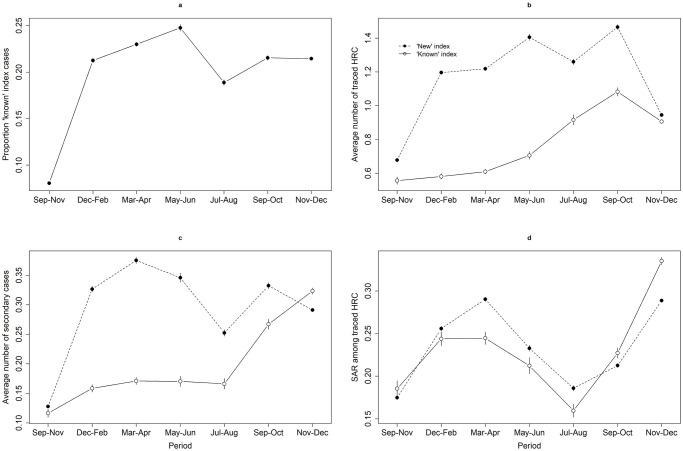
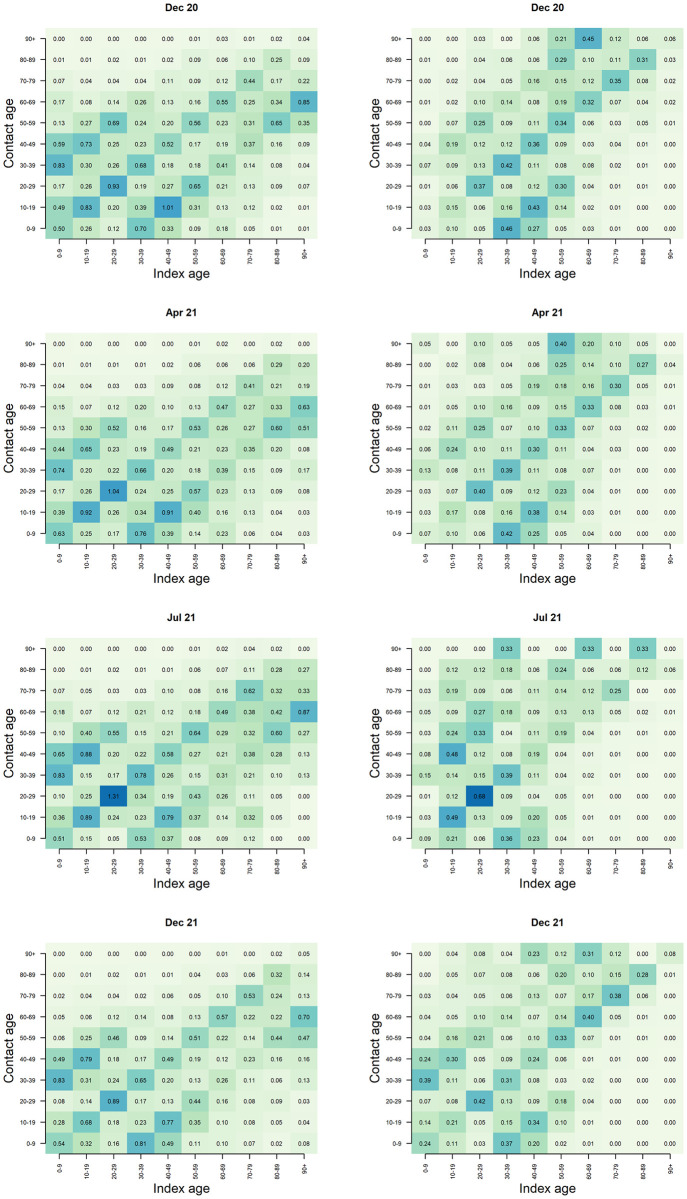
The goal of tracing, testing, and quarantining contacts of infected individuals is to contain the spread of infectious diseases, a strategy widely used during the COVID-19 pandemic. However, limited research exists on the effectiveness of contact tracing, especially with regard to key performance indicators (KPIs), such as the proportion of cases arising from previously identified contacts. In our study, we analyzed contact tracing data from Belgium collected between September 2020 and December 2021 to assess the impact of contact tracing on SARS-CoV-2 transmission and understand its characteristics. Among confirmed cases involved in contact tracing in the Flemish and Brussels-Capital regions, 19.1% were previously identified as close contacts and were aware of prior exposure. These cases, referred to as 'known' to contact tracing operators, reported on average fewer close contacts compared to newly identified individuals (0.80 versus 1.05), resulting in fewer secondary cases (0.23 versus 0.28). Additionally, we calculated the secondary attack rate, representing infections per contact, which was on average lower for the 'known' cases (0.22 versus 0.25) between December 2020 and August 2021. These findings indicate the effectiveness of contact tracing in Belgium in reducing SARS-CoV-2 transmission. Although we were unable to quantify the exact number of prevented cases, our findings emphasize the importance of contact tracing as a public health measure. In addition, contact tracing data provide indications of potential shifts in transmission patterns among different age groups associated with emerging variants of concern and increasing vaccination rates.
Copyright: © 2023 Kremer et al. This is an open access article distributed under the terms of the Creative Commons Attribution License, which permits unrestricted use, distribution, and reproduction in any medium, provided the original author and source are credited.
Conflict of interest statement
Naima Hammami is an employee of the the Flemish Government’s Department of Care and Jorden Boone has been working as a consultant for this agency during the COVID-19 pandemic. Niel Hens declares that the Universities of Antwerp and Hasselt have received funding for advisory boards and research projects of MSD, GSK, JnJ, Pfizer outside the proposed work. Niel Hens has not received any personal remuneration related to this work. The other authors declare that they have no competing interests. This does not alter our adherence to PLOS ONE policies on sharing data and materials.
Figures
References
-
- World Health Organization (WHO). Weekly epidemiological update on COVID-19—107—31 August 2022; 2022.
Publication types
MeSH terms
LinkOut - more resources
Full Text Sources
Medical
Miscellaneous
