. 2023 Oct 20;18(10):e0282624.
doi: 10.1371/journal.pone.0282624. eCollection 2023.

Time series forecasting of COVID-19 infections and deaths in Alpha and Delta variants using LSTM networks

Affiliations

Time series forecasting of COVID-19 infections and deaths in Alpha and Delta variants using LSTM networks

Farnaz Sheikhi et al. PLoS One. .

Abstract

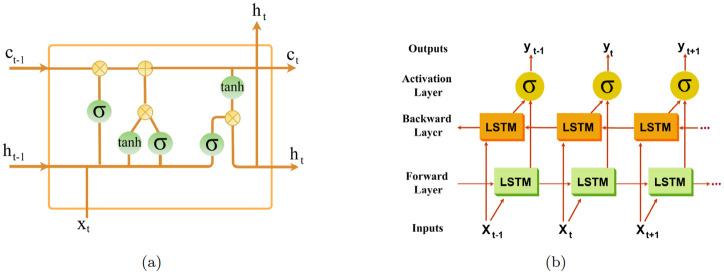
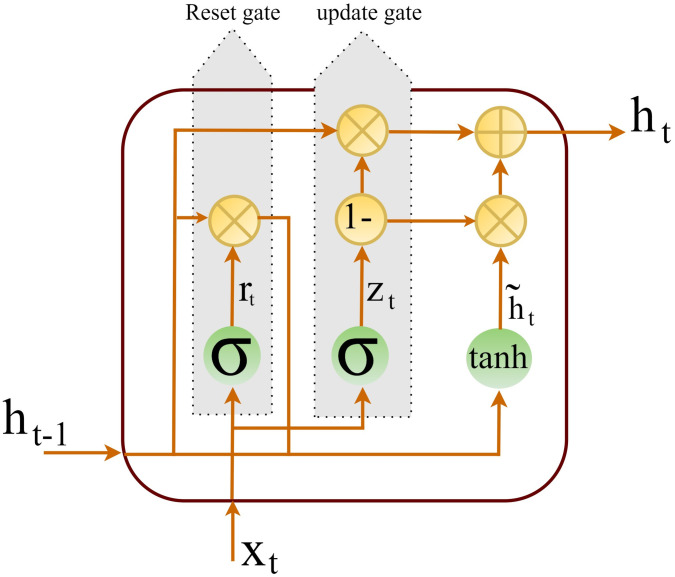
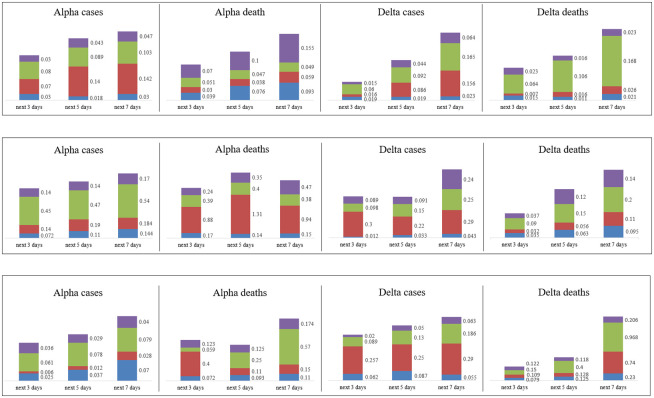
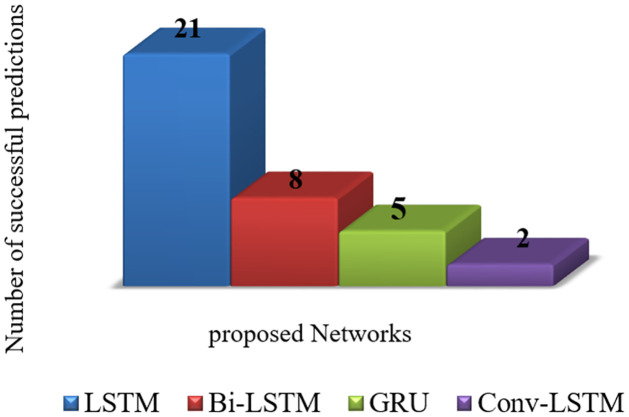
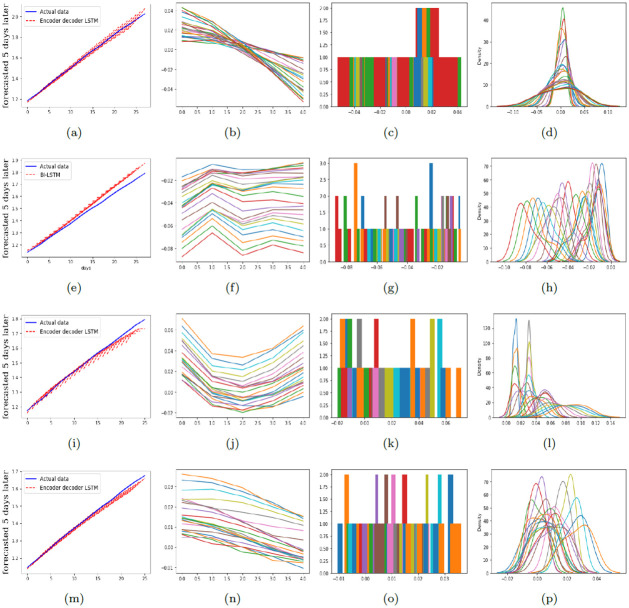
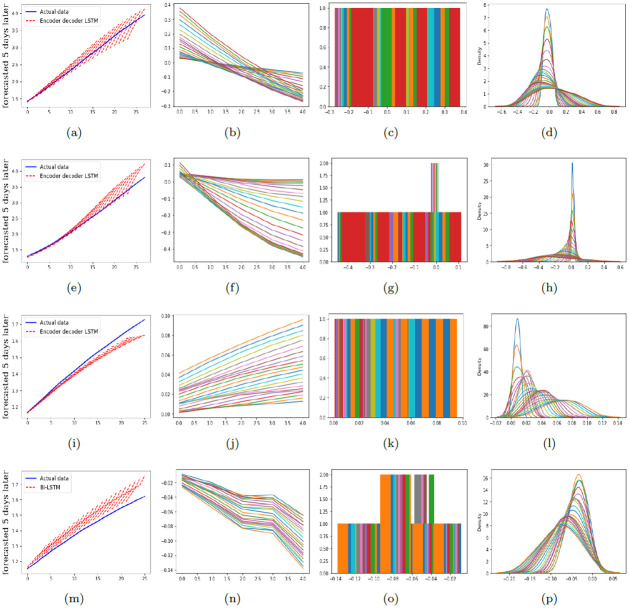
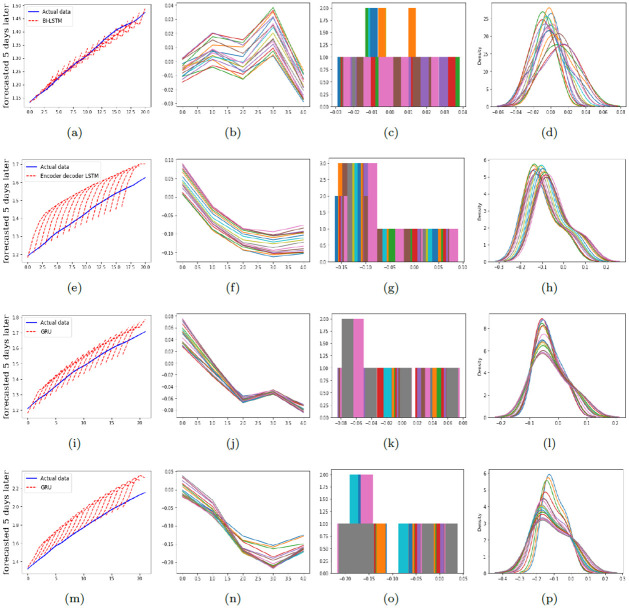
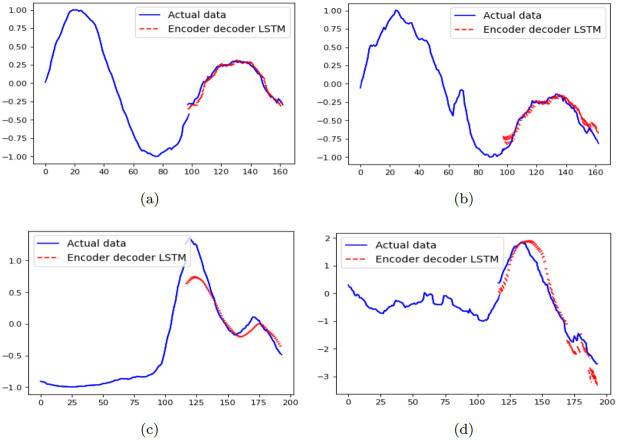
Since the beginning of the rapidly spreading COVID-19 pandemic, several mutations have occurred in the genetic sequence of the virus, resulting in emerging different variants of concern. These variants vary in transmissibility, severity of infections, and mortality rate. Designing models that are capable of predicting the future behavior of these variants in the societies can help decision makers and the healthcare system to design efficient health policies, and to be prepared with the sufficient medical devices and an adequate number of personnel to fight against this virus and the similar ones. Among variants of COVID-19, Alpha and Delta variants differ noticeably in the virus structures. In this paper, we study these variants in the geographical regions with different size, population densities, and social life styles. These regions include the country of Iran, the continent of Asia, and the whole world. We propose four deep learning models based on Long Short-Term Memory (LSTM), and examine their predictive power in forecasting the number of infections and deaths for the next three, next five, and next seven days in each variant. These models include Encoder Decoder LSTM (ED-LSTM), Bidirectional LSTM (Bi-LSTM), Convolutional LSTM (Conv-LSTM), and Gated Recurrent Unit (GRU). Performance of these models in predictions are evaluated using the root mean square error, mean absolute error, and mean absolute percentage error. Then, the Friedman test is applied to find the leading model for predictions in all conditions. The results show that ED-LSTM is generally the leading model for predicting the number of infections and deaths for both variants of Alpha and Delta, with the ability to forecast long time intervals ahead.


Conflict of interest statement

The authors have declared that no competing interests exist.

Figures

Fig 1
Fig 1. (a) An LSTM cell (b) Architecture of a Bi-LSTM.
Fig 2
Fig 2. General structure of a GRU.
Fig 3
Fig 3. Graphical diagram of MAE corresponding to predicting the number of infections and deaths for the next three, the next five, and the next seven days of Alpha and Delta variants of COVID-19.
Top down: the first row is corresponding to the MAE for predictions in the whole world, the second row is corresponding to the MAE for predictions in the continent of Asia and the Middle East, and the third row is corresponding to the MAE for predictions in the country of Iran. MAE of ED-LSTM, Bi-LSTM, Conv-LSTM, and GRU is respectively shaded blue, red, green, and purple.
Fig 4
Fig 4. Share of each network in predictions with the least error.
Fig 5
Fig 5. The residual, histogram, and density plots corresponding to the best model for predicting the number of infections and deaths in Alpha and Delta variants of COVID-19 in the whole world.
Top down: the first row is corresponding to the number of infections in Alpha variant, the second row is corresponding to the number of deaths in Alpha variant, the third row is corresponding to the number of infections in Delta variant, and the fourth row is corresponding to the number of deaths in Delta variant. Further, from left to right: the second column depicts the residual plots, the third column illustrates the histograms, and the fourth column depicts the density plots.
Fig 6
Fig 6. The residual, histogram, and density plots corresponding to the best model for predicting the number of infections and deaths in Alpha and Delta variants of COVID-19 in Asia.
Top down: the first row is corresponding to the number of infections in Alpha variant, the second row is corresponding to the number of deaths in Alpha variant, the third row is corresponding to the number of infections in Delta variant, and the fourth row is corresponding to the number of deaths in Delta variant. Further, from left to right: the second column depicts the residual plots, the third column illustrates the histograms, and the fourth column depicts the density plots.
Fig 7
Fig 7. The residual, histogram, and density plots corresponding to the best model for predicting the number of infections and deaths in Alpha and Delta variants of COVID-19 in Iran.
Top down: the first row is corresponding to the number of infections in Alpha variant, the second row is corresponding to the number of deaths in Alpha variant, the third row is corresponding to the number of infections in Delta variant, and the fourth row is corresponding to the number of deaths in Delta variant. Further, from left to right: the second column depicts the residual plots, the third column illustrates the histograms, and the fourth column depicts the density plots.
Fig 8
Fig 8. Predicting the number of infections and deaths due to COVID-19 for the next two months following Alpha and Delta variants in the world.
Top down: the first raw is corresponding to the statistics of Alpha variant, and the second raw is corresponding to the statistics of Delta variant. From left to right: the first column is corresponding to the number of infections, and the second column is corresponding to the number of deaths.

Similar articles

References

    1. https://www.who.int/director-general/speeches/detail/who-director-genera....
    1. Guan WJ, Chen RC, Zhong NS. Strategies for the prevention and management of coronavirus disease 2019. European Respiratory Journal. 2020;55(4):2000597. doi: 10.1183/13993003.00597-2020 - DOI - PMC - PubMed
    1. Sheikhi F, Alipour S. A geometric algorithm for fault-tolerant classification of COVID-19 Infected People. In: 2021 26th International Computer Conference, Computer Society of Iran (CSICC); 2021. p. 1–5.
    1. https://www.who.int/westernpacific/emergencies/covid-19/information/covi....
    1. Delamater P, Street E, Leslie T, Yang Y, Jacobsen K. Complexity of the basic reproduction number (R0). Emerging Infectious Diseases. 2019;25:1–4. doi: 10.3201/eid2501.171901 - DOI - PMC - PubMed

Supplementary concepts