. 2023 Oct 24;120(43):e2219801120.
doi: 10.1073/pnas.2219801120. Epub 2023 Oct 20.

Surfaceome analysis of extracellular vesicles from senescent cells uncovers uptake repressor DPP4

Affiliations

Surfaceome analysis of extracellular vesicles from senescent cells uncovers uptake repressor DPP4

Qiong Meng et al. Proc Natl Acad Sci U S A. .

Abstract

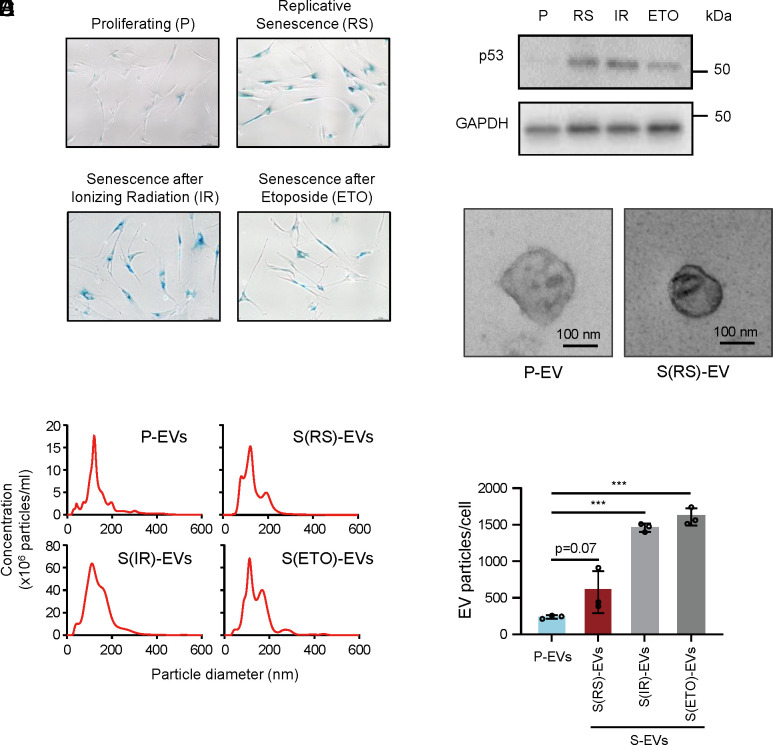
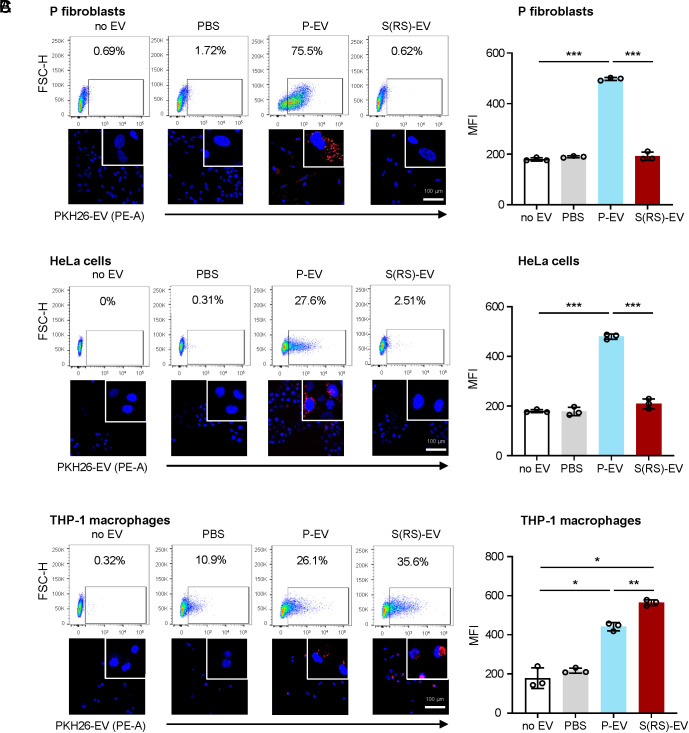
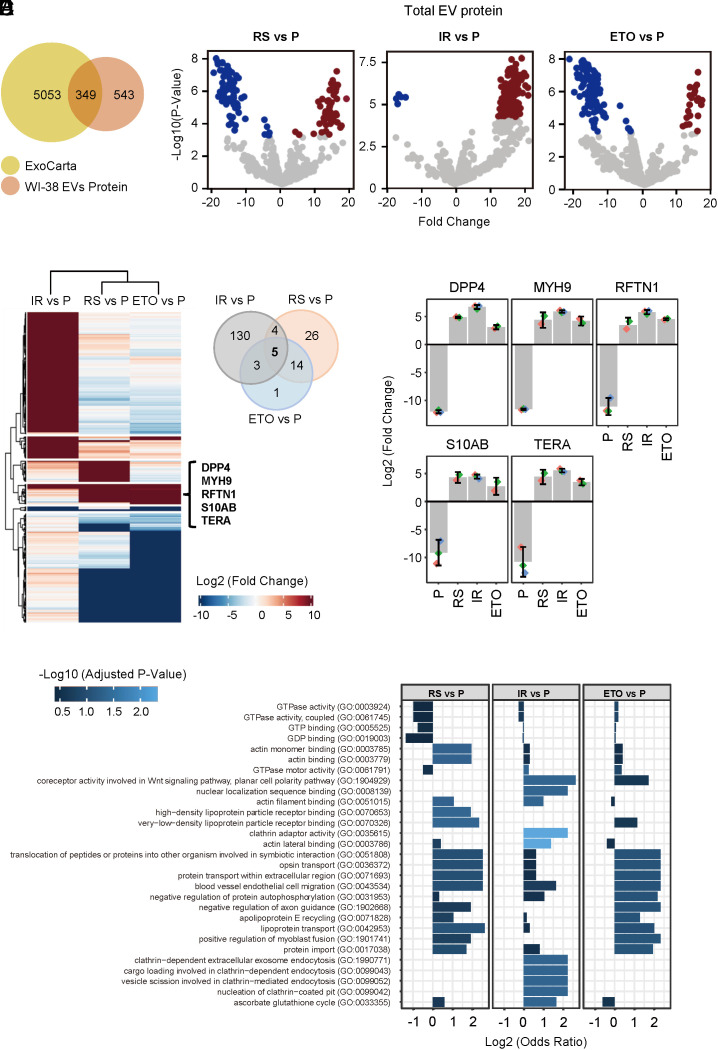
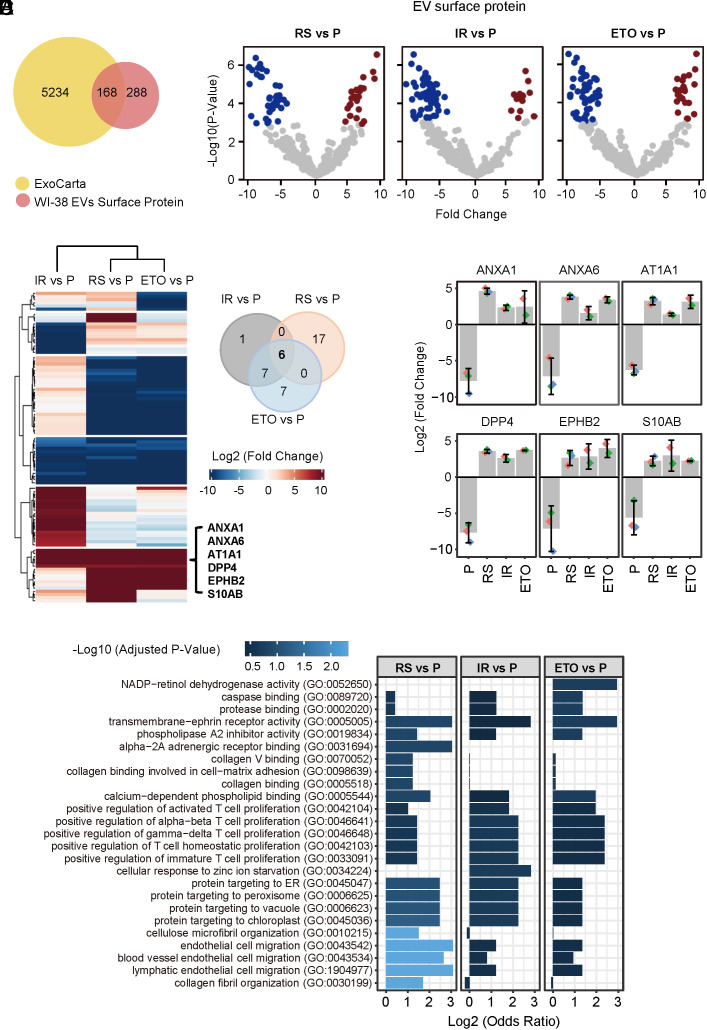
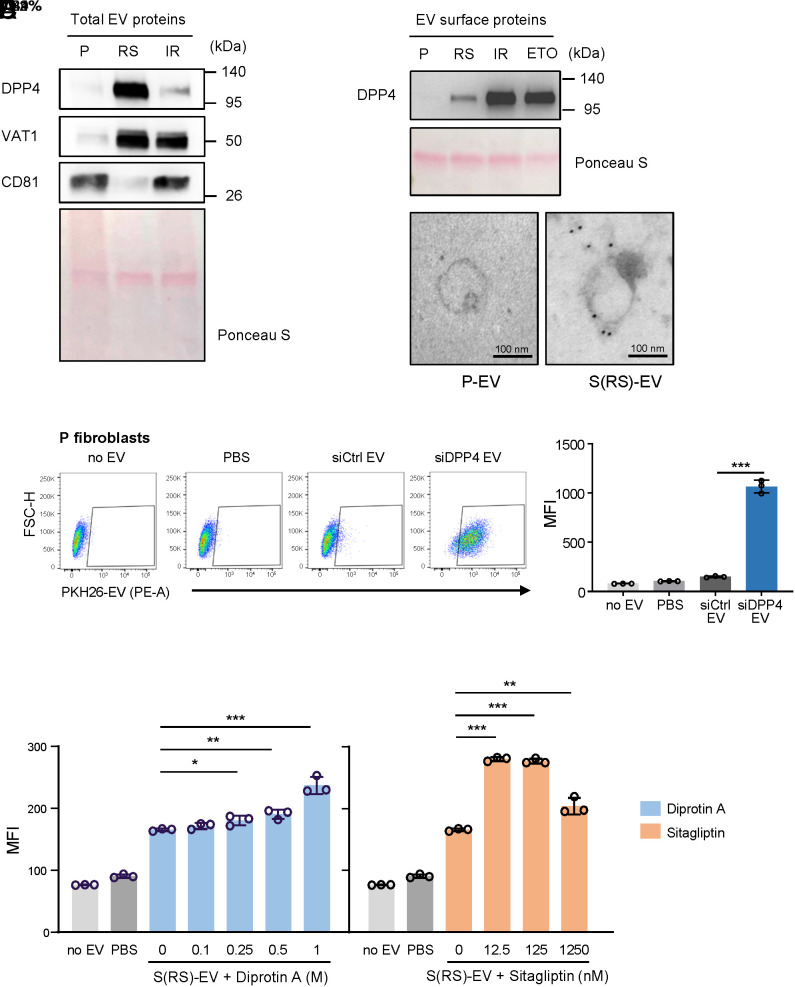
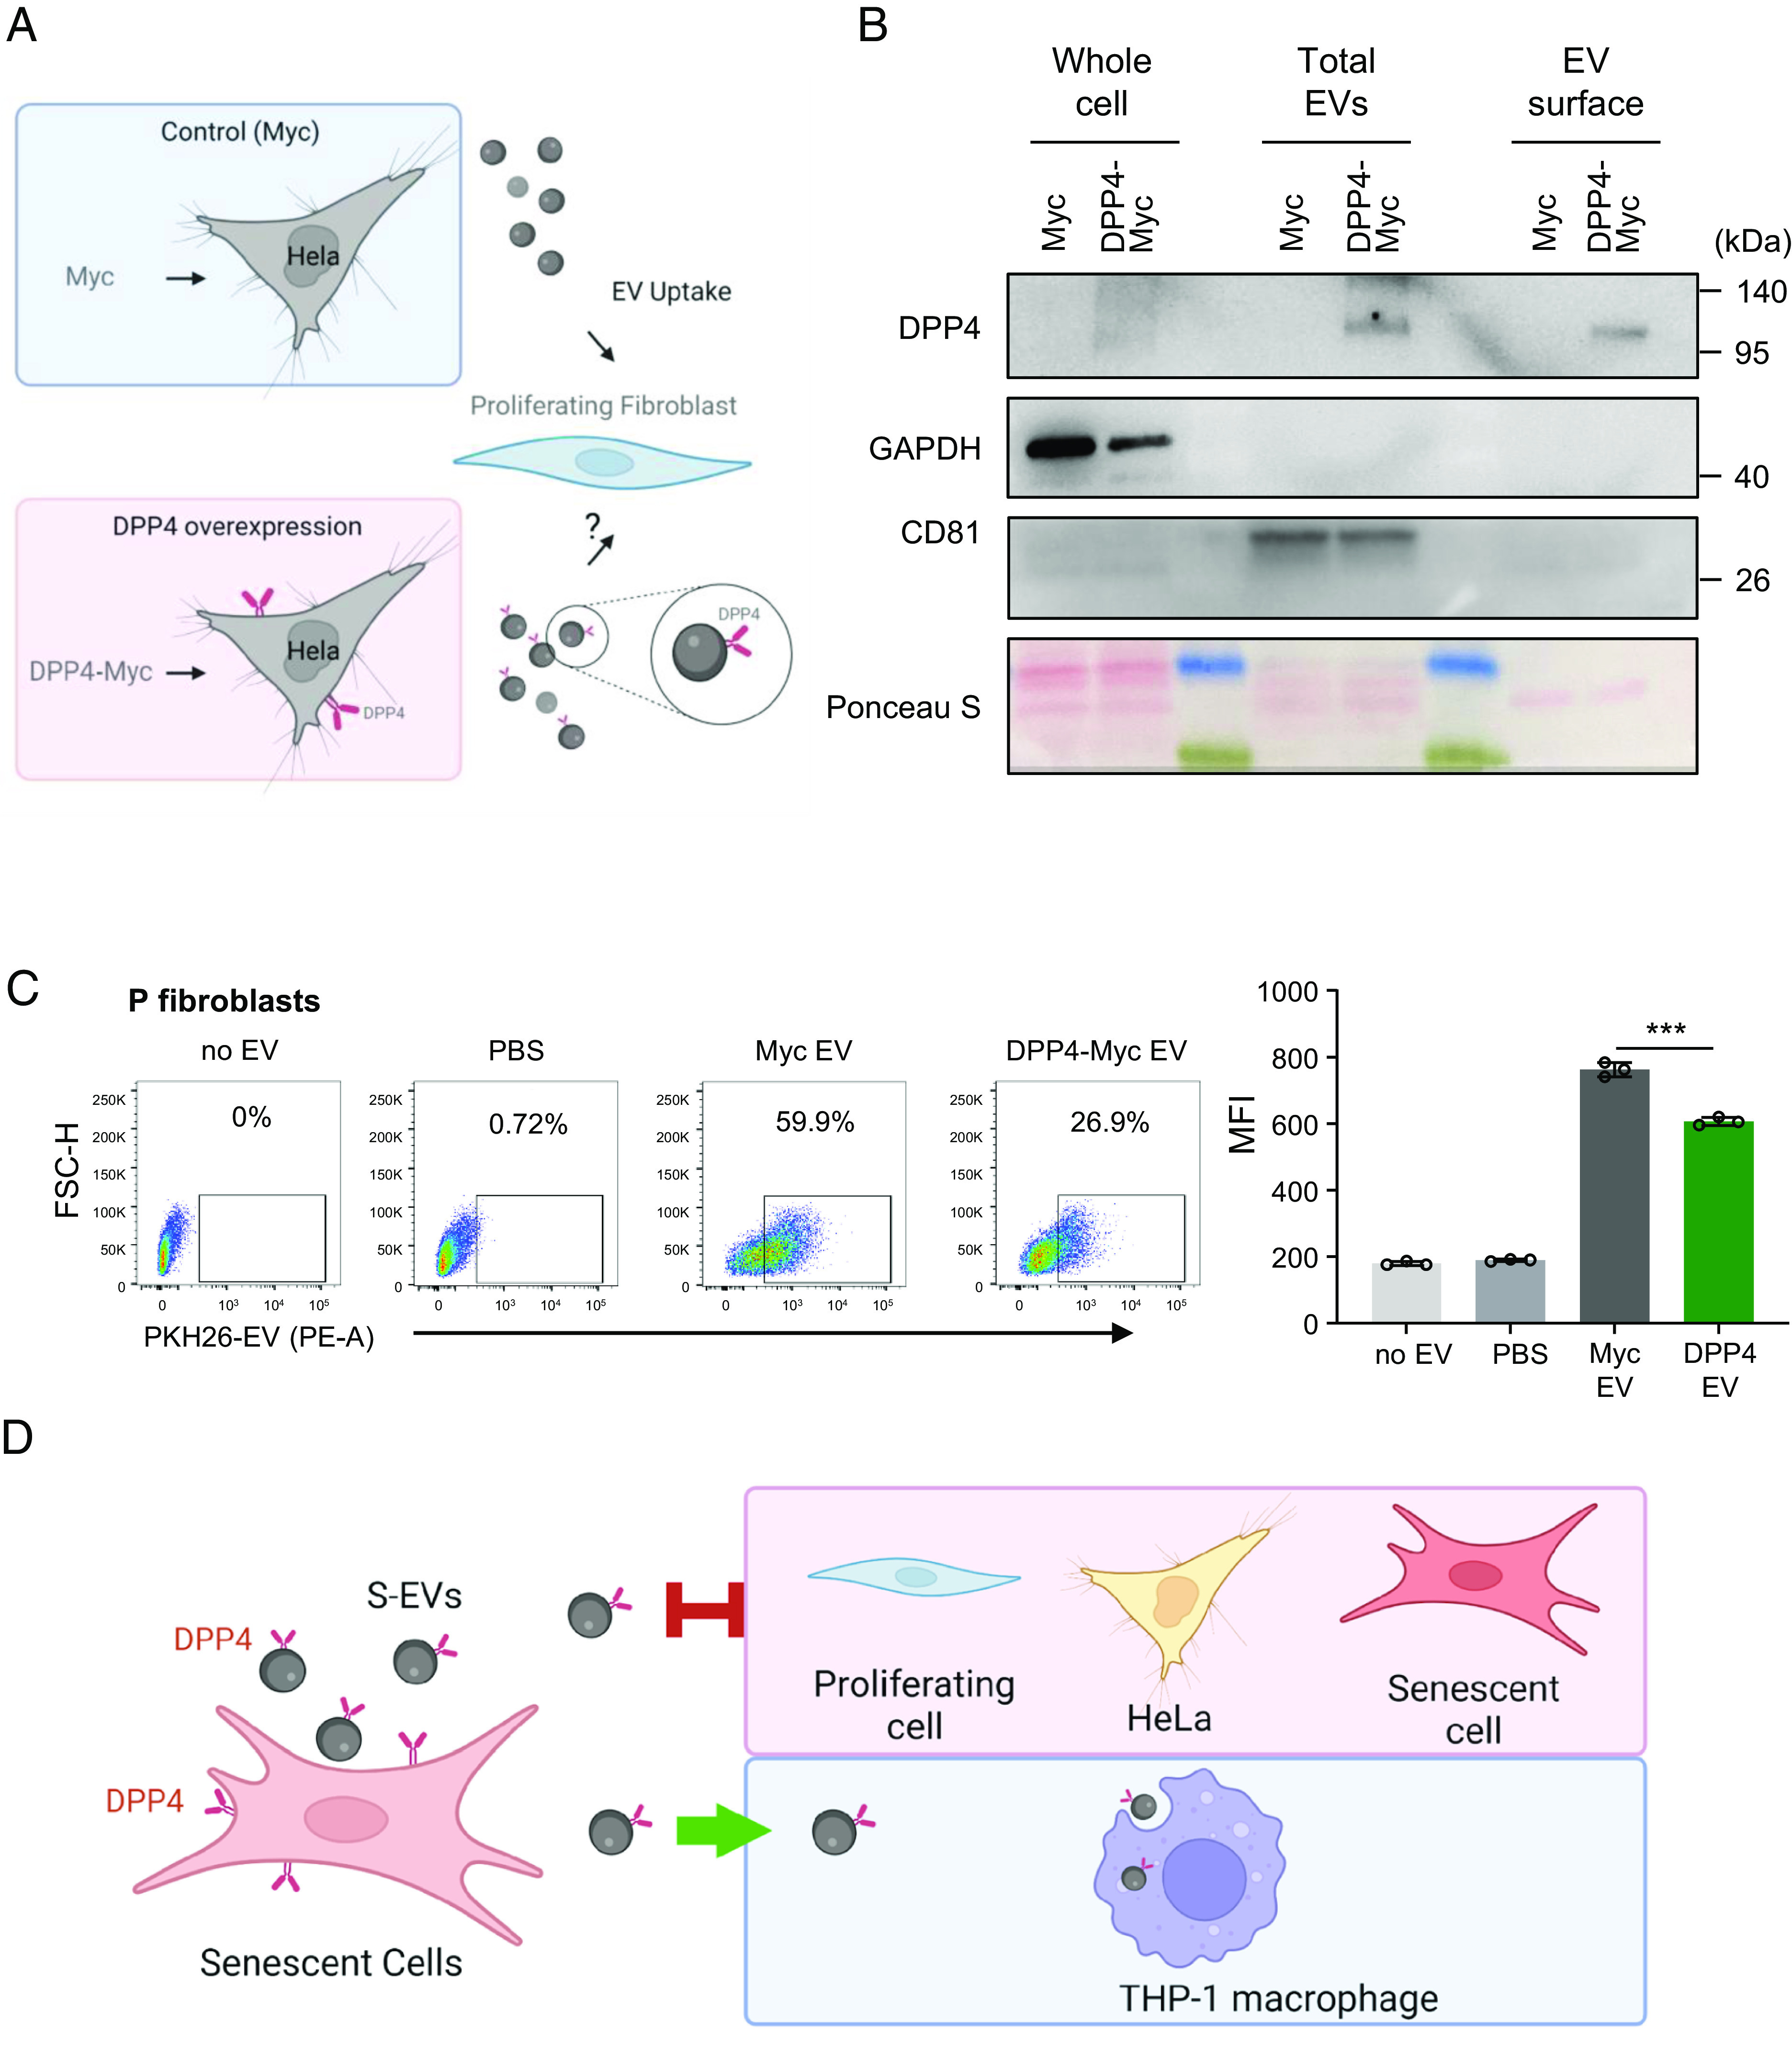
Senescent cells are beneficial for repairing acute tissue damage, but they are harmful when they accumulate in tissues, as occurs with advancing age. Senescence-associated extracellular vesicles (S-EVs) can mediate cell-to-cell communication and export intracellular content to the microenvironment of aging tissues. Here, we studied the uptake of EVs from senescent cells (S-EVs) and proliferating cells (P-EVs) and found that P-EVs were readily taken up by proliferating cells (fibroblasts and cervical cancer cells) while S-EVs were not. We thus investigated the surface proteome (surfaceome) of P-EVs relative to S-EVs derived from cells that had reached senescence via replicative exhaustion, exposure to ionizing radiation, or treatment with etoposide. We found that relative to P-EVs, S-EVs from all senescence models were enriched in proteins DPP4, ANXA1, ANXA6, S10AB, AT1A1, and EPHB2. Among them, DPP4 was found to selectively prevent uptake by proliferating cells, as ectopic overexpression of DPP4 in HeLa cells rendered DPP4-expressing EVs that were no longer taken up by other proliferating cells. We propose that DPP4 on the surface of S-EVs makes these EVs refractory to internalization by proliferating cells, advancing our knowledge of the impact of senescent cells in aging-associated processes.

Keywords: extracellular vesicles; senescence; surfaceome.


Conflict of interest statement

The authors declare no competing interest.

Figures

Fig. 1.
Fig. 1.
Levels of secreted EVs increase with cell senescence. (A) Senescence was monitored by assessing the senescence-associated (SA)-β-gal activity (blue staining) of WI-38 cells and confirmed in three different senescence paradigms, while proliferating cells (P) do not show staining. WI-38 human diploid fibroblasts were either left untreated (Proliferating, P) or were rendered senescent by exposure to 10 Gy ionizing radiation (IR) followed by incubation for 8 d, by treatment with 50 μM etoposide every 72 h and harvested at day 6 (ETO) or reached replicative senescence (RS) by proliferation to exhaustion, from population doubling number (PDL) 20 (P fibroblasts) to senescence at ~PDL52. (B) The levels of the senescence marker protein p53 (TP53) in each of the four fibroblast populations were monitored by western blot analysis; the levels of the housekeeping control protein GAPDH were assessed to monitor differences in loading across the four groups. (C) Representative transmission electron microscopy (TEM) images showing the morphology of S-EVs from fibroblasts rendered RS as described in A. See also SI Appendix, Fig. S1B. (D) Size and concentration (EVs per mL) of EVs collected from the populations described in A and measured by Nanosight NS300 Nanoparticle tracking analysis (NTA, Methods). (E) The numbers of EVs per cell were calculated based on measurements taken over 48 h in the fibroblast populations described in A. Data in E are the mean ± SEM from three biological replicates; ***P ≤ 0.001. Data were analyzed by one-way ANOVA.
Fig. 2.
Fig. 2.
Distinct uptake by different cells of P-EVs relative to S-EVs prepared from WI-38 fibroblasts. Flow cytometric analysis (Top) and representative confocal microscopy images (Bottom) of the uptake of P-EVs and S-EVs (as well as control incubations without EVs, ‘no EV’, and with PKH26 in PBS, 'PBS only') by proliferating WI-38 fibroblasts (A), HeLa cells (B), and THP-1 cells differentiated to macrophages by incubation for 48 h with PMA (C). Right, quantification of MFI in flow cytometric assays in each of the three recipient cells and the four incubation groups. Data in A–C are the mean ± SEM from three biological replicates; statistical analysis was performed by one-way ANOVA for multiple group comparison (P-EVs, S-EVs, or PBS vs. no EV group) and Student’s t test for P-EVs vs. S-EVs group. *P ≤ 0.05; **P ≤ 0.01; ***P ≤ 0.001.
Fig. 3.
Fig. 3.
Mass spectrometry profiling of proteomes from whole EVs from proliferating and senescent WI-38 fibroblasts. (A) Venn diagram of proteins (892 total) identified in the EV samples from all four groups combined (P, RS, IR, and ETO) compared with proteins annotated in the ExoCarta databases (5,402 proteins). (B) Volcano plots of proteins differentially abundant in S-EVs from fibroblasts rendered senescent by RS, IR, or ETO relative to proliferating (P) fibroblasts. (C) Left, heatmap of proteins differentially abundant in EVs from fibroblasts rendered senescent (S) by RS, IR, or ETO relative to EVs from proliferating (P) fibroblasts. Right, Venn diagram indicating five proteins enriched in EVs from all three senescent paradigms compared with proliferating fibroblasts. (D) Bar graphs depicting the abundance of the five specific proteins (DPP4, MYH9, RFTN1, S10AB, and TERA) in whole S-EVs [prepared from senescent (RS, IR, and ETO) cells] compared with P-EVs (prepared from proliferating cells), as measured by mass spectrometry profiling. (E) Gene Ontology enrichment analysis of the proteins preferentially abundant in EVs from S fibroblasts (RS, IR, and ETO) compared with EVs from P fibroblasts.
Fig. 4.
Fig. 4.
Mass spectrometry profiling of surfaceome of EVs from proliferating and senescent fibroblasts. (A) Venn diagram of proteins (456 total) identified in the surfaces of EV samples from all four groups combined (P, RS, IR, and ETO) compared with proteins annotated in the ExoCarta databases (5,402 proteins). (B) Volcano plot of proteins differentially abundant on the surface of EVs from proliferating (P) fibroblasts relative to the surface of EVs from fibroblasts rendered senescent (S) by RS, IR, or ETO. (C) Left, heatmap of proteins differentially abundant on the surface of EVs from proliferating (P) fibroblasts relative to the surface of EVs from fibroblasts rendered senescent (S) by RS, IR, or ETO. Right, Venn diagram indicating the six proteins enriched on the surface of EVs from all three senescent paradigms compared with EVs from proliferating fibroblasts. (D) Bar graph depicting the abundance of the 6 specific proteins (ANXA1, ANXA6, AT1A1, DPP4, EPHB2, and S10AB) on the surface of S-EVs [prepared from S (RS, IR, ETO) cells] compared with P-EVs (prepared from P cells), as measured by proteomic analysis. (E) Gene Ontology enrichment analysis of the proteins preferentially abundant on the surface of EVs from S fibroblasts (RS, IR, and ETO) compared with EVs from P fibroblasts.
Fig. 5.
Fig. 5.
Validation of DPP4 on the surface of S-EVs. (A and B) Western Blot analysis of the levels of DPP4 in total lysates (A) and on the surface (B) of EVs isolated from P fibroblasts and from S fibroblasts [S (RS), IR]; Ponceau S staining of the transfer membrane was carried out to monitor loading of the samples. (C) Representative TEM images of DPP4-specific immunogold staining (black dots) of EVs isolated from proliferating and senescent (RS) WI-38 fibroblasts. (D) Left, flow cytometric analysis of the uptake by P fibroblasts of EVs isolated from WI-38 fibroblasts (PDL45) that had been transfected with either a nontargeting siRNA control (siCtrl) or DPP4-targeting siRNA (siDPP4); control incubations with no EVs and PBS only were included as in Fig. 2. Right, quantification of MFI for each sample. (E) Quantification (MFI) of the flow cytometric analysis of P fibroblasts to measure the uptake of PKH26-labeled S(RS)-EVs that were pre-treated with DPP4 inhibitors Diprotin A or Sitagliptin; control samples with no EVs and PBS only were included. Data in D and E are the mean ± SEM from three biological replicates; statistical analysis was performed by one-way ANOVA for multiple group comparison (siCtrl EVs, siDPP4 EVs, PBS, no EV groups) and Student’s t test for siCtrl EVs vs. siDPP4 EVs group. *P ≤ 0.05; **P ≤ 0.01; ***P ≤ 0.001.
Fig. 6.
Fig. 6.
Impact of ectopic lentiviral overexpression of DPP4 on EV internalization efficiency by HeLa cells. (A) Schematic of the experiment: Hela cells were infected with a control lentivirus (Myc) or a lentivirus that overexpressed DPP4 (DPP4-Myc); after selection for 20 d, EVs were then collected for analysis. (B) Western blot analysis of DPP4 levels in HeLa cells expressing in the control group (Myc lentivirus) and the DPP4 overexpressing group (DPP4-Myc virus). Proteins were collected from whole cells, from total EVs derived from the lentivirus transfected cells, and from the surface membrane of the isolated EVs. The levels of housekeeping control protein GAPDH and the EV marker CD81 were also monitored, and overall loading and membrane transfer were monitored by Ponceau S staining. (C) Left, flow cytometric analysis showing the uptake by proliferating (P) WI-38 fibroblasts after incubation with no EVs, with only PBS, and with PKH26-labeled EVs prepared from HeLa cells that were infected with the Myc lentivirus or with the DPP4-Myc lentivirus. Right, bar graphs quantify the uptake of fluorescence (MFI) after the incubations shown on the left. Data are the means ± SEM of three biological replicates; Student’s t test is used for two groups comparison. (D) A proposed model showing that S-EVs bearing DPP4 on the surface showed reduced internalization by fibroblasts (proliferating or senescent) and by HeLa cells, while they are taken up by macrophages. ***P ≤ 0.001.

References

    1. Di Micco R., Krizhanovsky V., Baker D., d’Adda di Fagagna F., Cellular senescence in ageing: From mechanisms to therapeutic opportunities. Nat. Rev. Mol. Cell Biol. 22, 75–95 (2021). - PMC - PubMed
    1. Kumari R., Jat P., Mechanisms of cellular senescence: Cell cycle arrest and senescence associated secretory phenotype. Front. Cell Dev. Biol. 9, 645593 (2021). - PMC - PubMed
    1. Kovacic J. C., Moreno P., Nabel E. G., Hachinski V., Fuster V., Cellular senescence, vascular disease, and aging: Part 2 of a 2-part review: Clinical vascular disease in the elderly. Circulation 123, 1900–1910 (2011). - PubMed
    1. Baar M. P., et al. , Targeted apoptosis of senescent cells restores tissue homeostasis in response to chemotoxicity and aging. Cell 169, 132–147.e16 (2017). - PMC - PubMed
    1. Martinez-Cue C., Rueda N., Cellular senescence in neurodegenerative diseases. Front. Cell Neurosci. 14, 16 (2020). - PMC - PubMed

Substances