. 2023 Oct 20;9(42):eadi2205.
doi: 10.1126/sciadv.adi2205. Epub 2023 Oct 20.

Gender and retention patterns among U.S. faculty

Affiliations

Gender and retention patterns among U.S. faculty

Katie Spoon et al. Sci Adv. .

Abstract

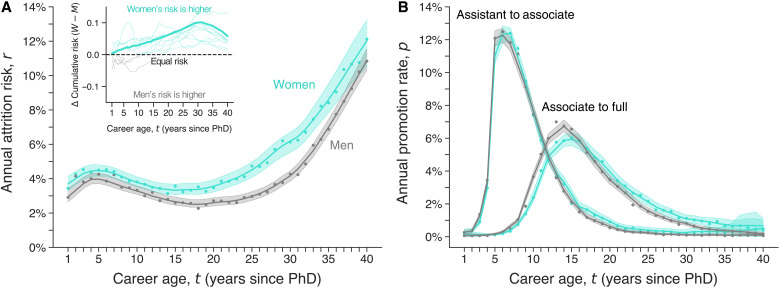
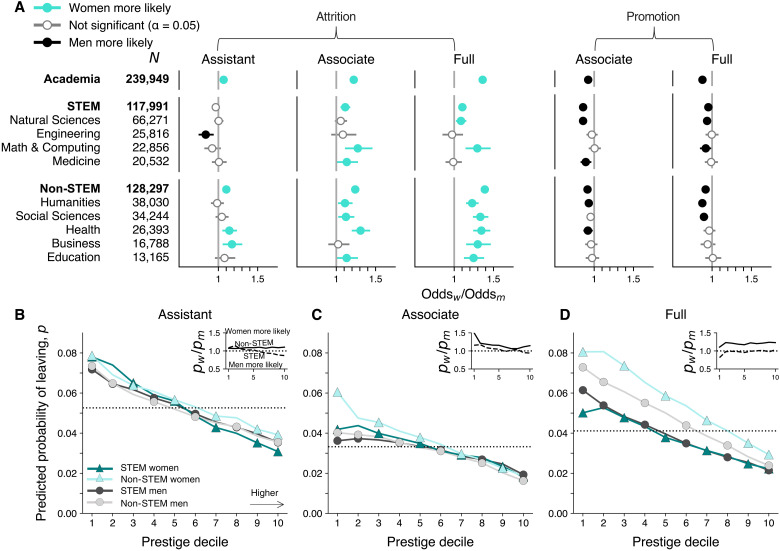
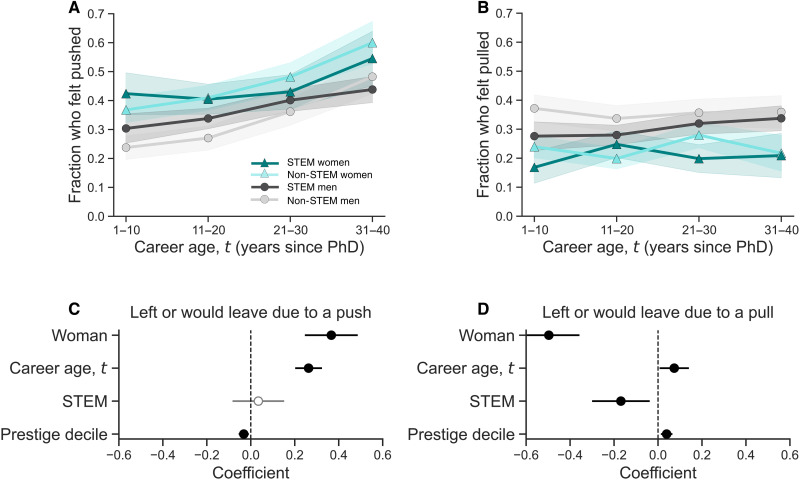
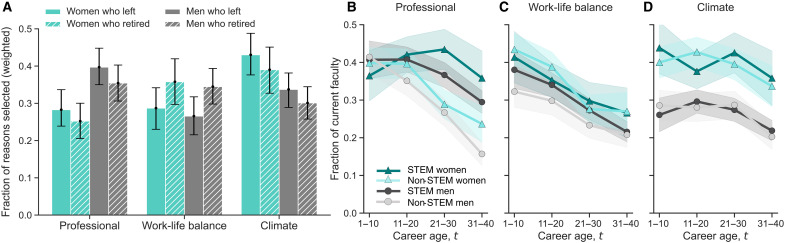
Women remain underrepresented among faculty in nearly all academic fields. Using a census of 245,270 tenure-track and tenured professors at United States-based PhD-granting departments, we show that women leave academia overall at higher rates than men at every career age, in large part because of strongly gendered attrition at lower-prestige institutions, in non-STEM fields, and among tenured faculty. A large-scale survey of the same faculty indicates that the reasons faculty leave are gendered, even for institutions, fields, and career ages in which retention rates are not. Women are more likely than men to feel pushed from their jobs and less likely to feel pulled toward better opportunities, and women leave or consider leaving because of workplace climate more often than work-life balance. These results quantify the systemic nature of gendered faculty retention; contextualize its relationship with career age, institutional prestige, and field; and highlight the importance of understanding the gendered reasons for attrition rather than focusing on rates alone.


Figures

Fig. 1.
Fig. 1.. Gendered retention rates.
(A) Annual all-cause attrition risk (see text) and (B) annual promotion rate to associate and to full professor, both as a function of career age (years since PhD); envelopes indicate a 95% confidence interval under a bootstrap on faculty careers (1000 bootstrap iterations). Inset: Differential cumulative attrition risk across academia (heavy line) and by academic domain (lighter lines).
Fig. 2.
Fig. 2.. Retention rates by domain and prestige.
(A) Time-averaged attrition and promotion ORs, split by academic rank, controlling for career length, employer prestige, and doctoral degree (domestic versus international), with 95% confidence intervals and statistical significance assessed via a z test. Because our dataset is a census, error bars can be interpreted as reflecting variability primarily from the underlying mechanisms rather than uncertainty in the odds that we observe. Individuals with appointments in multiple domains (12.8% of faculty) are counted in each domain. Contrasting Fig. 1, here, faculty without PhD country or employer prestige information were excluded. (B to D) Average predicted probability of leaving, split by academic rank and across prestige decile, with 10 representing the most prestigious and 1 the least prestigious employer, for women and men in STEM versus non-STEM domains. Dotted horizontal lines represent the average probability of leaving for all professors at that rank. Inset: pwomen/pmen across prestige decile, for STEM (dashed) versus non-STEM (solid) domains.
Fig. 3.
Fig. 3.. Pushes and pulls.
Fraction of women and men in STEM versus non-STEM domains across career age who left or would leave their position because (A) they felt pushed out of their position or (B) they felt pulled toward a better position. Envelopes indicate a 95% confidence interval using a normal approximation to a binomial proportion. Coefficients from logistic regression models predicting whether someone felt (C) pushed or (D) pulled.
Fig. 4.
Fig. 4.. Reasons for leaving academia.
(A) Fraction of reasons from each category selected by faculty who left academia or retired, weighted by both the number of reasons in that category and the number of total reasons the respondent selected (section S4B). We note that these comparisons focus on the relative importance of each category, and fractions for each group sum to 1, meaning that while the fraction of women who left academia because of work-life balance reasons may be greater than the fraction of women who retired because of work-life balance reasons, workplace climate made up a larger fraction of the reasons women left academia than work-life balance. 95% confidence intervals are shown under a bootstrap of faculty (1000 bootstrap iterations). (B to D) Fraction of women and men current faculty members in STEM versus non-STEM domains who reported each category as having a “major impact” in their potential decision to leave. Respondents could list multiple categories as a major impact, so fractions do not sum to 1. Envelopes indicate a 95% confidence interval using a normal approximation to a binomial proportion.

References

    1. K. H. Wapman, S. Zhang, A. Clauset, D. B. Larremore, Quantifying hierarchy and dynamics in US faculty hiring and retention. Nature 610, 120–127 (2022). - PMC - PubMed
    1. National Center for Science and Engineering Statistics, Women, minorities, and persons with disabilities in science and engineering: 2021 (Special report NSF 21-321, 2021).
    1. A. N. Pell, Fixing the leaky pipeline: Women scientists in academia. J. Anim. Sci. 74, 2843–2848 (1996). - PubMed
    1. L. L. Hargens, J. S. Long, Demographic inertia and women’s representation among faculty in higher education. J. High. Educ. 73, 494–517 (2002).
    1. D. Kozlowski, V. Larivière, C. R. Sugimoto, T. Monroe-White, Intersectional inequalities in science. Proc. Natl. Acad. Sci. U.S.A. 119, e2113067119 (2022). - PMC - PubMed