. 2023 Nov 2;30(11):1503-1519.e8.
doi: 10.1016/j.stem.2023.09.011. Epub 2023 Oct 19.

SRCAP mutations drive clonal hematopoiesis through epigenetic and DNA repair dysregulation

Affiliations

SRCAP mutations drive clonal hematopoiesis through epigenetic and DNA repair dysregulation

Chun-Wei Chen et al. Cell Stem Cell. .

Erratum in

  • SRCAP mutations drive clonal hematopoiesis through epigenetic and DNA repair dysregulation.
    Chen CW, Zhang L, Dutta R, Niroula A, Miller PG, Gibson CJ, Bick AG, Reyes JM, Lee YT, Tovy A, Gu T, Waldvogel S, Chen YH, Venters BJ, Estève PO, Pradhan S, Keogh MC, Natarajan P, Takahashi K, Sperling AS, Goodell MA. Chen CW, et al. Cell Stem Cell. 2024 Feb 1;31(2):275-277. doi: 10.1016/j.stem.2024.01.001. Cell Stem Cell. 2024. PMID: 38306995 Free PMC article. No abstract available.

Abstract

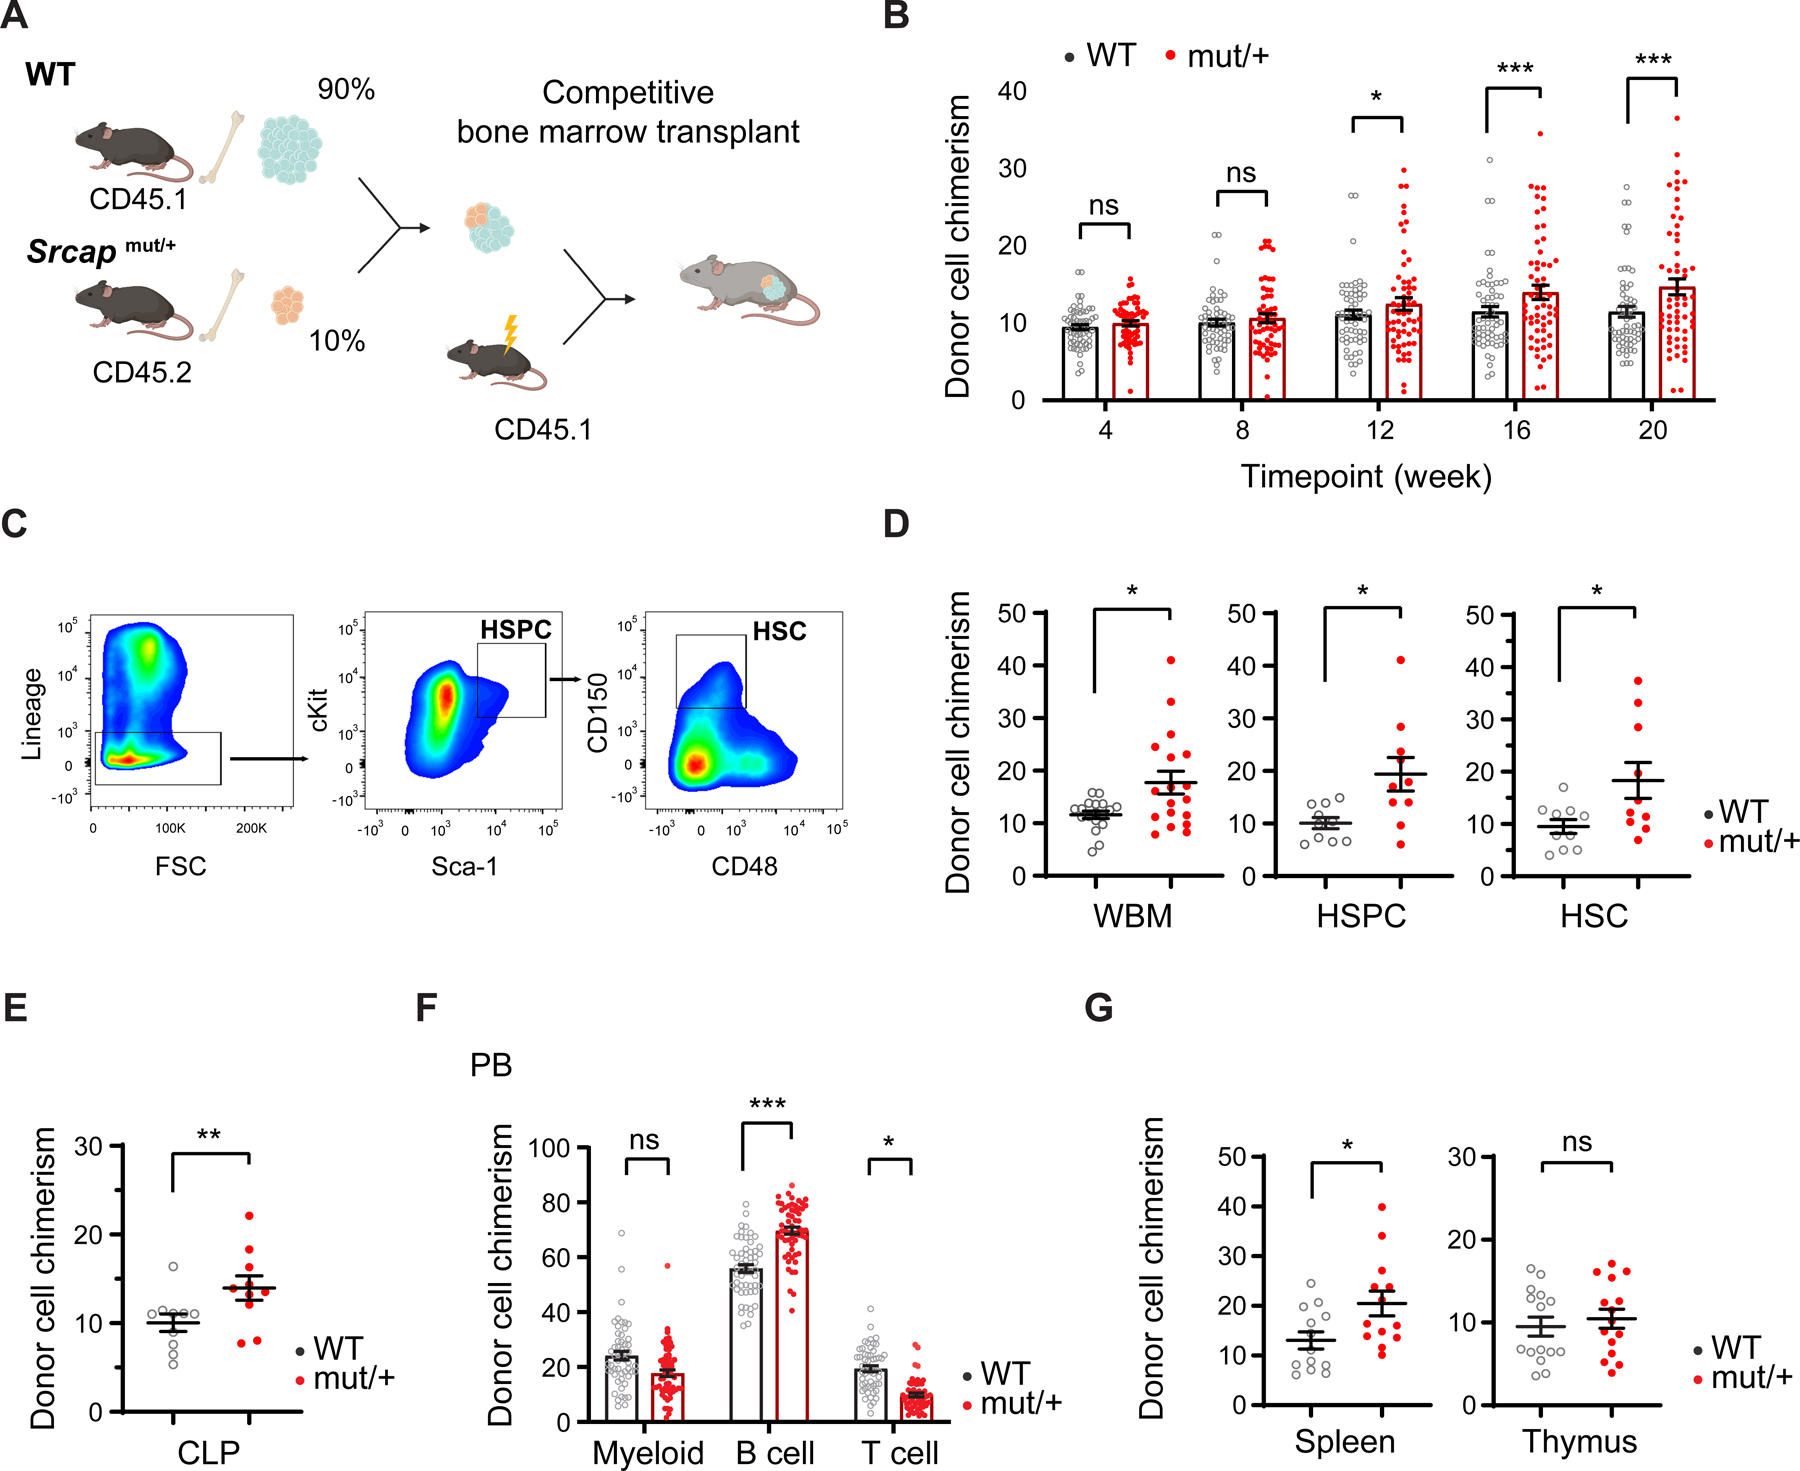
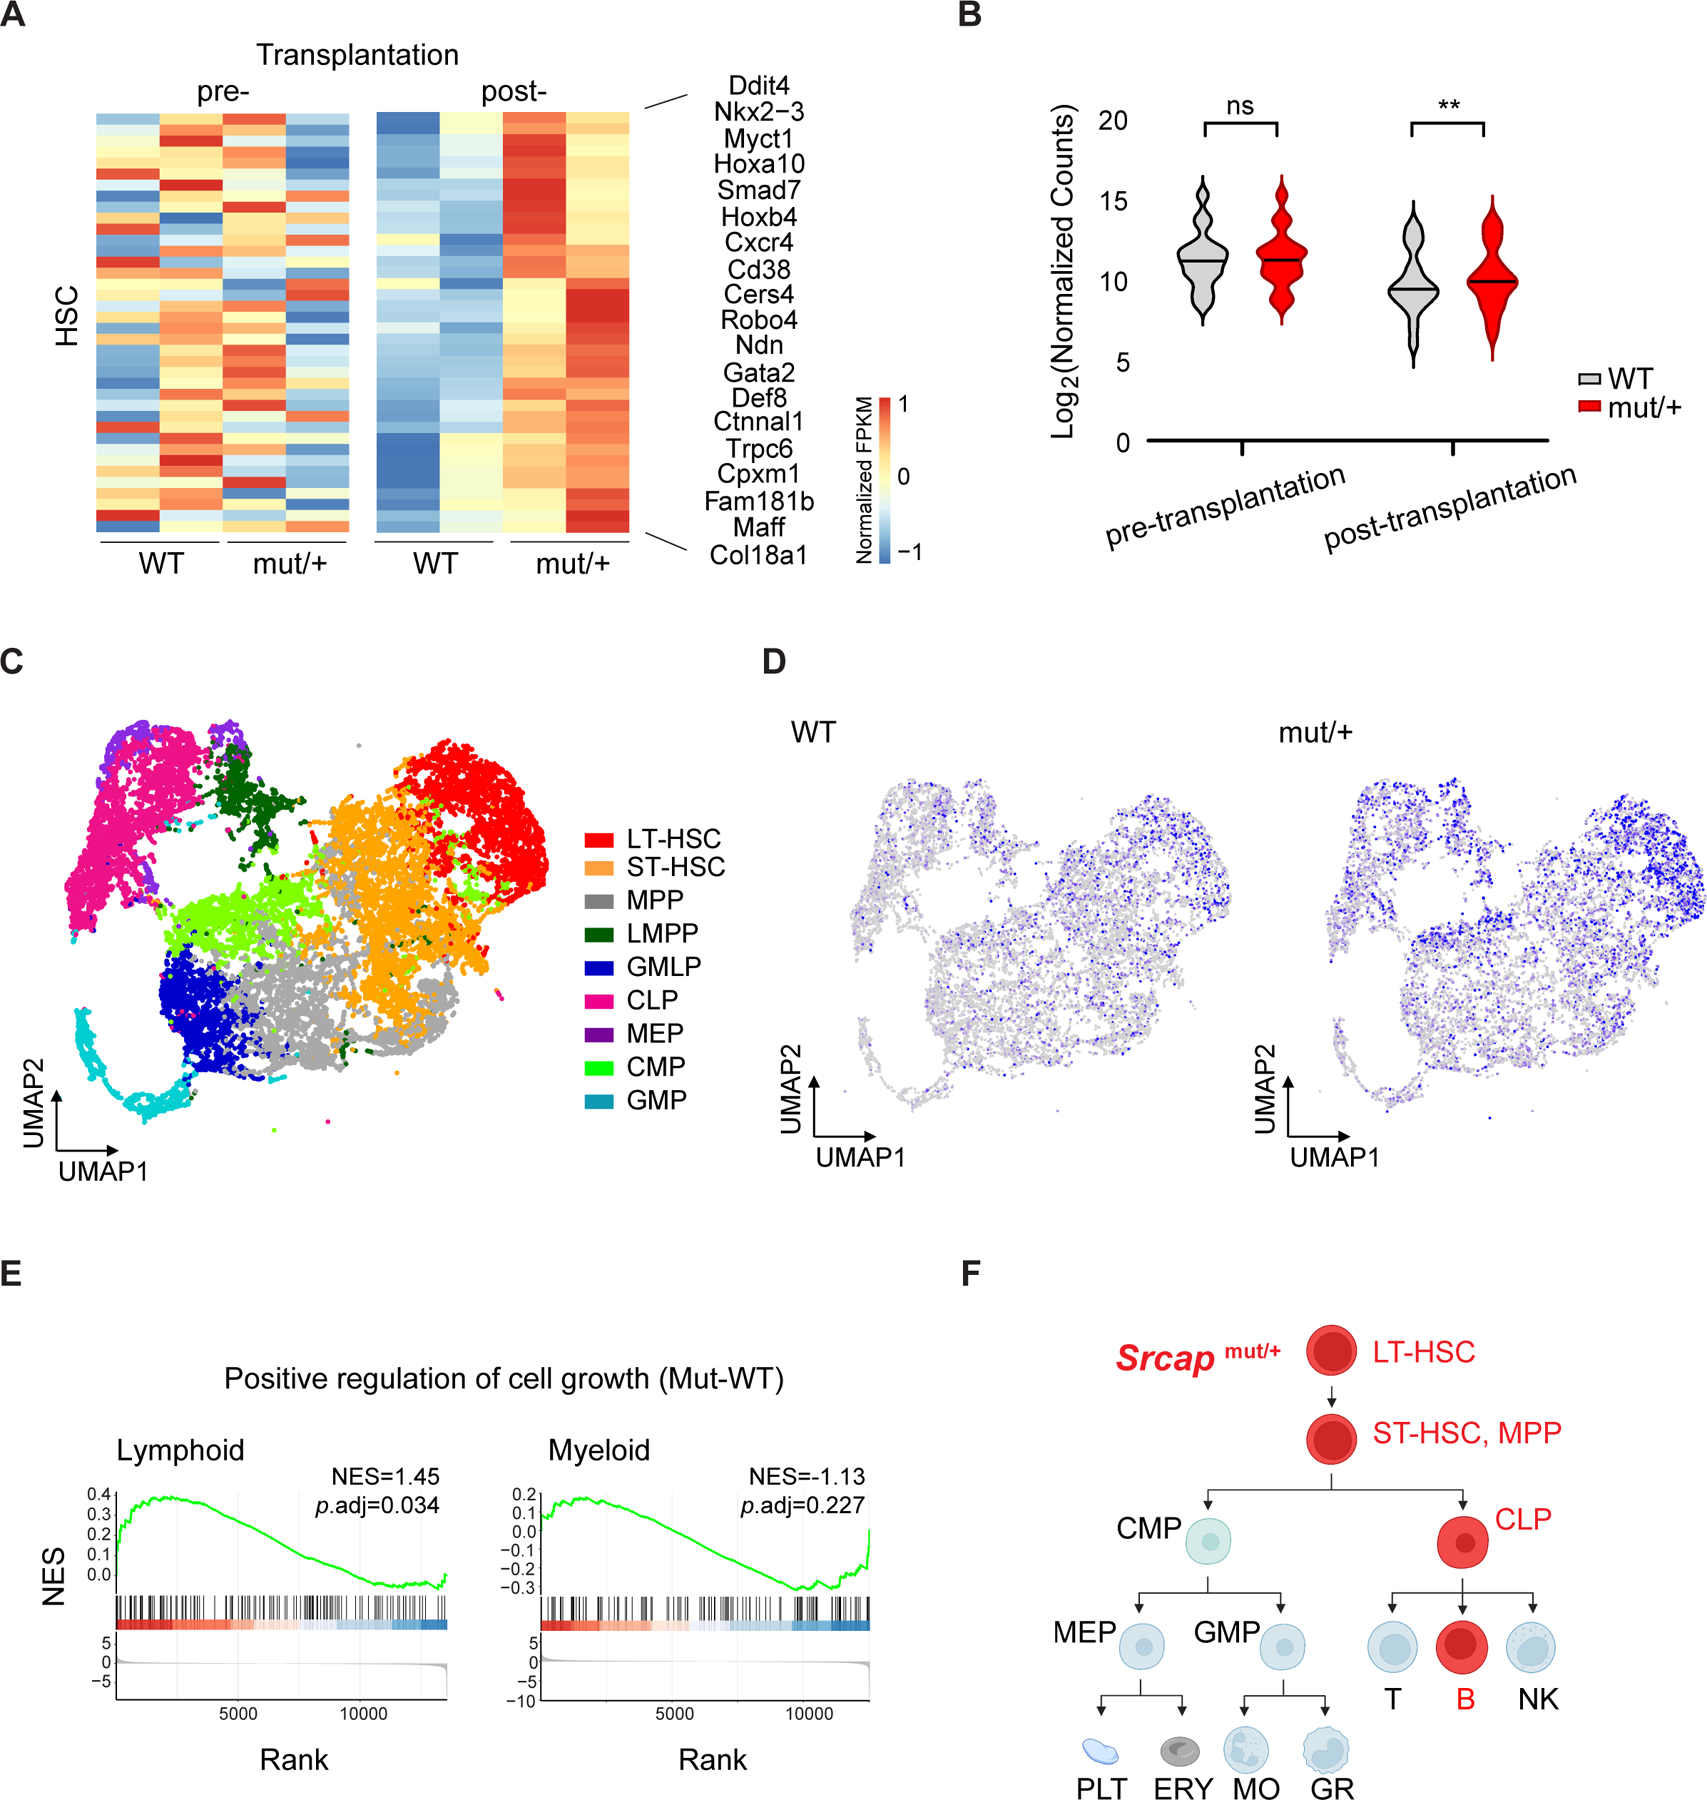
Somatic mutations accumulate in all cells with age and can confer a selective advantage, leading to clonal expansion over time. In hematopoietic cells, mutations in a subset of genes regulating DNA repair or epigenetics frequently lead to clonal hematopoiesis (CH). Here, we describe the context and mechanisms that lead to enrichment of hematopoietic stem cells (HSCs) with mutations in SRCAP, which encodes a chromatin remodeler that also influences DNA repair. We show that SRCAP mutations confer a selective advantage in human cells and in mice upon treatment with the anthracycline-class chemotherapeutic doxorubicin and bone marrow transplantation. Furthermore, Srcap mutations lead to a lymphoid-biased expansion, driven by loss of SRCAP-regulated H2A.Z deposition and increased DNA repair. Altogether, we demonstrate that SRCAP operates at the intersection of multiple pathways in stem and progenitor cells, offering a new perspective on the functional impact of genetic variants that promote stem cell competition in the hematopoietic system.

Keywords: DNA damage; H2A.Z; SRCAP; chromatin remodeling; clonal hematopoiesis; hematopoietic stem cells; lymphoid.


Conflict of interest statement

Declaration of interests A.S.S. receives consulting fees from Novartis and Roche. P.N. receives research grants from Allelica, Apple, Amgen, Boston Scientific, Genentech/Roche, and Novartis; receives personal fees from Allelica, Apple, AstraZeneca, Blackstone Life Sciences, Foresite Labs, Genentech/Roche, GV, HeartFlow, Magnet Biomedicine, and Novartis; has scientific advisory board membership in Esperion Therapeutics, Preciseli, and TenSixteen Bio; is a scientific co-founder of TenSixteen Bio; has equity in Preciseli and TenSixteen Bio; and has spousal employment at Vertex Pharmaceuticals—all unrelated to the present work. EpiCypher is a commercial developer and supplier of reagents and platforms used in this study. S.P. is employed by (and owns shares in) New England Biolabs. B.J.V. and M.-C.K. are employed by (and own shares in) EpiCypher. M.-C.K. is a board member of EpiCypher.

Figures

Figure1.
Figure1.. CH-associated SRCAP mutations are enriched following exposure to genotoxic agents
(A) Characteristics of 367 individuals with SRCAP mutations. The patient cohort, disease type, number of cases with SRCAP mutations, and tissue sequenced are indicated. The MGB and UK Biobanks primarily include individuals without a known cancer diagnosis. (B) Prevalence of SRCAP mutations in the UK Biobank. Males, n=46; females, n=95. Statistical significance determined by a multivariable logistic regression model adjusting for age and ever-smoked status. (C) Frequency of mutations in recurrent CH genes in chemo-exposed (n=154) or a similar group of chemo-naïve patients (n=91). Cohorts were sequenced with the same NGS panel and have similar median age (63 vs 65 years). VAF threshold 0.01. Statistical significance determined by one-tailed t-test for the relative difference in proportions. (D) Distribution of SRCAP mutations (n=367). Known functional domains and corresponding amino acids are indicated. The SRCAP CH-enriched region is labeled in red. The number of individuals with each mutation is indicated in the lollipops. (E) Structure of the SRCAP complex (PDB 6IGM). SRCAP is highlighted in magenta with the SRCAP CH-enriched region in (D) labeled in red. Other proteins in the complex include RUVBL1 (light gray), RUVBL2 (dark gray), and ARP6 (Blue). See also Table S1 and Figure S1.
Figure 2.
Figure 2.. SRCAPmut/+ cells exhibit enhanced DDR in vitro following genotoxic stress
(A) Dose-response with doxorubicin in WT and SRCAPmut/+ MOLM-13 cells. Cell viability values were normalized to baseline (n=3). Statistical significance was determined by a non-linear regression modeling comparing LogIC50. (B) Annexin V/7-AAD apoptosis with 120 nM (IC50) doxorubicin for 48 hr (n=4) and (C) BrdU/7-AAD cell cycle analysis with 100 nM (IC60) doxorubicin for 24 hr of WT and SRCAPmut/+ MOLM-13 cells. (D) In vitro competition of WT (GFP+) and SRCAPmut/+ (GFP) MOLM-13 cells with 60 nM (IC75) doxorubicin or DMSO. Left: proportion of WT and SRCAPmut/+ cells measured by flow cytometry on indicated days (n=4). Right: representative flow plots. Data points are normalized to Day 0. (E) WT and Srcapmut/+ mouse embryonic fibroblasts (MEFs) cells treated with 200 nM (IC50) doxorubicin for 24 hr followed by western blot analysis probing with anti-SRCAP, anti-FLAG and GAPDH. Endogenous SRCAP WT (3271 a.a.) and mutant (1963 a.a.) copies are highlighted with arrows. (F) Top: schematic of the homologous recombination (HR) or non-homologous end joining (NHEJ) cassettes in U2OS cells. Gene-editing was performed on cells with integrated cassettes to generate isogenic WT and mutant clones. I-SceI digestion sites are shown in solid bars and GFP expression in green. Bottom: DNA repair via HR or NHEJ measured as percentages of GFP-positive cells in WT or SRCAPmut/+ cells after I-SceI digestion (n=5) along with non-digested controls. (G) Relative RNA expression levels of WT and SRCAPmut/+ human MOLM-13 cells lines with or without doxorubicin (120 nM) for 24 hr. (H) In vitro competition of WT (GFP+) and SRCAPmut/+ (GFP) MOLM-13 cells in the presence of 60 nM doxorubicin and 2 nM PARP inhibitor (Pamiparib). Proportion of WT and SRCAPmut/+ cells measured by flow cytometry (n=3). All data points are normalized to Day 0. Statistical significance was determined by unpaired two-tailed t-test (with Welch correction). All data represent mean ± SEM. See also Figure S2.
Figure 3.
Figure 3.. Srcap mutation leads to HSC expansion and lymphoid-biased hematopoiesis
(A) Murine competitive transplantation workflow. Whole bone marrow (WBM) was harvested from donor CD45.2 Srcapmut/+ and CD45.1 WT (blue) mice, mixed at a 10:90 ratio, and transplanted to lethally irradiated CD45.1 recipients. Mice were bled every 4 weeks to analyze the contribution of test cells. A parallel transplant competed WT (CD45.2) against WT (CD45.1) cells serves as the WT:WT control cohort. (B) Test cell (CD45.2) chimerism in the peripheral blood of recipients in (A) (n=60). Srcapmut/+ cohort is depicted in red and the parallel WT:WT control cohort in gray. (C) Representative flow plots depicting the gating strategy for HSPC and HSC. (D-G) Recipient mice in (B) were sacrificed at 20 weeks post-transplantation, and the contributions of test cells were assessed in (D) WBM (n=18), HSPC (n=10), and HSC populations (n=10), (E) common lymphoid progenitors (CLP) (n=10), (F) myeloid, B-cell, T-cell lineages in peripheral blood (n=58), and (G) spleen (n=14) and thymus (n=14). The Srcapmut/+ cohort is indicated in red, and the parallel WT:WT cohort in gray. Statistical significance was determined by unpaired two-tailed t-test (with Welch correction). All data represent mean ± SEM with individual values. See also Figure S3 and Table S3.
Figure 4.
Figure 4.. Transcriptomic regulation of Srcap mutant lymphoid-biased expansion
(A) Relative gene expression from RNA-sequencing of HSPCs before and after competitive transplantation as in Figure 3A. Test cells (CD45.2) were isolated from the Srcapmut/+:WT and the WT:WT cohorts. The gene set displayed includes genes highly expressed in HSCs (Immunological Genome Project). Statistical significance determined by DESeq2 with duplicates. (B) Normalized read counts assigned to genes (n=36). Statistical significance determined by Mann-Whitney U-test. (C) Single-cell RNA-seq of HSPCs 20 weeks after competitive. UMAP clustering colored by cell types: long-term HSCs (LT-HSCs), short-term HSCs (ST-HSCs), multipotent progenitors (MPPs), lymphoid-primed multipotent progenitors (LMPPs), granulocyte/monocyte/lymphoid progenitors (GMLPs), common lymphoid progenitors (CLPs), megakaryocyte-erythrocyte progenitors (MEPs), common myeloid progenitors (CMPs), and granulocyte-macrophage progenitors (GMPs). (D) Single-cell RNA-seq UMAP colored by the Srcapmut/+ signature. Gene signature scores are extracted based on top differentially expressed genes (p<0.05) in the lymphoid clusters determined by Mann-Whitney U statistics. The color is scaled to maximum score in blue and minimum score in gray. Feature plots separated by genotype are shown. (E) Gene set enrichment analysis (GSEA) of Srcapmut/+ lymphoid and myeloid clusters compared to WT counterparts for the gene set ‘positive regulation of cell growth’ (GO:0045787). Normalized enrichment score (NES) and adjusted p-value are indicated. (F) Depiction of the cell populations (red) affected by Srcapmut/+ mutation in our mouse model. See also Figure S4.
Figure 5.
Figure 5.. Doxorubicin and transplantation are stressors promoting Srcapmut/+ advantage
(A) Schematic to study doxorubicin and transplantation as cellular stressors. Doxorubicin: mice were intraperitoneally injected with one dose of 10 mg/kg doxorubicin, and bone marrow was harvested after 12 hr. Transplantation: Srcapmut/+ or WT cells were transplanted non-competitively into lethally irradiated recipients and then isolated from bone marrow after 2 weeks followed by enrichment and/or sorting for HSPCs. (B) GSEA plot of Srcapmut/+ HSPCs after doxorubicin or transplantation. Red and blue bars indicate significantly up- and down-regulated pathways. Normalized enrichment score (NES) and adjusted p-value < 0.05 are indicated. (C-D) Relative gene expression from RNA-sequencing of HSPCs at baseline or after stress showing normalized read counts of (C) the gene set “positive regulation of DNA repair” (GO: GO:0045739) (D) genes typically enriched in HSC. Statistical significance determined by DESeq2 with duplicates. (E-F) HSC-enriched bone marrow cells with stress were used for (E) comet assay showing the amount of DNA damage (left: representative comet microscopy image; right: quantification of tail moment) and (F) γH2A.X foci analysis (left: representative immunofluorescence microscopy images; right: number of γH2A.X foci per cell). Statistical significance was determined by Mann-Whitney U-test. Data represent mean ± 95% confidence interval (n=256 each group). (G)Percentage of γH2A.X-positive WT or Srcapmut/+ HSPCs with doxorubicin (n=4) or after transplantation (n=5). Statistical significance was determined by unpaired two-tailed t-test (with Welch correction). Data represent mean ± SEM. (H) Relative gene expression from RNA-sequencing of bone marrow-derived B- and T-cells at baseline and after stress showing normalized read counts of genes in the gene set “positive regulation of DNA repair”. Statistical significance determined by DESeq2 with duplicates. See also Figure S5.
Figure 6.
Figure 6.. Decreased chromatin remodeling in Srcapmut/+ stem cells after stress
(A) Venn diagram of TSS-promoter peaks from ATAC-sequencing and CUT&RUN for SRCAP and H2A.Z of WT HSPCs after 12 weeks of competitive transplantation. Numbers of overlapping peaks are indicated. (B) Multiple Em for Motif Elicitation (MEME) analysis of SRCAP localization at the TSS-promoter. Top two motifs and E-value are shown. (C) Enrichment of SRCAP and H2A.Z at TSS-promoter before and after competitive transplantation. Enrichment at the clustered regions based on high and low SRCAP abundance is shown. (D) Average density of mapped reads (left) and normalized read count (right) of HSPCs were before or after 12 weeks of competitive transplantation. SRCAP and H2A.Z signals centered to TSS of genes in the gene set “positive regulation of DNA repair” (GO: GO:0045739). Statistical significance determined by Mann-Whitney U-test. Mean and p-value are shown. (E) Multi-omics integration of normalized RNA-seq read counts of CD45.2 HSPCs 12 weeks after transplantation. H2A.Z-high and not H2A.Z-bound genes are determined by CUT&RUN as in (C). (F) Integrative Genomic Viewer (IGV) browser tracks for SRCAP (blue) and H2A.Z (red) enrichment at Cbx8 (mm10, chr11:119,036,305–119,040,969) in the HSPCs before or after competitive transplantation. H3K27me3 and mIgG enrichment tracks for each condition are shown as positive and negative controls. (G) Diagram depicting the epigenetic and transcriptomic regulation of Srcapmut/+ cells with exposure to stressors. The circular arrows denote stem cell survival under stress and proliferation. See also Figure S6.

References

    1. Cagan A, Baez-Ortega A, Brzozowska N, Abascal F, Coorens THH, Sanders MA, Lawson ARJ, Harvey LMR, Bhosle S, Jones D, et al. (2022). Somatic mutation rates scale with lifespan across mammals. Nature 604, 517–524. 10.1038/s41586-022-04618-z. - DOI - PMC - PubMed
    1. Martincorena I (2019). Somatic mutation and clonal expansions in human tissues. Genome Med 11, 35. 10.1186/s13073-019-0648-4. - DOI - PMC - PubMed
    1. Mitchell E, Spencer Chapman M, Williams N, Dawson KJ, Mende N, Calderbank EF, Jung H, Mitchell T, Coorens THH, Spencer DH, et al. (2022). Clonal dynamics of haematopoiesis across the human lifespan. Nature 606, 343–350. 10.1038/s41586-022-04786-y. - DOI - PMC - PubMed
    1. Jaiswal S, and Ebert BL (2019). Clonal hematopoiesis in human aging and disease. Science 366. 10.1126/science.aan4673. - DOI - PMC - PubMed
    1. Young AL, Challen GA, Birmann BM, and Druley TE (2016). Clonal haematopoiesis harbouring AML-associated mutations is ubiquitous in healthy adults. Nat Commun 7, 12484. 10.1038/ncomms12484. - DOI - PMC - PubMed

Publication types