. 2023 Oct 26;186(22):4868-4884.e12.
doi: 10.1016/j.cell.2023.09.012. Epub 2023 Oct 19.

Liquid-biopsy proteomics combined with AI identifies cellular drivers of eye aging and disease in vivo

Affiliations

Liquid-biopsy proteomics combined with AI identifies cellular drivers of eye aging and disease in vivo

Julian Wolf et al. Cell. .

Abstract

Single-cell analysis in living humans is essential for understanding disease mechanisms, but it is impractical in non-regenerative organs, such as the eye and brain, because tissue biopsies would cause serious damage. We resolve this problem by integrating proteomics of liquid biopsies with single-cell transcriptomics from all known ocular cell types to trace the cellular origin of 5,953 proteins detected in the aqueous humor. We identified hundreds of cell-specific protein markers, including for individual retinal cell types. Surprisingly, our results reveal that retinal degeneration occurs in Parkinson's disease, and the cells driving diabetic retinopathy switch with disease stage. Finally, we developed artificial intelligence (AI) models to assess individual cellular aging and found that many eye diseases not associated with chronological age undergo accelerated molecular aging of disease-specific cell types. Our approach, which can be applied to other organ systems, has the potential to transform molecular diagnostics and prognostics while uncovering new cellular disease and aging mechanisms.

Keywords: Parkinson’s disease; aging; artificial intelligence; diabetic retinopathy; liquid biopsy; longevity; proteomics; retinitis pigmentosa; single-cell analysis; uveitis.


Conflict of interest statement

Declaration of interests V.B.M. has received speaker fees from Somalogic, Inc.

Figures

Figure 1:
Figure 1:. TEMPO multi-omics approach determines the cellular origin of liquid biopsy proteins.
(A) Aqueous humor (AH) and vitreous liquid biopsies were obtained from patients undergoing eye surgery. (B) The proteomic profile was analyzed using an aptamer-based assay. (C) To determine which cells specifically expressed the corresponding genes of the identified proteins, scRNA-seq data from healthy ocular and extraocular cell types were integrated with the proteomics data. (D) AH and vitreous proteins are represented by dots in the anterior or posterior chamber of the eye; dot color represents each protein’s cellular origin. RPE: retinal pigment epithelium. See also Table S5.
Figure 2:
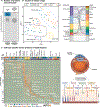
Figure 2:. Cell type-specific marker proteins in liquid biopsies.
(A) Number of detected proteins and corresponding genes expressed in ocular and extra-ocular tissues. (B) Unsupervised clustering of all cell types based on the gene expression profile encoding for all detected proteins (left panel). Each dot represents one cell type. The color encodes for tissue types. Clusters of cell types are labeled. The right panel shows the number of proteins from each cluster and the association to tissue types. Specific expression was defined as: highest z-score (>3) and >10th percentile of all expressed genes in this cell type. For spleen and liver, only genes encoding for secreted and extracellular proteins were considered. (C) Cell type-specific markers in liquid biopsies (criteria from (B) plus: mean gene expression > maximal gene expression in any other cell type and >2 * maximal mean gene expression in any cell cluster, and protein level >10th percentile in AH and vitreous). The number of cell type-specific proteins is shown in parenthesis. Bile duct tissue is the negative control (neg. ctrl). The cartoon on the right illustrates that retinal cell type-specific proteins can be detected in AH liquid biopsies. Proteins are shown as dots, the color corresponding to their retinal cell type. C: corneal, CB: ciliary body, RPE: retinal pigment epithelium, TM: trabecular meshwork, t-SNE: t-distributed stochastic neighbor embedding. See also Figure S1 and Table S1.
Figure 3:
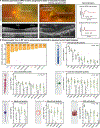
Figure 3:. Tissue disease phenotypes can be molecularly monitored by locally enriched fluid biopsy.
(A) Clinical phenotype of retinitis pigmentosa (RP). Fundus photography, retinal cross sectioning using optical coherence tomography (OCT), and electroretinogram (ERG) from a healthy patient and from a patient with RP. (B) Aqueous humor (AH) liquid biopsies were obtained from 7 patients with RP and 19 control patients. The bar graph shows the cell type-specific marker proteins which were significantly decreased in RP compared to control AH (log2FC <−2 and adjusted p-value <0.05) for the top 10 affected cell types. The absolute numbers are shown in the graph. The boxplots visualize protein levels of the top 10 marker proteins for each of the indicated cell types. Each point represents one sample. RFU: relative fluorescence unit, RPE: retinal pigment epithelium. See also Table S2.
Figure 4:
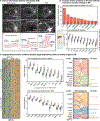
Figure 4:. The molecular and cellular phenotypes differ between disease stages.
(A) Clinical phenotype of diabetic retinopathy (DR). (B) Aqueous humor (AH) liquid biopsies were obtained from 10 patients with proliferative diabetic retinopathy (PDR), 5 patients with non-proliferative diabetic retinopathy (NPDR), 10 patients with diabetes mellitus without DR (DM w/o DR), and 19 patients with cataracts serving as controls. The bar graph shows the cell type-specific marker proteins which were significantly increased in DR vs. control AH (log2FC >2 and adjusted p-value <0.05) for the top 10 changed cell types. The absolute numbers are shown in the graph. The boxplots below visualize protein levels of the top 10 liver proteins in AH. Each point represents one sample. (C): The levels of significantly increased angiogenic proteins in DR AH vs. control are visualized in the heatmap. Each row represents one protein, each column represents one sample. The boxplots in the middle column visualize the levels of the top 10 angiogenic proteins in each group. Each point represents one sample. Sankey plots on the right show the cellular origin of the top 10 proteins for each group. A cell type was considered as the origin of a protein if the corresponding gene expression was at least 2 standard deviations above the mean expression in all cell types. RFU: relative fluorescence unit. See also Table S3.
Figure 5:
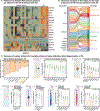
Figure 5:. Eye fluids reflect phenotypic molecules of Parkinson’s disease.
(A) Aqueous humor (AH) liquid biopsies were obtained from 5 patients with Parkinson’s disease (PD) and 19 control patients. Heatmap visualizing the AH protein level of PD-relevant proteins in PD vs. control patients. Each row represents one protein and each column represents one sample. (B) Sankey plot showing the cellular origin of the increased PD-relevant proteins. A cell type was considered as origin of a protein if the corresponding gene expression was at least 2 standard deviations above the mean expression in all cell types. (C) Bargraph showing the cell type-specific marker proteins which were significantly decreased in PD AH vs. control AH (log2FC <−2 and adjusted p-value <0.05) for the top 10 changed cell types. The absolute numbers are shown in the graph. The boxplots visualize AH protein levels of the top 10 proteins from the indicated cell types. Each point represents one sample. RFU: relative fluorescence unit. See also Figure S3.
Figure 6:
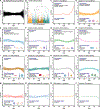
Figure 6:. The molecular age of the eye follows predominantly non-linear trajectories.
(A) 46 aqueous humor (AH) liquid biopsies were obtained from patients undergoing cataract surgery with otherwise healthy eyes. AH protein levels were z-scored, and age trajectories of 6,313 AH proteins were estimated by locally estimated scatterplot smoothing (LOESS). Each line represents one protein. (B) Unsupervised clustering grouped AH proteins with similar trajectories. (C-L) Protein trajectories of the 10 identified clusters. Each line represents one protein; the thicker lines represent the average trajectory for each cluster. The most significantly enriched pathways and the top cell type origins are shown for each cluster. (M-P) Protein trajectories for molecules known to be involved in aging associated processes. See also Figure S4.
Figure 7:
Figure 7:. AI models predict the global and cellular molecular age of the eye.
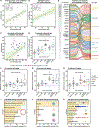
(A) Artificial intelligence (AI) model prediction of the patient’s age based on aqueous humor (AH) liquid biopsy proteomics in control patients (training cohort). Each point represents one sample. (B) Prediction of the patient’s age in an independent validation cohort of 19 control patients. The final model was built on the 26 features (“age proteins”) which were identified in at least 3 of the 10 cross validation models in the training cohort. (C-D) Prediction of the molecular age in patients with diabetic retinopathy (DR) (C-D), uveitis (D), and retinitis pigmentosa (RP) (D). The boxplots in (D) visualize the molecular age difference in years relative to control samples. A positive value means that the predicted molecular age was higher than the chronological age. (E) Sankey plot showing the cellular origin of the age proteins. A cell type was considered as origin of a protein if the corresponding gene expression was at least 2 standard deviations above the mean expression in all cell types. Proteins are ordered according to the feature importance in the final AI model. (F-H) Three AI models were developed to predict the vascular, immune, and retinal age of the eye. These models were based on proteins specific to the respective cell types (Figure S5). (I-K) Bar plots showing the cellular origin of the proteins identified by the cell type-specific AI models. DM w/o DR: diabetes mellitus without DR, NPDR: non-proliferative DR, PDR: proliferative DR, p-values: *<0.05, **<0.01, ***<0.001, ns: not significant, RMSE: root-mean-square error. See also Figure S5 and Table S4.

References

    1. Dowden H, and Munro J. (2019). Trends in clinical success rates and therapeutic focus. Nat Rev Drug Discov 18, 495–496. 10.1038/d41573-019-00074-z. - DOI - PubMed
    1. Seok J, Warren HS, Cuenca AG, Mindrinos MN, Baker HV, Xu W, Richards DR, McDonald-Smith GP, Gao H, Hennessy L, et al. (2013). Genomic responses in mouse models poorly mimic human inflammatory diseases. Proc Natl Acad Sci U S A 110, 3507–3512. 10.1073/pnas.1222878110. - DOI - PMC - PubMed
    1. Schwab IR (2018). The evolution of eyes: major steps. The Keeler lecture 2017: centenary of Keeler Ltd. Eye (Lond) 32, 302–313. 10.1038/eye.2017.226. - DOI - PMC - PubMed
    1. Zheng Y, Ley SH, and Hu FB (2018). Global aetiology and epidemiology of type 2 diabetes mellitus and its complications. Nat Rev Endocrinol 14, 88–98. 10.1038/nrendo.2017.151. - DOI - PubMed
    1. Ascherio A, and Schwarzschild MA (2016). The epidemiology of Parkinson’s disease: risk factors and prevention. Lancet Neurol 15, 1257–1272. 10.1016/S1474-4422(16)30230-7. - DOI - PubMed

Publication types

LinkOut - more resources