. 2023 Nov 10;4(11):761-777.e8.
doi: 10.1016/j.medj.2023.09.002. Epub 2023 Oct 19.

Shiga toxin targets the podocyte causing hemolytic uremic syndrome through endothelial complement activation

Affiliations

Shiga toxin targets the podocyte causing hemolytic uremic syndrome through endothelial complement activation

Emily E Bowen et al. Med. .

Abstract

Background: Shiga toxin (Stx)-producing Escherichia coli hemolytic uremic syndrome (STEC-HUS) is the leading cause of acute kidney injury in children, with an associated mortality of up to 5%. The mechanisms underlying STEC-HUS and why the glomerular microvasculature is so susceptible to injury following systemic Stx infection are unclear.

Methods: Transgenic mice were engineered to express the Stx receptor (Gb3) exclusively in their kidney podocytes (Pod-Gb3) and challenged with systemic Stx. Human glomerular cell models and kidney biopsies from patients with STEC-HUS were also studied.

Findings: Stx-challenged Pod-Gb3 mice developed STEC-HUS. This was mediated by a reduction in podocyte vascular endothelial growth factor A (VEGF-A), which led to loss of glomerular endothelial cell (GEnC) glycocalyx, a reduction in GEnC inhibitory complement factor H binding, and local activation of the complement pathway. Early therapeutic inhibition of the terminal complement pathway with a C5 inhibitor rescued this podocyte-driven, Stx-induced HUS phenotype.

Conclusions: This study potentially explains why systemic Stx exposure targets the glomerulus and supports the early use of terminal complement pathway inhibition in this devastating disease.

Funding: This work was supported by the UK Medical Research Council (MRC) (grant nos. G0901987 and MR/K010492/1) and Kidney Research UK (grant nos. TF_007_20151127, RP42/2012, and SP/FSGS1/2013). The Mary Lyon Center is part of the MRC Harwell Institute and is funded by the MRC (A410).

Keywords: Pre-clinical research; pre-clinical research.


Conflict of interest statement

Declaration of interests The authors declare no competing interests.

Figures
None
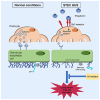
Bowen et al. explore the mechanisms underpinning the leading cause of kidney failure in children, Shiga-toxin-producing Escherichia coli hemolytic uremic syndrome (STEC-HUS). They discover that the podocyte is a key cell in this disease and that intravascular complement activation occurs early. Therapeutically blocking complement activation early prevents HUS developing.
Figure 1
Figure 1. Shiga toxin causes HUS via the podocyte Gb3 receptor
(A) PodrtTA-Tet-O-Gb3 Gb3 null (Pod Gb3 mice n = 28) and aged-matched PodrtTA-Tet-O-WT Gb3 null (control mice n = 25) were given 14 days of oral doxycycline to induce podocyte Gb3 expression, followed by 10 ng/g intraperitoneal (i.p.) Shiga toxin (Stx) inoculation. Mice were electively terminated at intervals of day 4, 8, 10, 12, 16, and 24 post-inoculations. (B) Immunofluorescence analysis for Gb3 expression in PodrtTA-Tet-O-WT Gb3 null (Gb3 null) control mice and PodrtTA-Tet-O-Gb3 Gb3 null (Pod Gb3) mice given 14 days of doxycycline to activate transcription of A4GALT (Gb3 synthase). Gb3 (green), nephrin (red), and DAPI nuclear stain (blue). Representative images for n = 3 mice for each genotype. Scale bar, 25 μm. (C) Blood samples were taken at the time of terminal anesthesia for platelet count, hemoglobin, and urea. Day 10 post-i.p. Stx shown. Unpaired t test p values: platelets **p < 0.01 (Pod Gb3 n = 5, GB3 null n = 7), hemoglobin *p < 0.05 (Pod Gb3 n = 5, GB3 null n = 6), and urea **p < 0.01 (Pod Gb3 n = 8, GB3 null n = 6). Data are expressed as mean ± SEM. (D) Representative blood films from Pod Gb3 (n = 7) and GB3 null control mice (n = 5). Red arrow indicates fragmented red cell. Scale bar 75 μm. (E) Day 10 post-i.p. Stx glomerular immunofluorescence analysis for fibrinogen (green) in Pod Gb3 mice and Gb3 null controls. Scale bar, 25 μm. Graph shows fold change in corrected total glomerular fluorescence (CTGF) intensity calculated using ImageJ analysis for fibrinogen deposition in the glomerulus. Pod Gb3 n = 3, Gb3 null n = 3 with 30 glomeruli per mouse analyzed. Unpaired t test p value: ****p < 0.0001. Data are expressed as mean ± SEM. (F) Transmission electron microscopy (TEM) from Pod Gb3 and GB3 null mice at day 10 post-i.p. Stx. T: thrombus in glomerular capillary loop; arrows indicate subendothelial accumulation of electrolucent flocculent material characteristic of TMA. C: capillary loop with red blood cell (R). Images representative of n = 3 for each genotype. Scale bar, 2 μm. (G) No statistically significant difference in podocyte foot process width or slit diaphragm (SD) width between the two groups. n = 3 for each genotype, with 3 glomeruli analyzed per mouse and 3 capillaries per glomeruli. Data are expressed as mean ± SEM.
Figure 2
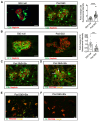
Figure 2. Stx binding to the podocyte Gb3 receptor causes complement deposition and a reduction in CFH binding on GEnC surfaces
(A) Day 10 post-i.p. Stx glomerular immunofluorescence analysis for C3b (green) with co-staining for nephrin (red) in Pod Gb3 and GB3 null control mice glomeruli. Scale bar, 25 μm. Corresponding graph shows fold change in CTGF intensity, which was calculated using ImageJ analysis for C3b in the glomerulus. Pod Gb3 n = 3, Gb3 null n = 3 with 30 glomeruli per mouse analyzed. Unpaired t test p value: ****p < 0.0001.Data are expressed as mean ± SEM. (B) CFH (green) with co-staining for nephrin (red) in Pod Gb3 and GB3 null mice glomeruli. Scale bar, 25 μm. Corresponding graph shows fold change in CTGF intensity, which was calculated using ImageJ analysis for complement factor H deposition in the glomerulus. Pod Gb3 n = 3, Gb3 null n = 3 with 30 glomeruli per mouse analyzed. Unpaired t test p value: ****p < 0.0001.Data are expressed as mean ± SEM. (C) Glomerular immunofluorescence for C3b (green) co-localized with podocyte marker nephrin (red) Pod Gb3+Stx mice. Scale bar, 25 μm. (D) Glomerular immunofluorescence for C3b (green) with endothelial marker PECAM (red) in Pod Gb3+Stx mice. Scale bar, 25 μm. (E) Glomerular immunofluorescence for C7 (green) co-localized with endothelial marker PECAM (red) in Pod Gb3+Stx mice. Scale bar, 25 μm. (F) Glomerular immunofluorescence for C9 (green) co-localized with endothelial marker PECAM (red) in Pod Gb3+Stx mice. Scale bar, 25 μm.
Figure 3
Figure 3. STEC-HUS leads to terminal complement activation in human kidney tissue
Representative images of light microscopy and C5b-9 immunohistochemically stained human kidney sections from a healthy control patient, a patient with STEC-HUS, patient with a VEGF inhibitor, and a patient with atypical HUS. Light microscopy periodic acid Schiff (PAS) confirmed typical TMA features in the patients with STEC-HUS, a VEGF inhibitor, and atypical HUS with mesangiolysis, endocapillary swelling, and proliferation with GBM duplication (top). C5b-9 staining (brown) was negative in the control cases but positive in all others (bottom). Scale bar, 50 μm. See Figure S3 for all STEC-HUS cases (n = 3).
Figure 4
Figure 4. STEC-HUS results in a reduction in podocyte VEGF-A production
(A) RNAscope in situ hybridization for VEGF-A mRNA in Pod Gb3 mice and GB3 null mice 10 days post-Stx inoculation. Representative images for n = 3 of each genotype. Scale bar, 50 μm. (B) Mean optical density (OD) for podocyte VEGF-A was calculated using the Quantitative Pathology and Bioimage Analysis program Qu Path in Pod Gb3 mice (n = 3) vs. controls (n = 3) at day 10 following i.p. Stx, with 15 glomeruli per mouse analyzed. Unpaired t test p value: **p < 0.01.Data are expressed as mean ± SEM.
Figure 5
Figure 5. Human podocyte and GEnC co-culture experiments demonstrate glomerular cell crosstalk
(A) Immunofluorescence images and corrected total cellular fluorescence (CTCF) intensity analysis of cell surface heparan sulfate (HS) expression in human conditionally immortalized GEnCs alone and co-cultured with podocytes. Scale bar, 50 μm. Unpaired t test p value: ***p < 0.001. Data are expressed as mean ± SEM. (B) Immunofluorescence images and CTCF analysis of complement factor H (CFH) expression in human conditionally immortalized GEnCs alone and co-cultured with podocytes. Scale bar, 50 μm. Unpaired t test p value: ***p < 0.01.Data are expressed as mean ± SEM. (C) Immunofluorescence images and CTCF analysis of cell surface HS expression in co-cultured GEnCs in media vs. co-cultured GEnCs where the podocyte transwell has been treated with 0.1 ng Stx for 15 min or co-cultured GEnCs directly treated with heparinase III 0.5 U/mL (as a heparan sulphate antibody negative control). DAPI staining in blue. Scale bar, 50 μm. One-way ANOVA with Tukey’s multiple comparison test p value ****p < 0.0001. Data are expressed as mean ± SEM. (D) Immunofluorescence images and CTCF analysis of CFH expression in co-cultured GEnCs in media vs. co-cultured GEnCs where the podocyte Transwell has been treated with 0.1 ng Stx for 15 min. DAPI staining in blue. Scale bar, 50 μm. Unpaired t test p value: **p < 0.01. Data are expressed as mean ± SEM. (E) Alexa Fluor 488-conjugated CFH binding on co-cultured GEnC surfaces was assessed by flow cytometry. Non-viable cells were excluded from analysis with Fixable Viability Dye eFluor 780. Data were normalized to media control and expressed as a fold change in mean fluorescence intensity following treatment of podocytes with neuraminidase (negative control) or 0.1 ng/mL Stx. n = 3 with each data point representing an n number. One-way ANOVA with Tukey’s post-test p values: *p < 0.05 and **p < 0.01.Data are expressed as mean ± SEM. (F) Immunofluorescence images and CTCF analysis of C3b (red) in co-cultured Transwell human GEnCs following podocyte treatment with either media (control), aCD59 and normal human serum (NHS) (positive control), or 0.1 ng/mL Stx. Scale bar, 50 μm. One-way ANOVA with Tukey’s multiple comparison test p value: ****p < 0.0001. Each data point on all graphs represents the average CTCF taken for each field of view, with at least 5 fields of view per condition and n = 4 experiments. Data are expressed as mean ± SEM. (G) Immunofluorescence images and CTCF analysis of C5b-9 (green) in co-cultured Transwell human GEnCs following podocyte treatment with either media (control), aCD59 and NHS (positive control), or 0.1 ng/mL Stx. Scale bar, 50 μm. One-way ANOVA with Tukey’s multiple comparison test p value: **p < 0.01. Each data point on all graphs represents the average CTCF taken for each field of view, with at least 5 fields of view per condition and n = 4 experiments. Data are expressed as mean ± SEM. (H) Immunofluorescence images of cell surface HS expression (red) and CFH (green) in co-cultured GEnCs treated with media (control), 100 ng/mL VEGF for 24 h, and 0.1 ng/mL Stx and 100 ng/mL VEGF (24 h pre-treatment) followed by 0.1 ng/mL Stx. Scale bar, 50 μm. CTFC analysis of cell surface HS and CFH levels also presented. One-way ANOVA with Tukey’s multiple comparison test p values: *p < 0.05 and **p < 0.01. Each data point on the graph represents the average CTCF taken for each field of view, with at least 5 fields of view per condition and n = 4 experiments. Data are expressed as mean ± SEM. (I) Immunofluorescence images of C3b (red) and C5b-9 (green) co-cultured GEnCs treated with media (control), 100 ng/mL VEGF for 24 h, and 0.1 ng/mL Stx and 100 ng/mL VEGF (24 h pretreatment) followed by 0.1 ng/mL Stx. Scale bar, 50 μm. CTFC analysis of C3b and C5b-9 expression also presented. One-way ANOVA with Tukey’s multiple comparison test p values: *p < 0.05, **p < 0.01, and ****p < 0.0001. Each data point on the graph represents the average CTCF taken for each field of view, with at least 5 fields of view per condition and n = 4 experiments. Data are expressed as mean ± SEM.
Figure 6
Figure 6. C5 inhibition rescues the Stx HUS phenotype
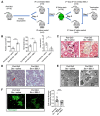
(A) PodrtTA-Tet-O-Gb3 Gb3 null (Pod Gb3 mice n = 10) were given 14 days of oral doxycycline to induce podocyte Gb3 expression. Following randomization, they received either i.p. C5 inhibitor BB5.1 (n = 5) or sterile saline (n = 5). After 24 h, all mice received 10 ng/g i.p. Stx2 and, 72 h later, a further dose of i.p. C5 inhibitor or saline. At day 7 post-i.p. Stx, all mice were electively terminated. (B) Blood samples were taken at the time of terminal anesthesia for platelet count, hemoglobin, and urea (Pod Gb3+Stx+saline n = 5 and Pod Gb3+Stx+C5 inhibitor n = 5). Unpaired t test p values: platelets ***p < 0.001, hemoglobin **p < 0.01, and urea *p < 0.05. Data are expressed as mean ± SEM. (C) Light microscopy Martius Scarlet Blue (MSB) trichrome stain in Pod Gb3 mice following i.p. Stx and either saline or C5 inhibitor. Fibrin: red, collagen: blue, erythrocytes: yellow. Fibrin thrombi indicated by black arrows. Scale bar, 25 μm. (D) Representative blood films from Pod Gb3 post-i.p. Stx and either saline (control group n = 5) or C5 inhibitor (n = 5). Red arrow indicates fragmented red cell. Scale bar, 75 μm. (E) TEMs from Pod Gb3 post-i.p. Stx and either saline (control group n = 5) or C5 inhibitor (n = 5). T: thrombus in glomerular capillary loop; arrows indicate subendothelial accumulation of electrolucent flocculent material characteristic of TMA. R: red blood cell in capillary loop. Scale bar, 5 μm. (F) Glomerular immunofluorescence analysis for fibrinogen (green) in Pod Gb3 mice post-i.p. Stx and either saline or C5 inhibitor. Scale bar, 25 μm. Fold change in CTGF intensity was calculated using ImageJ analysis for fibrinogen deposition in the glomerulus. Pod Gb3+Stx+saline n = 4, Pod Gb3+Stx+C5 inhibitor n = 4 with 15 glomeruli per mouse analyzed. Unpaired t test p value: ****p < 0.0001. Data are expressed as mean ± SEM.

References

    1. Keir L, Coward RJM. Advances in our understanding of the pathogenesis of glomerular thrombotic microangiopathy. Pediatr Nephrol. 2011;26:523–533. doi: 10.1007/s00467-010-1637-4. - DOI - PMC - PubMed
    1. Garg AX, Suri RS, Barrowman N, Rehman F, Matsell D, Rosas-Arellano MP, Salvadori M, Haynes RB, Clark WF. Long-term renal prognosis of diarrhea-associated hemolytic uremic syndrome: a systematic review, meta-analysis, and meta-regression. JAMA. 2003;290:1360–1370. - PubMed
    1. Timmermans SAMEG, van Paassen P. The Syndromes of Thrombotic Microangiopathy: A Critical Appraisal on Complement Dysregulation. J Clin Med. 2021;10:3034. doi: 10.3390/jcm10143034. - DOI - PMC - PubMed
    1. George JN, Nester CM. Syndromes of thrombotic microangiopathy. N Engl J Med. 2014;371:654–666. - PubMed
    1. Obrig TG, Karpman D. Shiga toxin pathogenesis: kidney complications and renal failure. Curr Top Microbiol Immunol. 2012;357:105–136. doi: 10.1007/82_2011_172. - DOI - PMC - PubMed

Publication types

MeSH terms

Substances

LinkOut - more resources