. 2023 Nov 13;41(11):1945-1962.e11.
doi: 10.1016/j.ccell.2023.09.012. Epub 2023 Oct 19.

Tumor-resident Lactobacillus iners confer chemoradiation resistance through lactate-induced metabolic rewiring

Affiliations

Tumor-resident Lactobacillus iners confer chemoradiation resistance through lactate-induced metabolic rewiring

Lauren E Colbert et al. Cancer Cell. .

Abstract

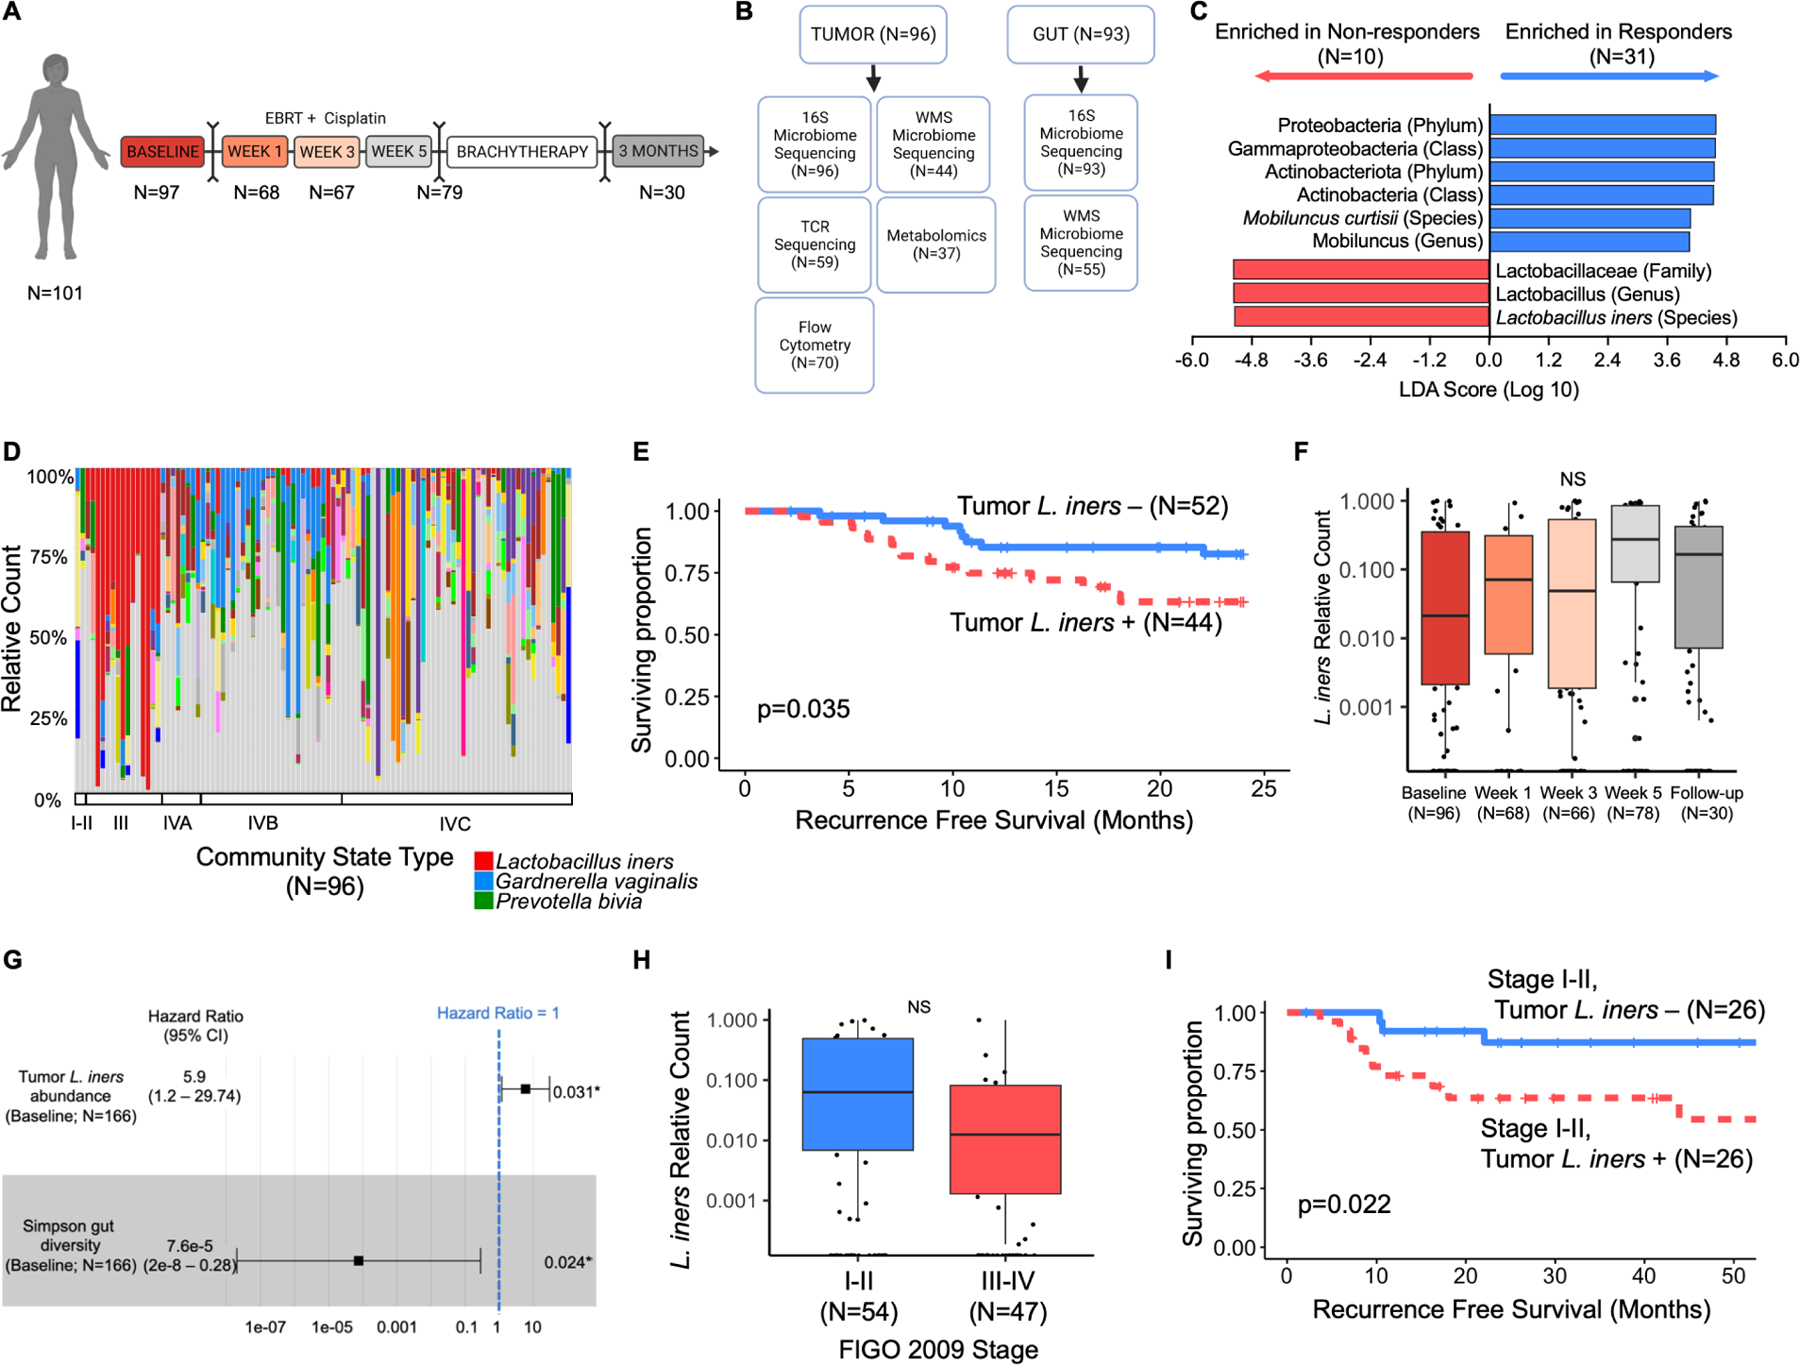
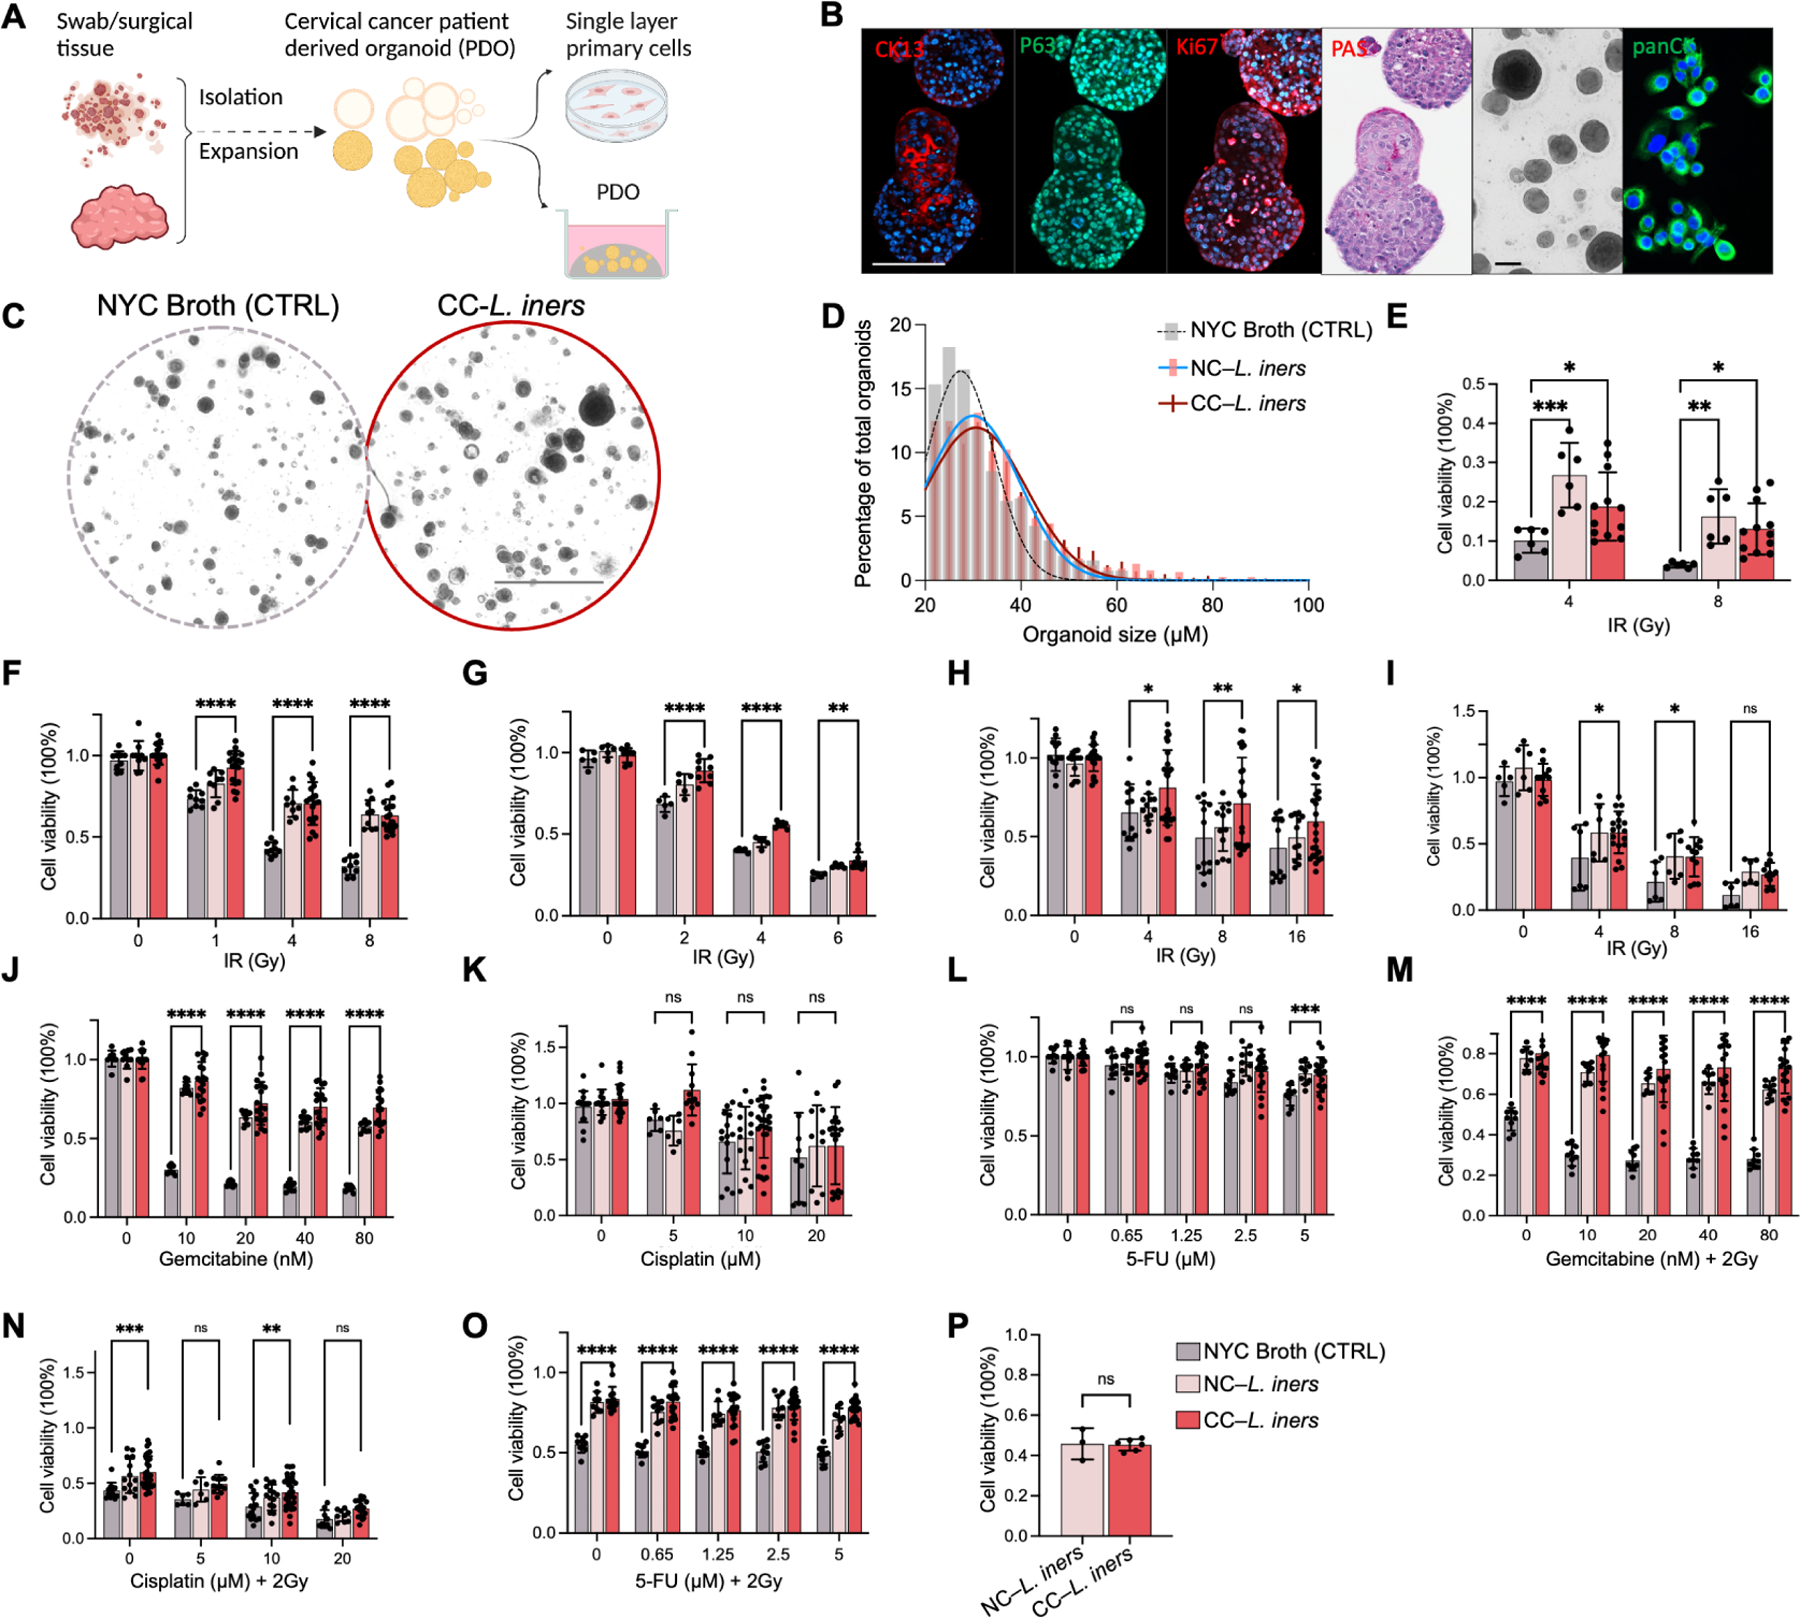
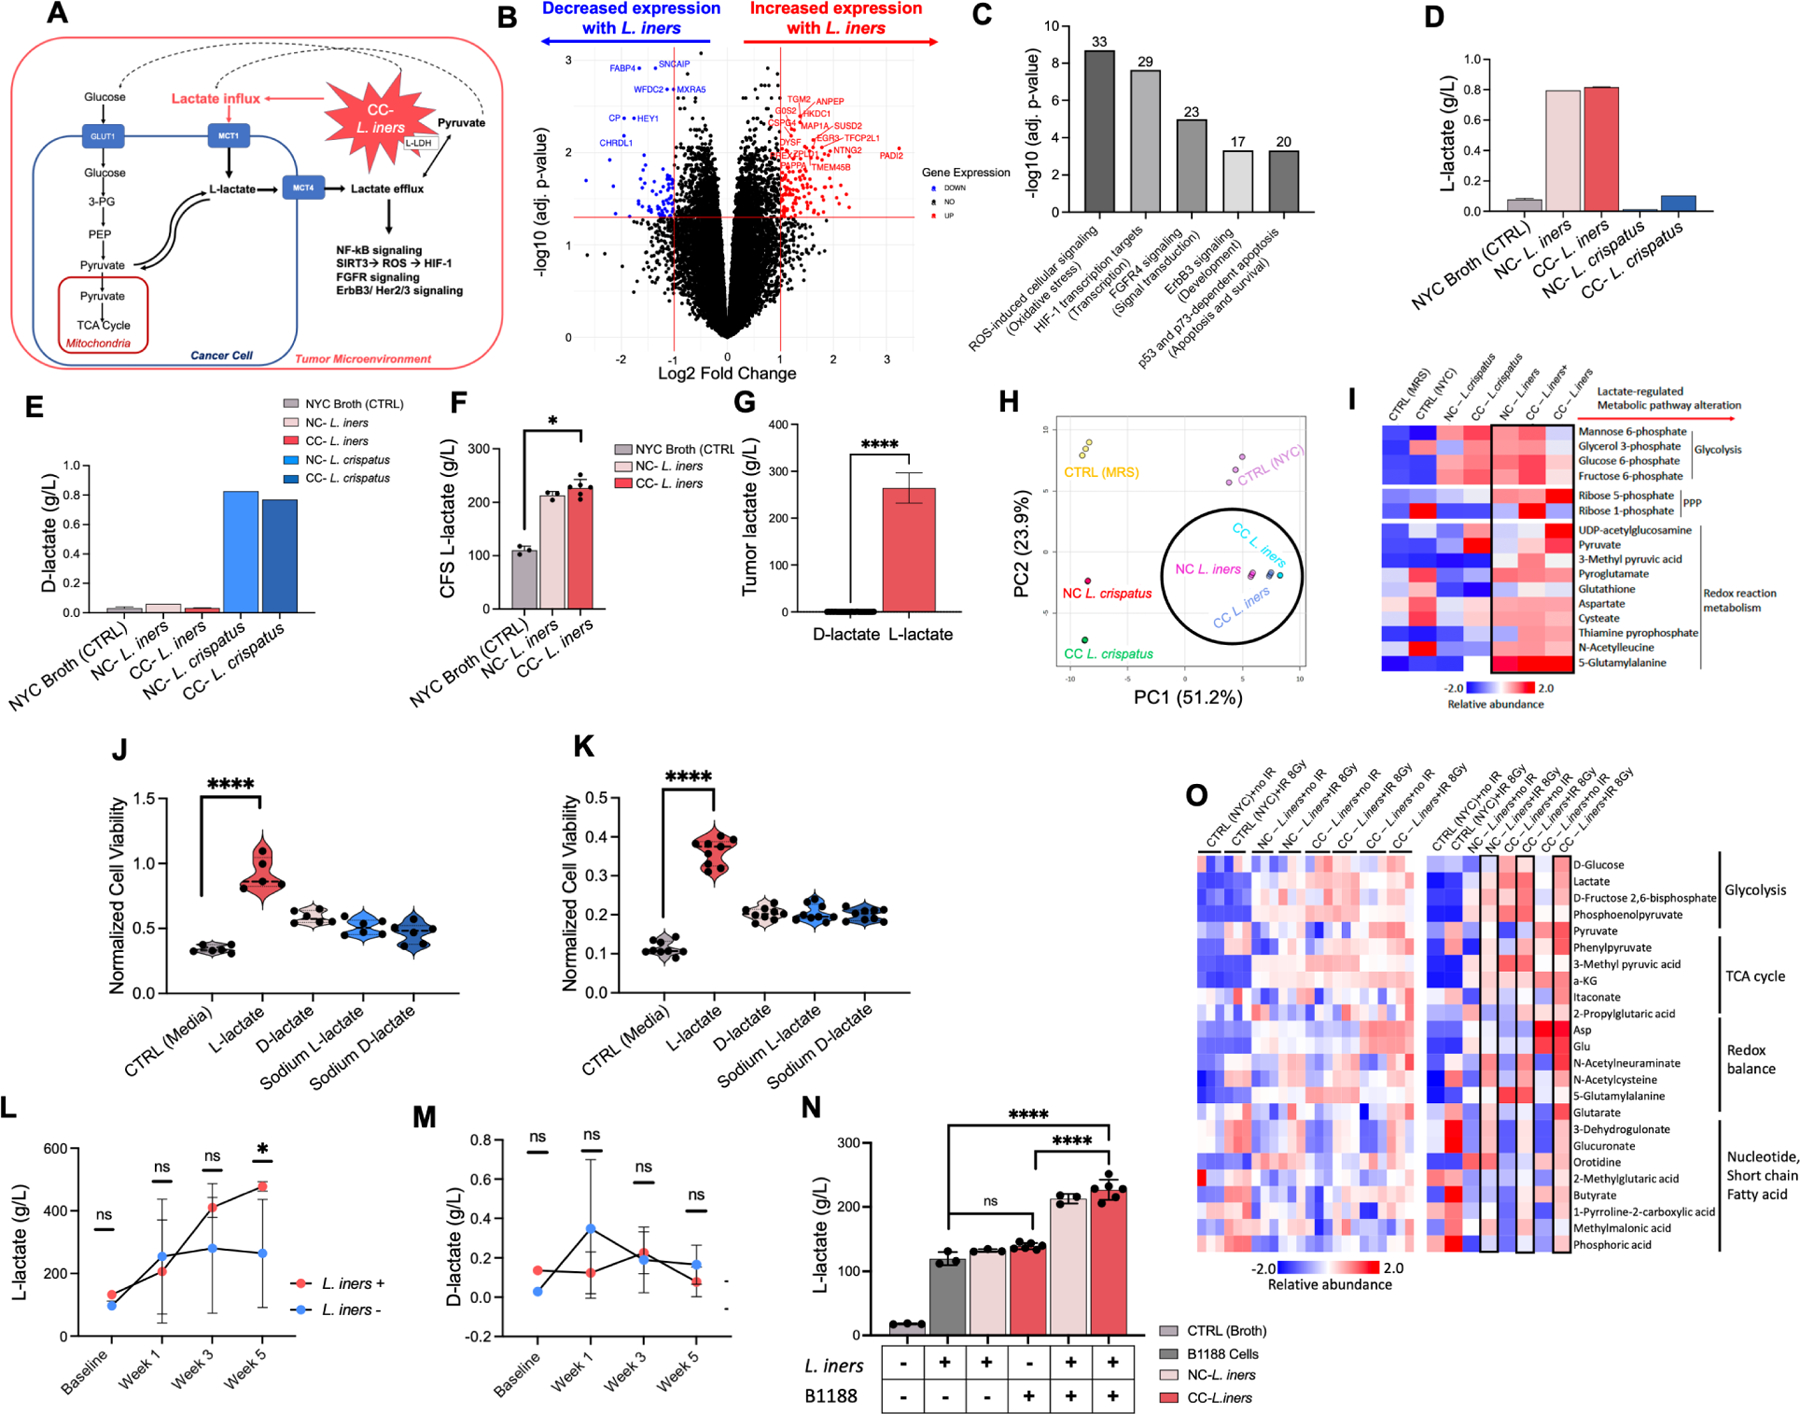
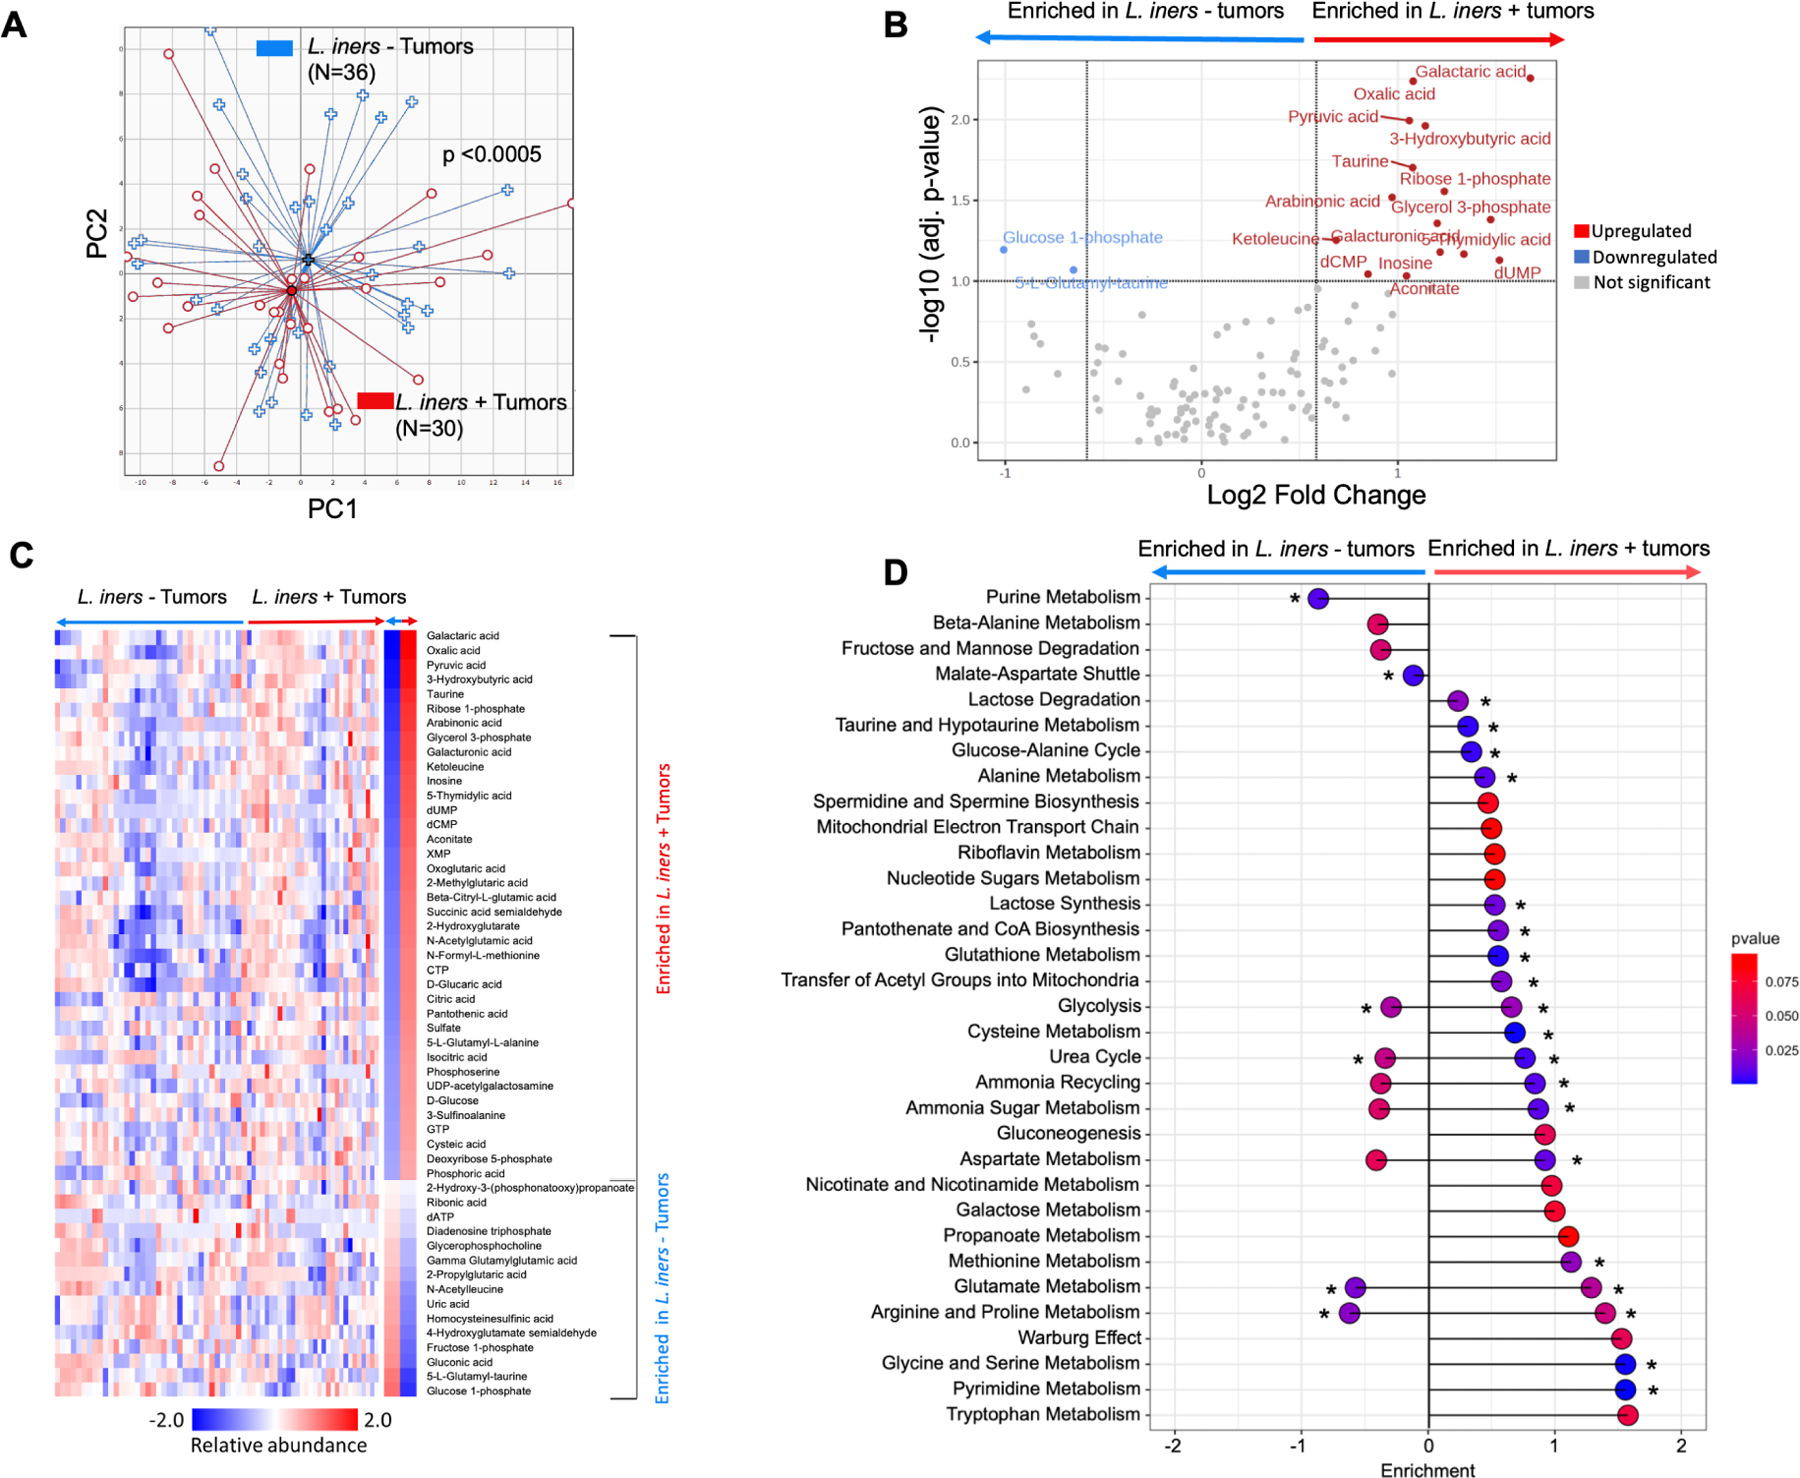
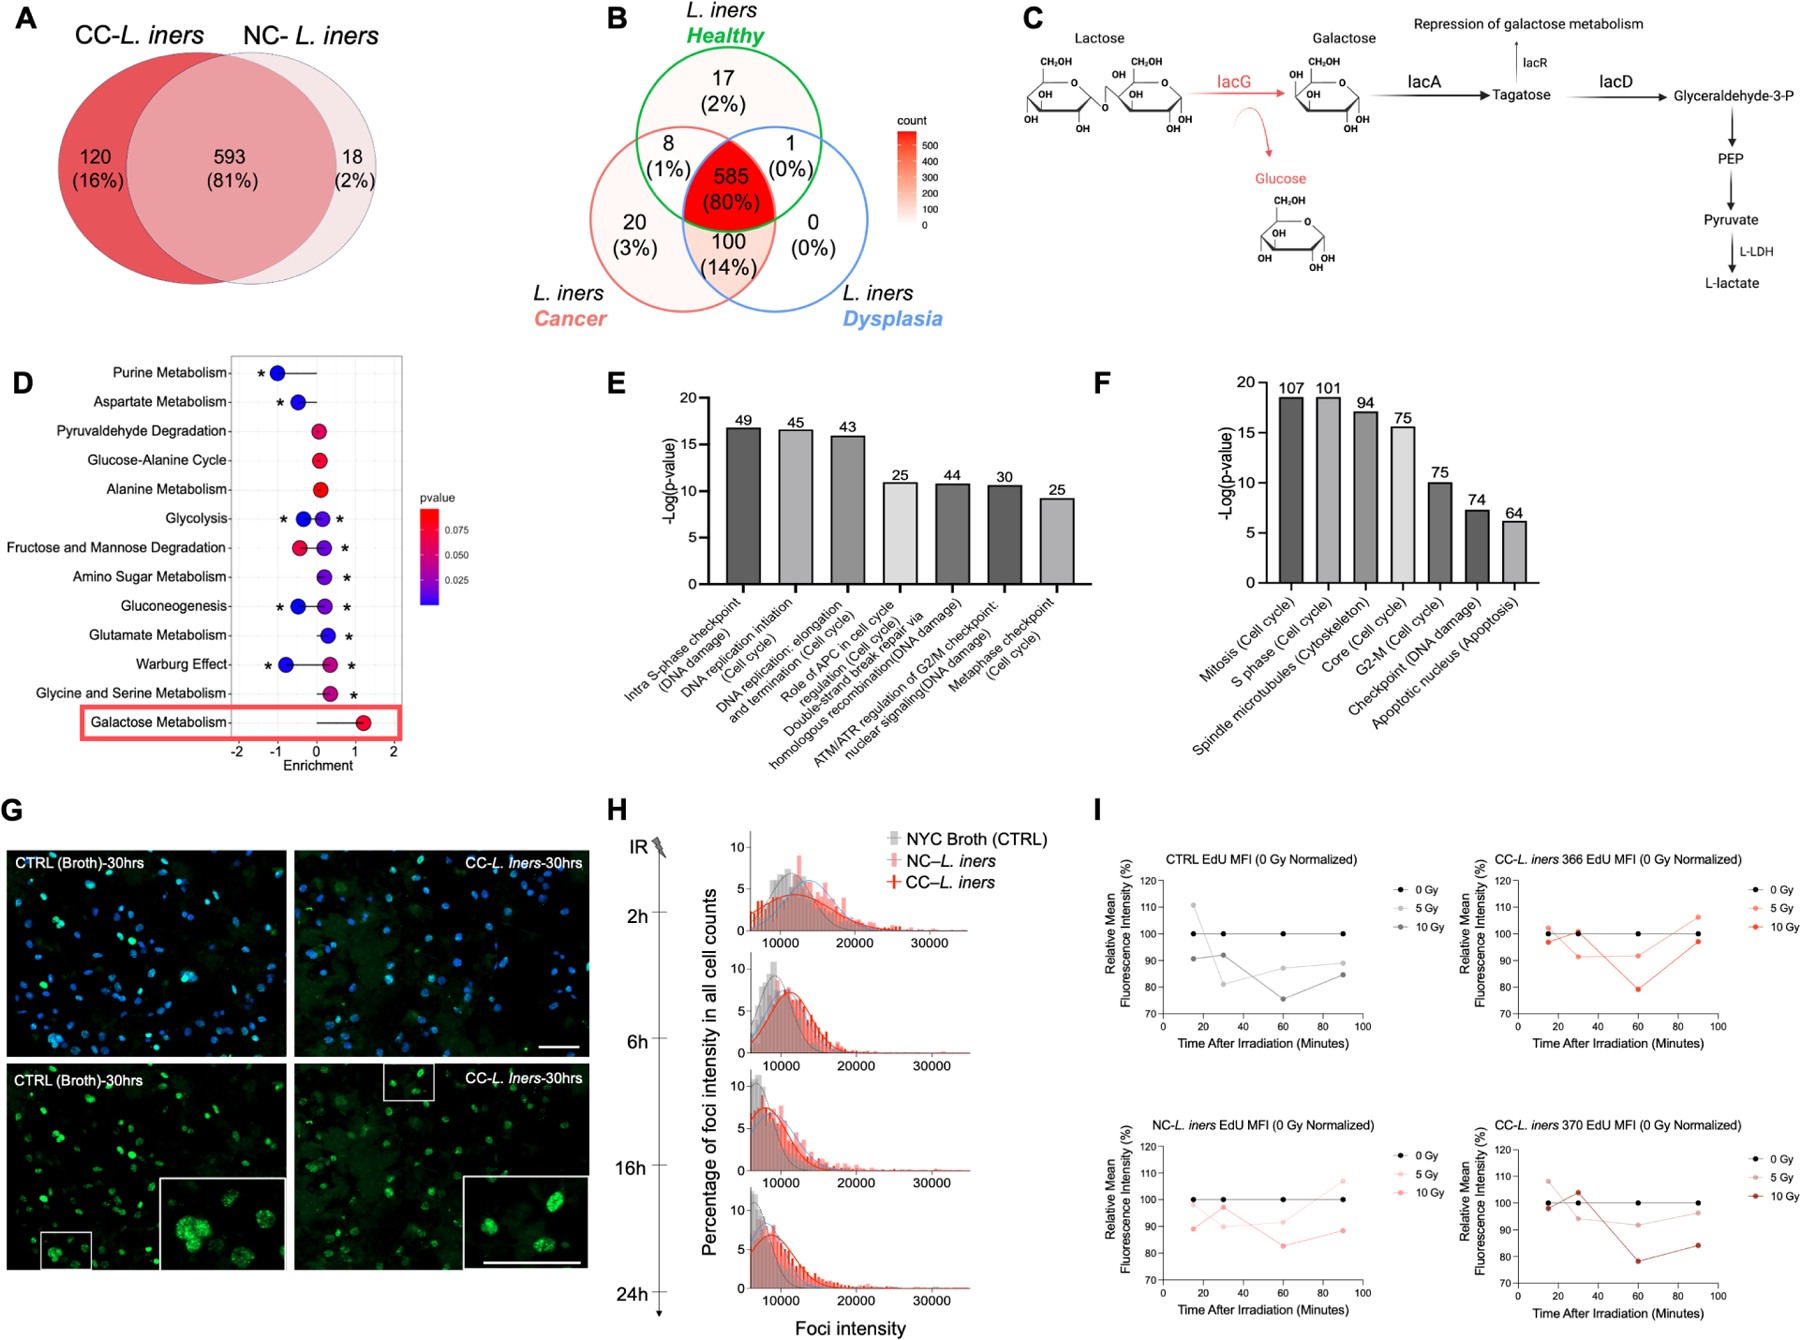
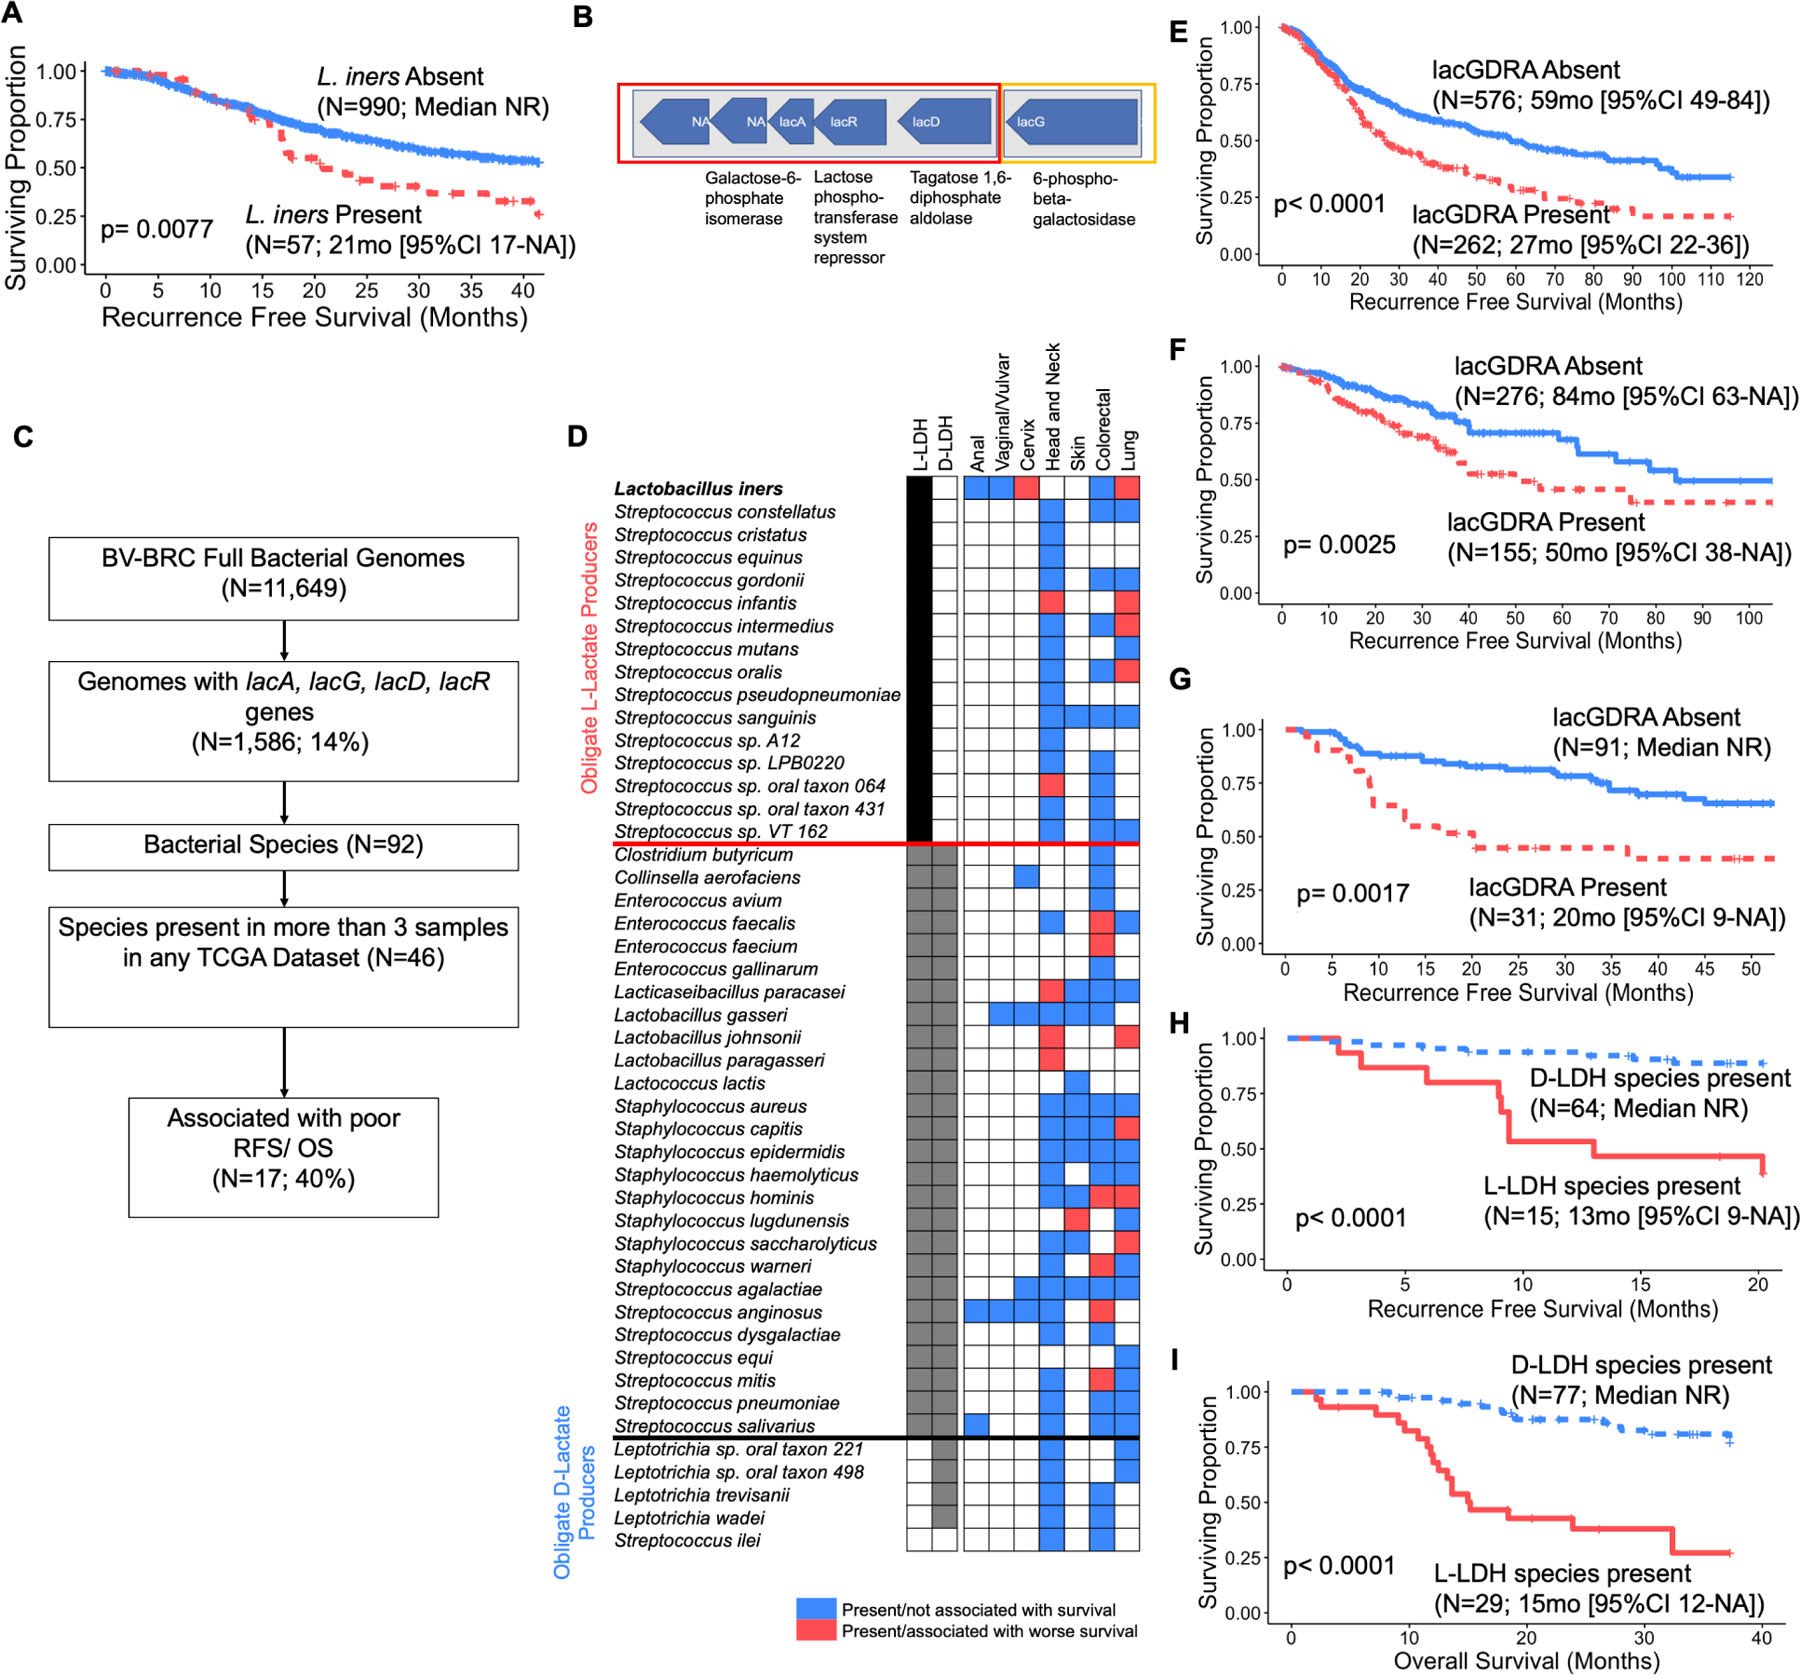
Tumor microbiota can produce active metabolites that affect cancer and immune cell signaling, metabolism, and proliferation. Here, we explore tumor and gut microbiome features that affect chemoradiation response in patients with cervical cancer using a combined approach of deep microbiome sequencing, targeted bacterial culture, and in vitro assays. We identify that an obligate L-lactate-producing lactic acid bacterium found in tumors, Lactobacillus iners, is associated with decreased survival in patients, induces chemotherapy and radiation resistance in cervical cancer cells, and leads to metabolic rewiring, or alterations in multiple metabolic pathways, in tumors. Genomically similar L-lactate-producing lactic acid bacteria commensal to other body sites are also significantly associated with survival in colorectal, lung, head and neck, and skin cancers. Our findings demonstrate that lactic acid bacteria in the tumor microenvironment can alter tumor metabolism and lactate signaling pathways, causing therapeutic resistance. Lactic acid bacteria could be promising therapeutic targets across cancer types.

Keywords: cervical cancer; chemoradiation; lactate; metabolism; microbiome; radiation.


Conflict of interest statement

Declaration of interests L.E.C. reports grants from American Society for Clinical Oncology, Radiology Society of North America, National Institutes of Health, and MD Anderson Cancer Center during the conduct of the study. A.J. reports personal fees from Genentech during the conduct of the study, as well as personal fees from Genentech outside the submitted work. L.L. reports other support from AstraZeneca and Pfizer, and grants from NCI outside the submitted work. J.A.W. reports other support from Micronoma during the conduct of the study, as well as other support from Imedex, Dava Oncology, Illumina, and PeerView outside the submitted work. P.O. reports Faculty grant/research support from Merck Sharp and Dohme Corp, Deinove Pharmaceuticals, Summit Pharmaceuticals, Melinta Pharmaceuticals, and Napo Pharmaceutical, in addition to consultant work with Napo Pharmaceutical, Ferring Pharmaceutical, Summit Pharmaceutical, and SNIPR Biome Company, all outside of the submitted work.

Figures

Figure 1.
Figure 1.. Tumor-resident Lactobacillus iners is associated with decreased recurrence-free and overall survival in cervical cancer patients.
A. Study design and standard of care treatment algorithm for patients on study with number of cervical tumor swabs collected at each timepoint for 16S ribosomal RNA sequencing (16S). Patients received 5 weeks of EBRT with concurrent cisplatin followed by brachytherapy and repeat imaging for disease response at 3 months. Sampling was at baseline, Weeks 1, 3 and 5 of radiation, and at 3 month follow up. B. Sample types collected and available for each analysis at baseline (pre-treatment). Tumor and gut samples were collected where possible from each patient at each timepoint; however, not all samples were collected or available for sequencing at each timepoint. C. Linear discriminant analysis effect size (LEfSe) analysis of 16S data from cervical tumor swabs for bacteria enriched in non-responders to radiation in a pilot cohort (N=41). Default parameters were used for LEfSe analysis with an LDA threshold of 4.0 for statistical significance and visualization. D. 16S compositional stacked bar plots of cervical tumor swabs for all patients at baseline (N=97), sorted by vaginal community state type (CST), including L. iners (red), G. vaginalis (blue), and P. bivia (green). E. Kaplan-Meier recurrence-free survival (RFS) curves stratified by presence (N=44) or absence (n=52) of tumoral L. iners. Survival curves censored at 24 months. Log-rank test for comparison. Total # of events = 33. F. 16S relative counts of L. iners in cervical tumor swabs collected during CRT. Week 1 (N=68), week 3 (N=66), week 5 (N=78), and follow-up (N=30) compared to baseline (N=96) using paired t-tests and false discovery rate (FDR) adjusted p-value. Box represents interquartile range (25th to 75th), bar indicates median, whiskers represent minimum and maximum values. G. Multivariate cox proportional hazard analysis for overall survival (OS), adjusting for gut microbiome diversity (N=90) and tumoral L. iners (N=90). Total # of events = 14. Square represents hazard ratio (HR), bars represent 95% confidence intervals on HR. H. Baseline relative counts of L. iners stratified by tumor size (FIGO 2009 Stage I-II [N=54] vs Stage III-IV [N=47]). Unpaired t-test. NS=p>0.05. Box represents interquartile range (25th to 75th), bar indicates median, whiskers represent minimum and maximum values. I. Kaplan-Meier RFS curves for patients with FIGO 2009 Stage I-II tumors, stratified by presence (N=26) or absence (n=26) of tumoral L. iners. Survival curves censored at 54 months. Log-rank test for comparison.
Figure 2.
Figure 2.. L. iners induces treatment resistance in vitro.
A) Workflow for the establishment and maintenance of patient-derived organoids (PDO) and B188 primary cells. B) Positive staining of PDOs B1188 with antibodies for anti-P63 and anti-Ki67, together with decreased expression of the differentiation marker staining of anti-CK13 antibody and PAS, confirming squamous carcinoma origin. Positive staining of anti-panCK marker demonstrates primary cancer cell origin. Scale bars,100 μm C) Bright view of PDO B1188 pretreated with cancer-derived L. iners (CC-L. iners) cell-free supernatant (CFS) vs. control (NYC Broth) followed by 4Gy irradiation. Scale bars,1 mm D) Histogram of organoid size and count (percentage of total counted) for organoids from PDO B1188 pretreated with CC-L. iners CFS (red) vs. non-cancer derived L. iners (NC-L. iners; pink) vs. control (NYC Broth; grey) followed by 4Gy irradiation. E) Cell viability (measured by CellTiter Glo) of irradiated organoids from PDO B1188 pretreated with CC-L. iners cell-free supernatant (CFS) vs. control (NYC Broth) followed by 4Gy and 8Gy irradiation. 2 experiments, 3 replicates. One way ANOVA (CFS vs. control). F) B1188 cell viability after irradiation. G) HeLa cell viability after irradiation. H) SiHa cell viability after irradiation. I) CaSki cell viability after irradiation. J) B1188 cell viability after gemcitabine (GEM) treatment. K) B1188 cell viability after cisplatin (CIS) and 2Gy irradiation. L) B1188 cell viability after 5-fluorouracil (5-FU). M) B1188 cell viability after GEM and 2Gy irradiation. N) B1188 cell viability after CIS + 2Gy irradiation. O) B1188 cell viability after = 5-FU and 2 Gy. P) B1188 cell viability with UV-killed bacterial fragments and IR. 1 experiment, 3 replicates. Cell viability (measured by CellTiter Glo) following pretreatment of cells with control (NYC Broth), NC-L. iners CFS or CC-L. iners CFS (F-O); 3 experiments, 3 replicates each (F-O); 2 patient-derived CC-L. iners strains pooled (E-P); one way ANOVA between CC-L. iners with Mean and SEM are presented (E-P).
Figure 3.
Figure 3.. L. iners causes treatment resistance through increased L-lactate production in the tumor microenvironment.
A. Hypothetical schematic of L. iners production of L-lactate in the tumor microenvironment “priming” cervical cancer cells for lactate addiction, driving the feedback loop of lactate utilization via upregulation of GLUT1, MCT1 and MCT4, and lactate-regulated induction of reactive oxygen species signaling, HIF-1, NFkB, FGFR, ErbB3/HER 2/3, and p53 dependent pathways. B. B1188 cells pre-treated with L. iners (1 NC-L. iners strain, 2 CC-L. iners strains) vs. control (NYC broth) CFS prior to RNA sequencing. Fold change in gene expression from control (right) to L. iners (left) is shown. Log2 (Fold Change) threshold of −1, 1. –Log10 (FDR-adjusted p-value) threshold is 1.2. C. Metacore pathway analysis of significantly altered genes. Top 5 most significantly altered pathways are shown ranked by -Log10 (FDR-adjusted p-value). Number above bar represents the proportion of genes altered in each pathway. D. L-lactate production in bacterial culture of cancer-derived CC-L. crispatus, CC-L. iners, NC-L. crispatus, NC-L. iners, and control (NYC broth). E. D-lactate production in bacterial culture of cancer-derived CC-L. crispatus, CC-L. iners, NC-L. crispatus, NC-L. iners, and control (NYC broth). F. L-lactate levels in bacterial culture for control (NYC Broth), NC-L. iners or CC-L. iners. G. L-lactate and D-lactate relative levels (g/L) for cervical tumor Cytobrush samples (log scale). N=29. H. Principal component analysis (PCA) of metabolites. I. Unsupervised hierarchical clustering of most differentially abundant metabolites, grouped by metabolic process. J. Cell viability (CellTiter Glo) of pretreated B1188 cells with 20mM lactate isoforms (L-lactate, D-lactate, Sodium L-lactate, Sodium D-lactate, media control) after irradiation (4Gy). K. Cell viability (CellTiter Glo) of pretreated B1188 cells with 20mM lactate isoforms after GEM. L. L-lactate levels in cervical tumor Cytobrush samples before, during (Week 1, Week 3) and after EBRT (Week 5) for L. iners + patients (BL N=1; Wk1 N=6; Wk3 N=2; Wk5 N=4) and L. iners− patients (BL N=3; Wk1 N=4; Wk3 N=6; Wk 5 N=4). M. D-lactate levels in cervical tumor Cytobrush samples. N. L-lactate levels for media control (−/−), L. iners in culture alone (+/−), B1188 cells in culture alone(−/+), vs. B1188 cells treated with L. iners CFS (+/+) for NC-L. iners and CC-L. iners. O. Differentially abundant metabolites present in primary cells B1188 treated with NYC Broth (control), NC-L. iners (N=1) CFS, and CC-L. iners (N=2) CFS, either nonirradiated (0Gy) or irradiated (8Gy), grouped by metabolic process. Unsupervised hierarchical clustering of most differentially abundant metabolites, grouped by metabolic process (I,O); Analyzed by Megazyme Kit (D,E), TC-MS (L-N) or HR-MS/IC-MS (I,O); Wilcoxon rank-sum test (J-M), unpaired t-test with mean and SEM (G) or 2-way ANOVA (F) with NS P > 0.05, *P ≤ 0.05, ** P ≤ 0.01, *** P ≤ 0.001, **** P ≤ 0.0001; 1 (B,F,J),N, 2 (H-J) or 3 (K) experiments, 3 replicates each, 2 CC-L. iners strains pooled (B,F,J); 1 experiment, 1 culture plate, no statistical comparisons (D-E). Wilcoxon rank-sum test vs. CTRL unadjusted (J-L) and adjusted (N); Comparisons for cells treated with MRS Broth (L. crispatus control), NYC Broth (L. iners control), and cancer and non-cancer derived L. iners (N=3) and L. crispatus strains (N=2) (H-I). Normalized to unirradiated media control (J-K).
Figure 4.
Figure 4.. L. iners positive tumors have metabolic alterations compared to L. iners negative tumors.
A. Principal coordinate analysis of relative abundances of tumor metabolites for L. iners+ (N=36) and L. iners− tumors (N=30). Dispersion Separability Criterion, p<0.005. B. Volcano plot of differentially abundant metabolites. –Log10 (adj. p-value) threshold=1.0; log2 (Fold Change) threshold −1 to 1. C. Supervised hierarchical clustering of differentially abundant metabolites. D. Lollipop plot of pathway assignments for differentially enriched metabolites. Sorted by effect size on a log10 scale. * FDR-adj p<0.05. Analyzed by HR-MS and IC-MS (A-D).
Figure 5.
Figure 5.. Cancer-derived L. iners acquires additional genes for lactate production over NC-L. iners and alters cancer cell gene expression in pathways involved in intrinsic radiation sensitivity.
A. Overlapping and unique Genes on comparative genomic analysis for CC- L. iners (16%) vs NC-L. iners (2%) vs. shared (81%). B. Overlapping genes on comparative genomic analysis for Healthy L. iners vs. dyplasia L. iners vs. CC- L. iners. C. Sequential genes in pathways common to CC- L. iners and CC- L. iners (black) and unique to CC- L. iners (red) on comparative genomic analysis. LacG in CC- L. iners encodes the reversible enzyme, 6-phospho-beta-galactosidase, which converts lactose to galactose, while CC- L. iners ers utilizes only lactose in the lacDRA pathway. LacR is a repressor switch to turn off lactose metabolism to lactate. D. Lollipop plot of metabolite pathways assignments for metabolites enriched in CC- L. iners isolates vs. NC-L. iners isolates. Galactose metabolism is the only upregulated pathway, consistent with lacG gene acquisition and 6-phospho-beta-galactosidase activity. E. Top 7 differentially expressed metacore pathways for B1188 cells. F. Top 7 differentially expressed metacore processes for B1188 cells. G. Gamma H2AX and DAPI fluorescent staining of pretreated B1188 cells 30 hours after irradiation (8 Gy). Scale bars,100 μm H. Gamma H2AX dynamics for primary cells B1188 treated with 8Gy in each CFS condition. I. Radio-resistant EdU DNA synthesis assays for pretreated B1188 primary cells. Normalized to 0 Gy (black). Log2 (Fold Change) cutoff of 2.0 (E,F); 1 independent experiment, 1 (I) or 3 (E) replicates, 2 CC-L. iners strains pooled (E) or separate (I); No statistical comparisons made (H,I).
Figure 6.
Figure 6.. L. iners and genomically similar, commensal, L-lactic acid producing bacteria (LAB) portend poor prognosis across cancer types.
A. Recurrence-free survival (RFS) for L. iners presence (N=57) or absence (N=990) in primary tumor samples from the non-small cell lung carcinoma (NSCLC) TCGA dataset. B. Consecutive operons found in L. iners isolates and deposited genomes (CC-L. iners = 2, NC-L. iners = 2) on comparative genomic analysis. Orange denotes lacG gene found only in CC-L. iners isolates, vs. red which denotes lac genes found in all L. iners isolates. C. Flowchart for identification of genetically similar LAB species in TCGA datasets. D. Frequency of lacGDRA bacteria genomically similar to L. iners (N=46) across MDACC (anal, vaginal/vulvar, cervix) and TCGA datasets (head and neck, skin, colorectal, lung). Red box denotes species is present and associated with decreased RFS and/or overall survival (OS) in individual dataset. Blue box denotes species is present in dataset, but not associated with RFS or OS. E. RFS for patients with NSCLC stratified by presence (N=262) or absence (N=576) of any lacGDRA species from Bacterial and Viral Bioinformatics Resource Center (BV-BRC). F. RFS for patients with Colorectal adenocarcinoma stratified by presence (N=155) or absence (N=276) of any lacGDRA species. G. RFS for patients with Head and Neck Squamous Cell Carcinoma (HNSCC) stratified by presence (N=31) or absence (N=91) of any lacGDRA species. H. RFS for patients with HNSCC stratified by presence of at least one obligate D-lactate producing lacGDRA bacterial species (Leptotrichia trevisanii or Leptotrichia wadei) and no obligate L-lactate producing lacGDRA bacterial species (N=64) vs. at least one L-lactate producing species (Lactobacillus paragasseri, Streptococcus infantis, Lactobacillus johnsonii, Streptococcus sp. oral taxon 064, or Lacticaseibacillus paracasei; N=15). I. OS for patients with HNSCC stratified by presence of at least one obligate D-lactate producing lacGDRA bacterial species (Leptotrichia trevisanii or Leptotrichia wadei) and no obligate L-lactate producing lacGDRA bacterial species (N=77) vs. at least one L-lactate producing species (Lactobacillus paragasseri, Streptococcus infantis, Lactobacillus johnsonii, Streptococcus sp. oral taxon 064, or Lacticaseibacillus paracasei; N=29). Kaplan-meier survival curves with log-rank test for comparison. (A, E-I).

References

    1. Ghaddar B, Biswas A, Harris C, Omary MB, Carpizo DR, Blaser MJ, and De S (2022). Tumor microbiome links cellular programs and immunity in pancreatic cancer. Cancer Cell 40, 1240–1253.e5. 10.1016/j.ccell.2022.09.009. - DOI - PMC - PubMed
    1. Riquelme E, Zhang Y, Zhang L, Montiel M, Zoltan M, Dong W, Quesada P, Sahin I, Chandra V, San Lucas A, et al. (2019). Tumor Microbiome Diversity and Composition Influence Pancreatic Cancer Outcomes. Cell 178, 795–806.e12. 10.1016/j.cell.2019.07.008. - DOI - PMC - PubMed
    1. Poore GD, Kopylova E, Zhu Q, Carpenter C, Fraraccio S, Wandro S, Kosciolek T, Janssen S, Metcalf J, Song SJ, et al. (2020). Microbiome analyses of blood and tissues suggest cancer diagnostic approach. Nature 579, 567–574. 10.1038/s41586-020-2095-1. - DOI - PMC - PubMed
    1. Nejman D, Livyatan I, Fuks G, Gavert N, Zwang Y, Geller LT, Rotter-Maskowitz A, Weiser R, Mallel G, Gigi E, et al. (2020). The human tumor microbiome is composed of tumor type–specific intracellular bacteria. Science 368, 973–980. 10.1126/science.aay9189. - DOI - PMC - PubMed
    1. Park EM, Chelvanambi M, Bhutiani N, Kroemer G, Zitvogel L, and Wargo JA (2022). Targeting the gut and tumor microbiota in cancer. Nat Med 28, 690–703. 10.1038/s41591-022-01779-2. - DOI - PubMed

Publication types

Supplementary concepts