. 2023 Oct 20;14(1):6669.
doi: 10.1038/s41467-023-42371-7.

Imaging and multi-omics datasets converge to define different neural progenitor origins for ATRT-SHH subgroups

Affiliations

Imaging and multi-omics datasets converge to define different neural progenitor origins for ATRT-SHH subgroups

María-Jesús Lobón-Iglesias et al. Nat Commun. .

Abstract

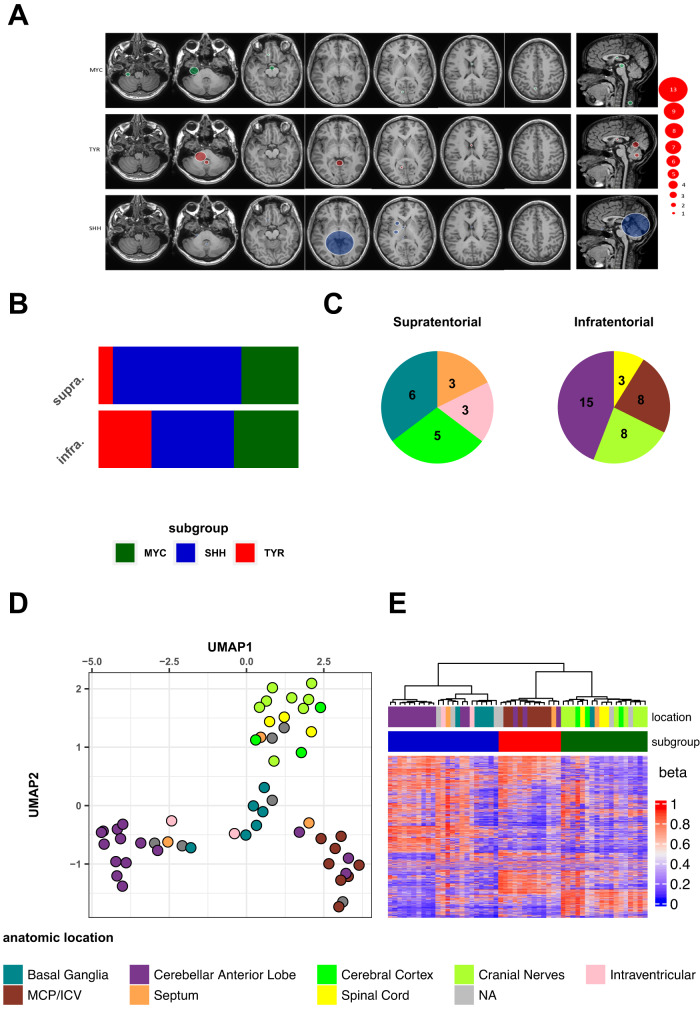
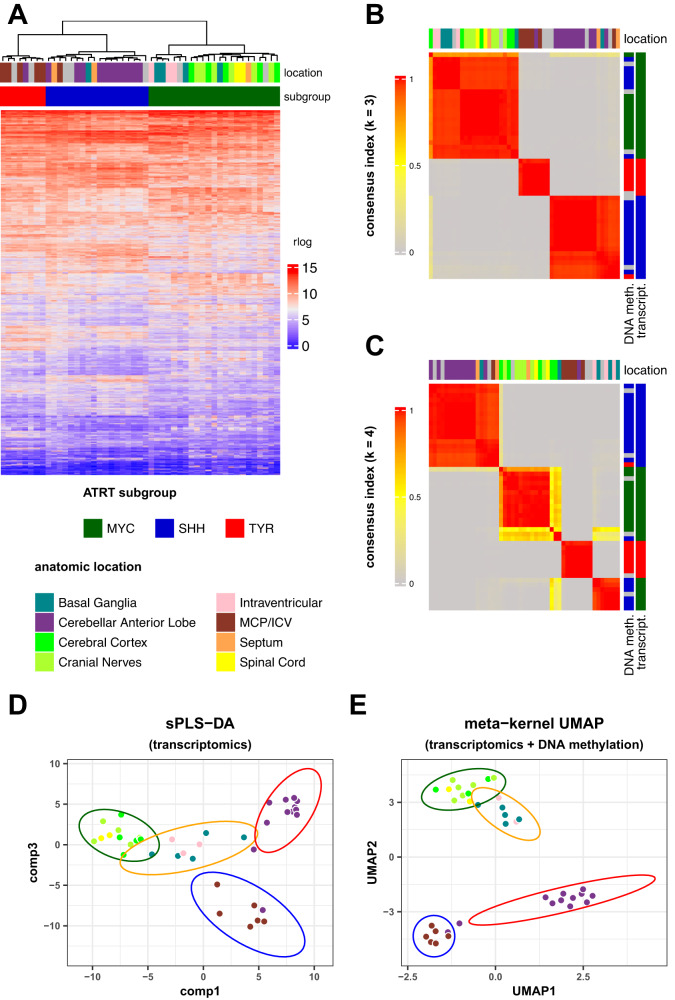
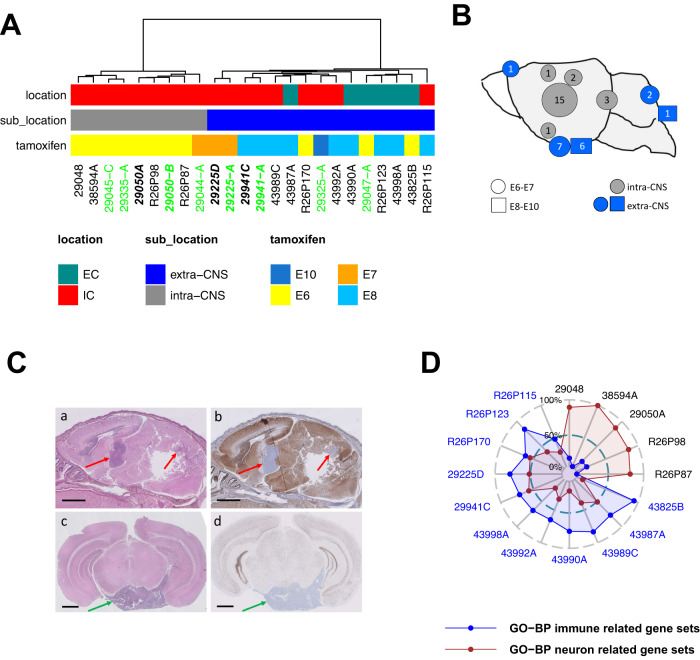
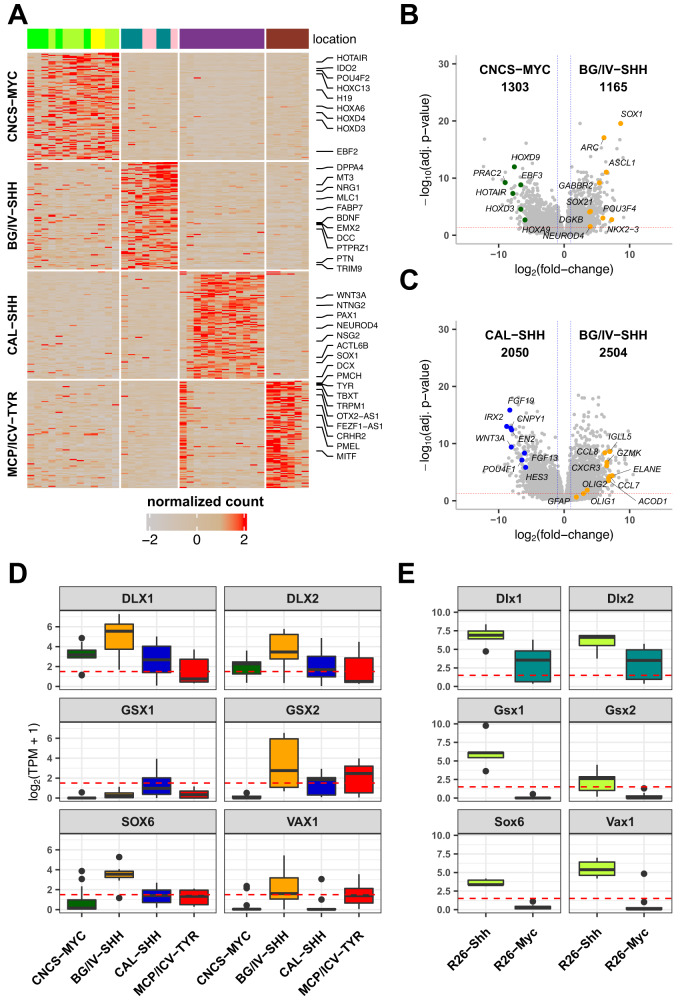
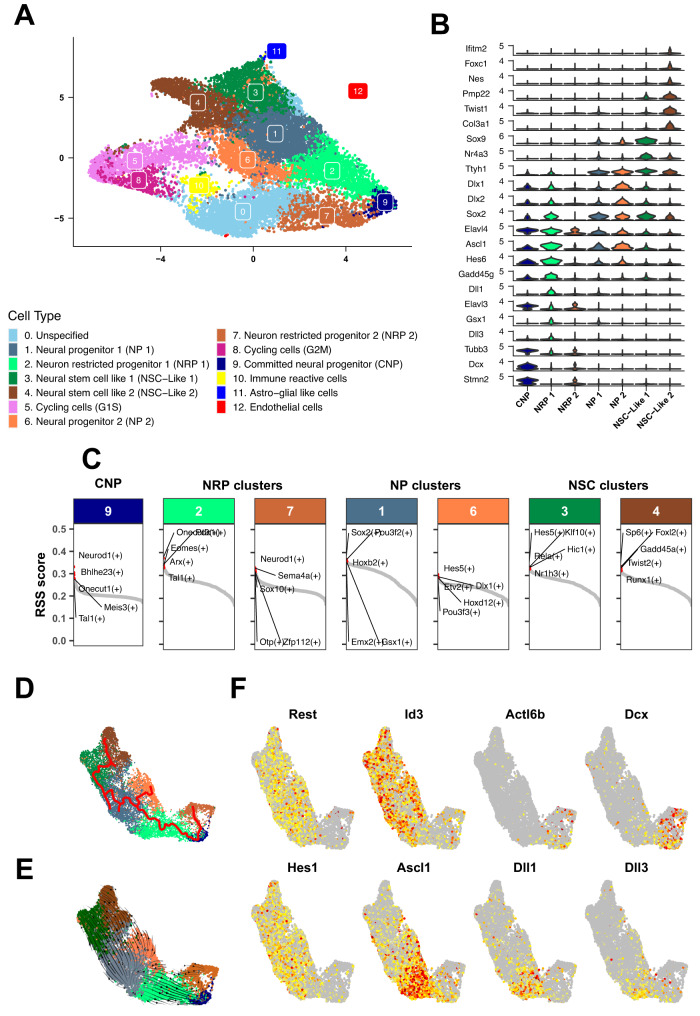
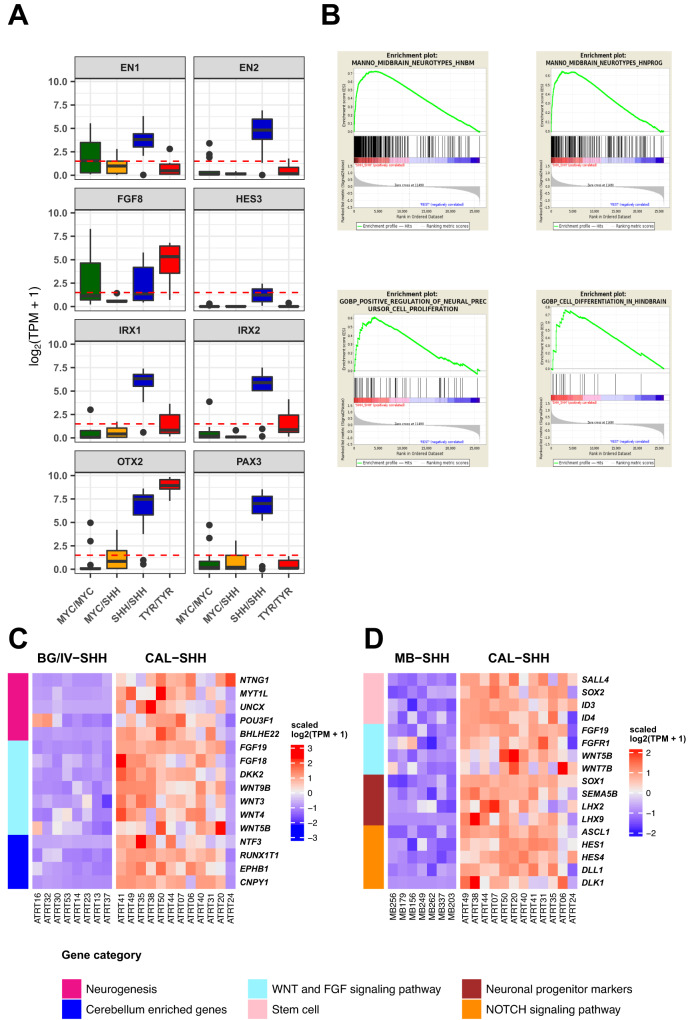
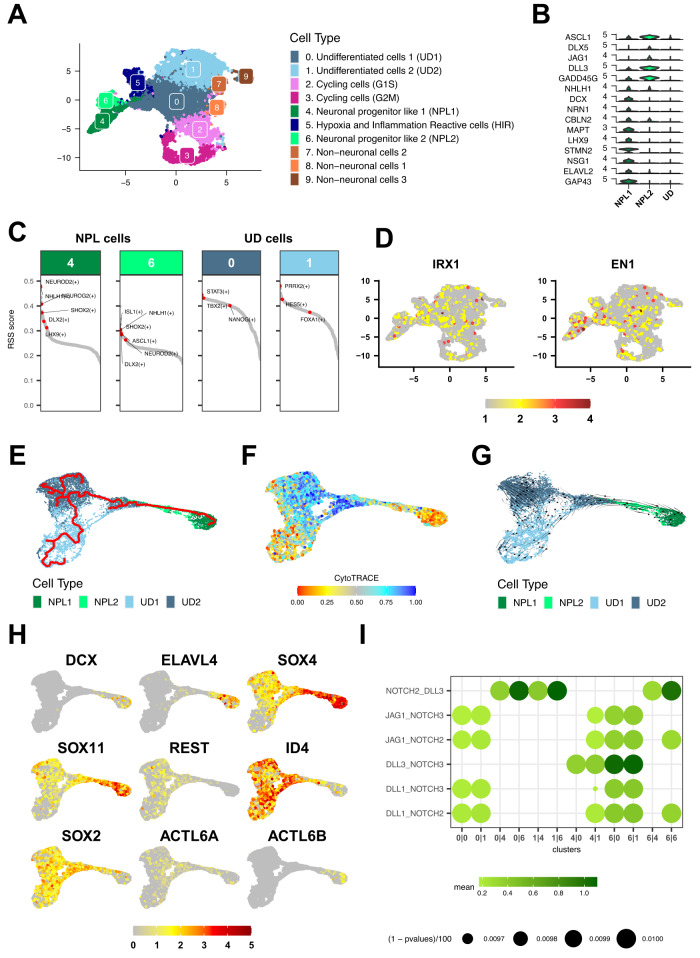
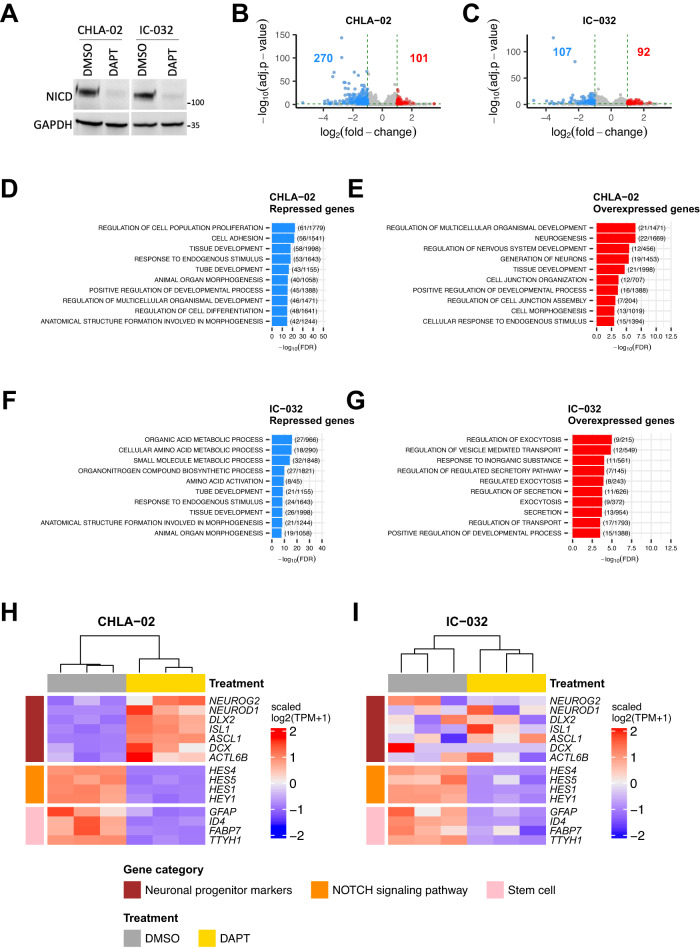
Atypical teratoid rhabdoid tumors (ATRT) are divided into MYC, TYR and SHH subgroups, suggesting diverse lineages of origin. Here, we investigate the imaging of human ATRT at diagnosis and the precise anatomic origin of brain tumors in the Rosa26-CreERT2::Smarcb1flox/flox model. This cross-species analysis points to an extra-cerebral origin for MYC tumors. Additionally, we clearly distinguish SHH ATRT emerging from the cerebellar anterior lobe (CAL) from those emerging from the basal ganglia (BG) and intra-ventricular (IV) regions. Molecular characteristics point to the midbrain-hindbrain boundary as the origin of CAL SHH ATRT, and to the ganglionic eminence as the origin of BG/IV SHH ATRT. Single-cell RNA sequencing on SHH ATRT supports these hypotheses. Trajectory analyses suggest that SMARCB1 loss induces a de-differentiation process mediated by repressors of the neuronal program such as REST, ID and the NOTCH pathway.


Conflict of interest statement

The authors declare no competing interests.

Figures

Fig. 1
Fig. 1. Radiological description of ATRTs’ epicenter suggests clearly distinct origins for each molecular subtype.
A MRI showing the most frequent tumor locations according to molecular subgroups. The round size indicates the number of tumors. The last column represents the tumors located on the midline, which are not additional cases, except the spinal MYC tumors. The different colors correspond to the molecular subgroups based on DNA methylation data (DKFZ brain tumor classifier v11b4): MYC (green), TYR (red) and SHH (blue). B Bar plot showing the distribution of the different molecular groups assigned according to the DNA methylation profile at the supra- and infratentorial level. C Pie charts showing the distribution of the different ATRT anatomical locations at infra and supratentorial levels. NA: not available anatomical location. The color code is referred to at the bottom of Fig. 1. MCP/ICV: middle cerebellar peduncle and inferior cerebellar vermis. D UMAP analysis performed on human ATRT DNA methylation array data. E Unsupervised hierarchical clustering of ATRT samples based on DNA methylation data. Top annotation indicates ATRT anatomical location and molecular subgroup. Source data are provided as a Source Data file.
Fig. 2
Fig. 2. Integrative analysis identified four anatomical-molecular subgroups and splits SHH ATRT in two subgroups with distinct anatomical locations and transcriptional profiles.
A Unsupervised hierarchical clustering of human ATRT samples based on RNAseq dataset. Anatomic location as well as the assigned RNAseq subgroup for each sample is indicated in the top annotations. B, C Consensus clustering of human ATRT samples based on RNAseq data with k = 3 (B) and k = 4 (C). D UMAP of human ATRT based on the integrated DNA methylation and transcriptomics datasets (kernel-based approach). Points indicate tumor samples, colors indicate anatomic location and the ellipses indicate tumor anatomical-molecular subgroups. E sPLS-DA individual plot using the two major components (comp, comp 1, and comp3). Points indicate tumor samples, colors indicate anatomic location and the ellipses indicate tumor anatomical-molecular subgroups. sPLS-DA was applied on RNAseq data. Source data are provided as a Source Data file.
Fig. 3
Fig. 3. Genetically engineered mouse models reveal specific anatomical origins for murine Myc and Shh ATRT.
A Unsupervised hierarchical clustering of mouse RT (n = 21 biologically independent mice) based on transcriptomic dataset of combined RNAseq dataset (n = 16 biologically independent samples, sample name colored in black) and gene expression microarray dataset (n = 8 biologically independent samples, sample name colored in green). 3 samples (bold sample names) were processed using the two platforms and used to control the cross-platform data integration. B Anatomical distribution of Rosa26::CreERT2/Smarcb1flox/flox (R26) RT; circles correspond to Tamoxifen injection at E6-E7 while squares correspond to E8-E10; gray indicates intra-CNS tumors, blue, indicates extra-CNS tumors. C Hematoxylin Eosin Safran (HES, a, c) and BAF47 staining (b, d) of sagital (a, b) and coronal (c, d) sections of brains from the R26 mice. Red arrows point to intra-CNS tumors (a, b); green arrows point to extra-CNS tumors (c, d). Scale bars: 1 mm (D) Single sample gene set enrichment analysis of murine RT samples based on RNAseq data (n = 16). Each dot corresponds to one sample; sample names are colored according to molecular subgroups (black: Shh; blue: Myc). Average enrichment scores (in percentage) of the top 5 differentially enriched neuronal development-related (red) and immune-related (blue) gene sets are considered and indicated for each sample. Source data are provided as a Source Data file.
Fig. 4
Fig. 4. BG/IV SHH ATRT and murine Shh ATRT show a unique expression pattern suggesting a ganglionic eminence origin.
A Heatmap of gene expression using the 100 most differentially expressed genes between anatomical-molecular subgroups in a “one versus all others” manner. Top annotation indicates sample anatomical location. Genes of interest are listed at the left of the heatmap; expression levels are ranked from the lowest (gray, −2) to the highest (red). B, C Volcano plots showing differential gene expression analysis results of BG/IV SHH versus MYC (b) and BG/IV SHH versus CAL SHH (c). The x axis indicates the log2 transformed fold-change and the y axis indicates the reverse of the log10 transformed adjusted p-value. Horizontal red line corresponds to adjusted p-value equals to 0.05 and two vertical blue lines indicate log2(fold-change) respectively equal to = −1 (left) and 1 (right). Differentially expressed genes of interest are labeled. Negative binomial GLM and Wald test were applied for gene expression comparison and generated p-values were corrected using the Benjamini and Hochberg method. D, E Boxplots of ganglionic eminence gene expression in (A) human ATRT anatomical molecular subgroups (n = 39 total of independent samples: nCNCS-MYC = 13, nBG/IV-SHH = 8, nCAL-SHH = 12, nMCP/ICV-TYR = 6) and in (B) mouse RT subgroups (n = 16 total of independant samples: nR26-SHH = 5, nR26-MYC = 11). x axis indicates subgroups and y axis indicates the level of expression in log2(TPM + 1). The box part of the boxplots represents the interquartile range while the whisker bonds of the boxplots indicate the highest and smallest values within 1.5 times interquartile range above and below the 75th and 25th quantiles respectively. Source data are provided as a Source Data file.
Fig. 5
Fig. 5. Single-cell RNAseq suggests ganglionic eminence neural progenitors as putative cells of origin of BG/IV-ATRT.
A UMAP visualization of the mouse Shh single cell clusters obtained after the integration of 3 independant samples. Colors distinguish the different clusters; assigned names are reported at the right of the UMAP. B Violin plots showing the specific marker genes for neuronal clusters. C Regulon specificity score (RSS) for each transcription factor (TF) in Neuronal like clusters. In each cluster, regulons (TF along with their direct targets) are ordered according to their RSS. Interesting regulons are labeled. D Trajectory inference analysis using the PAGA algorithm (Monocle3). Colors distinguish the different clusters as reported in the legend of (A). E Embedding streams (RNA velocity – scVelo) showing the transcriptional dynamics throughout the trajectory. Colors distinguish the different clusters as reported in the legend of (A). F Heatmap showing the gradual expression along the trajectory of: the Notch signaling (Hes, Dlk, Ascl1), the SWI/SNF subunit (Actl6B) and neuronal differentiation gene (Rest, Id, Dcx) expression. Source data are provided as a Source Data file.
Fig. 6
Fig. 6. CAL SHH ATRT anatomical location and molecular profile suggest a neuronal progenitor from the midbrain-hindbrain boundary as cell of origin.
A Boxplot showing the expression levels of genes involved in midbrain-hindbrain boundary (MHB) patterning in the human ATRT anatomical molecular subgroups (n = 39 total of independent samples: nCNCS-MYC = 13, nBG/IV-SHH = 8, nCAL-SHH = 12, nMCP/ICV-TYR = 6). x axis indicates subgroups and y axis indicates the expression level in log2(TPM + 1). The box part of the boxplots represents the interquartile range while the whisker bonds of the boxplots indicate the highest and smallest values within 1.5 times interquartile range above and below the 75th and 25th quantiles respectively. B Enrichment plot of midbrain/hindbrain gene sets in CAL-SHH resulting from GSEA between CAL SHH versus all other subgroups. C, D Heatmap showing the level of expression of a selection of genes differentially expressed in CAL SHH (n = 12) compared to BG/IV SHH (n = 8) (c) and to medulloblastoma SHH subgroup (n = 7) (d). Color codes at the right of the heatmaps refer to biological functions that are depicted below figures C and D Source data are provided as a Source Data file.
Fig. 7
Fig. 7. Single-cell RNAseq analysis reveals transcriptional intra-tumoral heterogeneity of cerebellar anterior lobe ATRTs and neuronal progenitors as putative cells of origin.
A UMAP visualization of the human CAL SHH cell clusters obtained after integration 4 independent samples. Colors distinguish the different clusters; assigned names are reported at the right of the UMAP. B Violin plots showing the specific marker genes for Neuronal progenitor like cells and undifferentiated cells. C Heatmap of Midbrain/Hindbrain boundary gene signatures (IRX1, EN1) expression on the UMAP of integrated human CAL-SHH ATRT samples. D Regulon specificity score (RSS) for each transcription factors (TF) in Neuronal progenitor and undifferentiated cell populations. In each cluster, regulons (TF along with their direct targets) are ordered according to their RSS. Regulons of interest are labeled. E Trajectory inference analysis using the PAGA algorithm (Monocle3) showing a path form NPL1 cluster to UD clusters via NPL2 cells. Color code indicates cell clusters as referred in (A). Dark green: NPL1 cells, light green: NPL2 cells, light blue: undifferentiated cells. F Heatmap of CytoTRACE score at single cell level. The color gradient indicates a differentiated state (red) to an undifferentiated state (blue). G Embedding streams (RNA velocity – scVelo) showing the transcriptional dynamics throughout the trajectory. Genes specifically expressed in NPL1, NPL2, UD1, and UD2 cell clusters were used. Dark green: NPL1 cells, light green: NPL2 cells, light blue: undifferentiated cells. H Heatmap of gene expression showing the gradual expression along the trajectory of neurogenic TFs (SOX4, SOX11), neuronal differentiation genes (DCX, ELAVL4), neuronal repressor (REST), stem cell and pluripotency markers (ID4, SOX2) and the SWI/SNF subunits genes (ACTL6A, ACTL6B). The color gradient indicates the expression levels, from the lowest (gray) to the highest (red). I Dot plot of NOTCH signaling ligand-receptor interaction between two cell clusters. Color gradient indicates the average expression of the ligand-receptor partner in the two clusters while the diameter of the dot indicates the corresponding p-value. Source data are provided as a Source Data file.
Fig. 8
Fig. 8. Inhibition of NOTCH signaling in rhabdoid cell lines.
A Western blot analyses for Notch intracellular domain NICD in CHLA-02 and IC-032 cell lines treated with DAPT NOTCH inhibitor or DMSO as a control. The experiment has been repeated 2 times for CHLA-02. B, C Volcano plot showing the differential gene expression analysis results of DAPT treatment versus DMSO in CHLA-02 (B) and in IC-032 (C) cell lines. The X axis indicates the log2 transformed fold-change and the Y axis indicates the reverse of the log10 transformed adjusted p-value. The number of significantly repressed and overexpressed genes are labeled in blue and in red, respectively. Genes having an absolute fold-change higher than 2 and an adjusted p-value lower than 0.05 are colored either in blue (for genes repressed in DAPT-treated cells) or in red (for genes overexpressed in DAPT-treated cells). The dotted green horizontal and vertical lines correspond to a p-value = 0.05 and to absolute fold-change = 2, respectively. Negative binomial GLM and Wald test were applied for gene expression comparison and generated p-values were corrected using the Benjamini and Hochberg method. D, E Top ten significantly enriched Gene Ontology (Biological Processes only) gene sets in genes that are differentially repressed (D) or overexpressed (E) in DAPT-treated CHLA-02 cells compared with DMSO. F, G Top ten significantly enriched Gene Ontology (Biological Processes only) gene sets in genes that are differentially repressed (F) or overexpressed (G) in DAPT-treated IC-032 cells compared with DMSO. H, I Heatmap showing the level of expression of a selection of interested genes in DAPT-treated cells compared with DMSO in CHLA-02 (H) and in IC-032 (I) cell lines. Color codes at the left and at the top of the heatmaps are shown below the figure. Source data are provided as a Source Data file.

References

    1. Lee RS, et al. A remarkably simple genome underlies highly malignant pediatric rhabdoid cancers. J. Clin. Invest. 2012;122:2983–2988. - PMC - PubMed
    1. Johann PD, et al. Atypical Teratoid/Rhabdoid tumors are comprised of three epigenetic subgroups with distinct enhancer landscapes. Cancer Cell. 2016;29:379–393. - PubMed
    1. Torchia J, et al. Integrated (epi)-genomic analyses identify subgroup-specific therapeutic targets in CNS Rhabdoid tumors. Cancer Cell. 2016;30:891–908. - PMC - PubMed
    1. Ho B, et al. Molecular subgrouping of atypical teratoid/rhabdoid tumors - A reinvestigation and current consensus. Neuro. Oncol. 2020;22:613–624. - PMC - PubMed
    1. Chun, H.-J. E. et al. Identification and analyses of extra-cranial and cranial rhabdoid tumor molecular subgroups reveal tumors with cytotoxic T cell infiltration. Cell Rep. 10.1016/j.celrep.2019.10.013 (2019). - PMC - PubMed

Publication types