. 2023 Oct 20;14(1):6639.
doi: 10.1038/s41467-023-42428-7.

The transcription factor Zeb1 controls homeostasis and function of type 1 conventional dendritic cells

Affiliations

The transcription factor Zeb1 controls homeostasis and function of type 1 conventional dendritic cells

Yan Wang et al. Nat Commun. .

Abstract

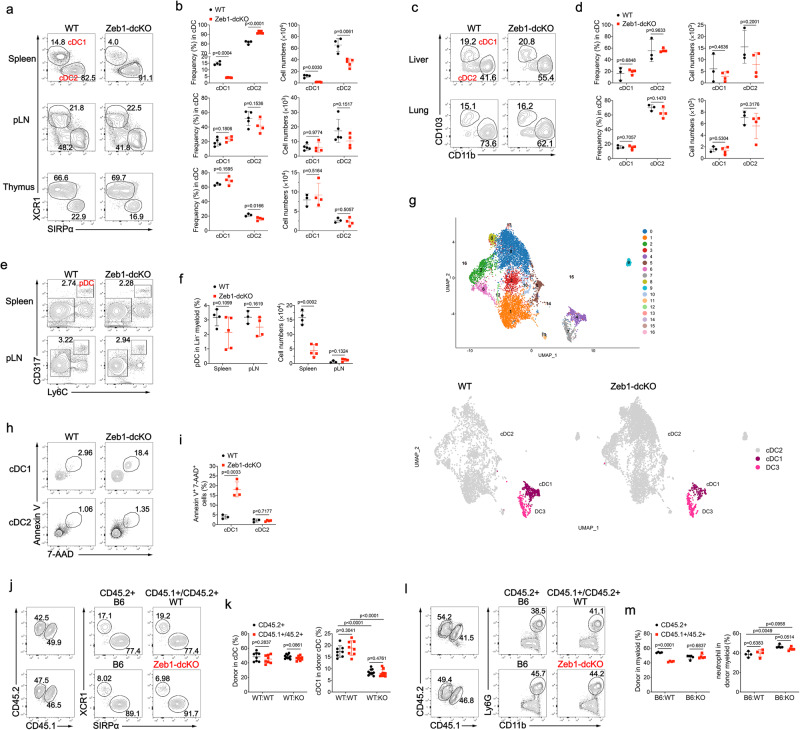
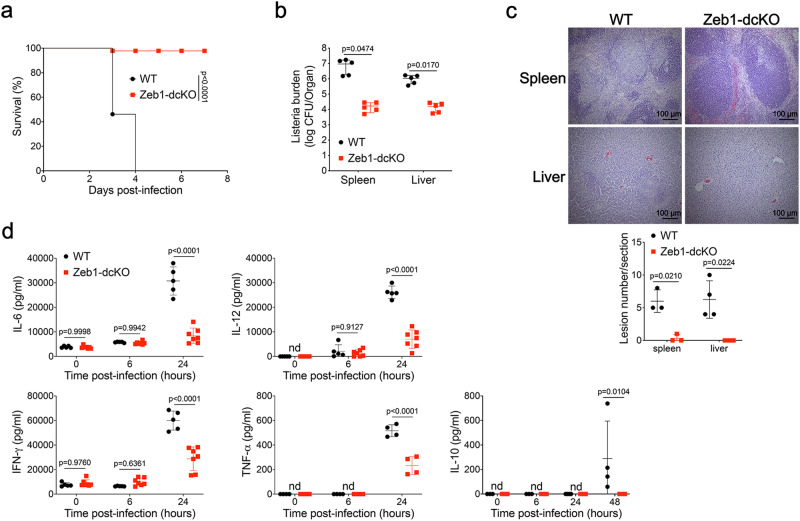
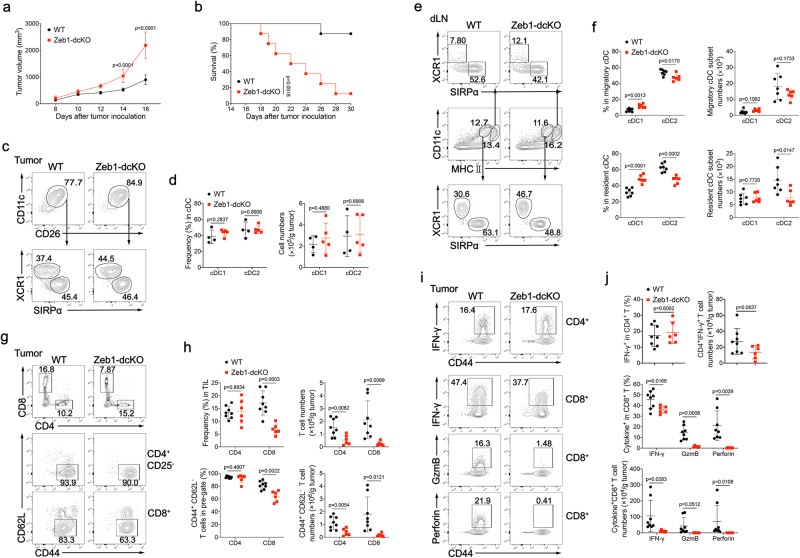
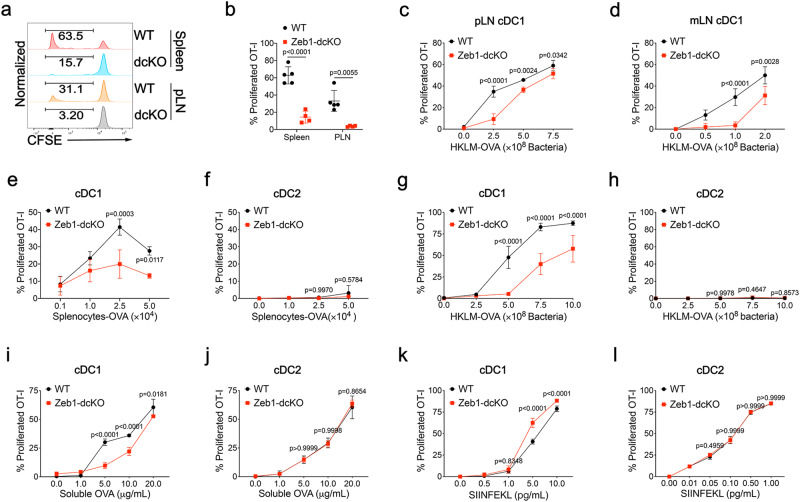
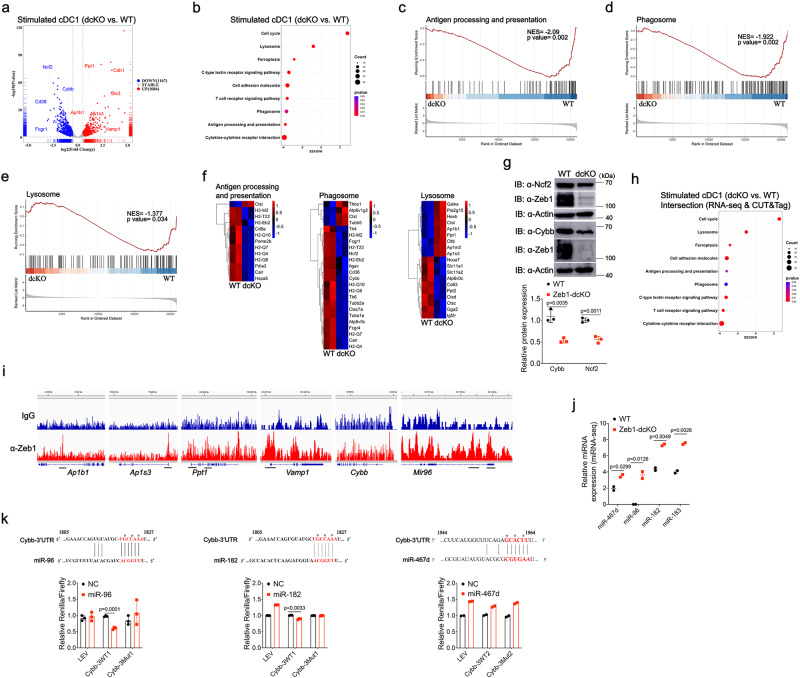
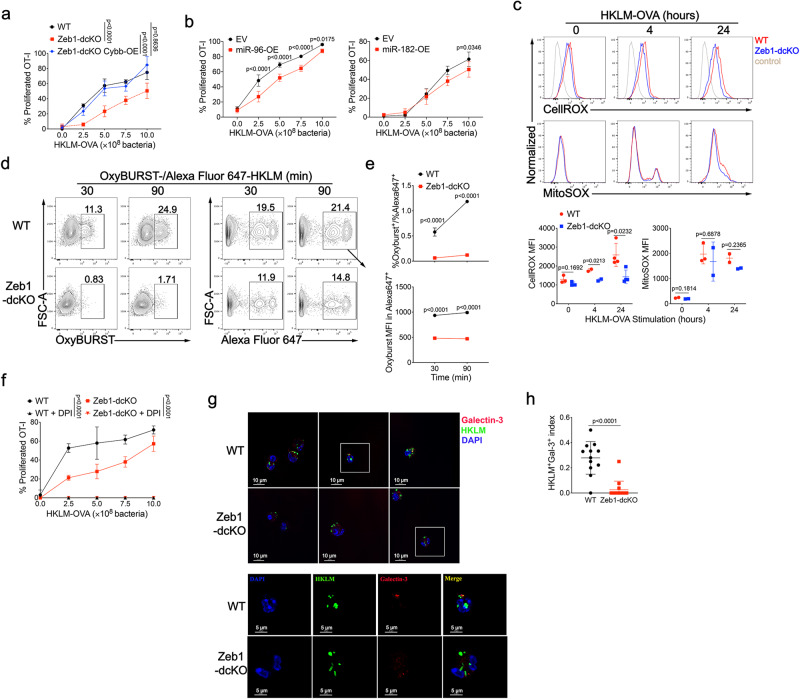
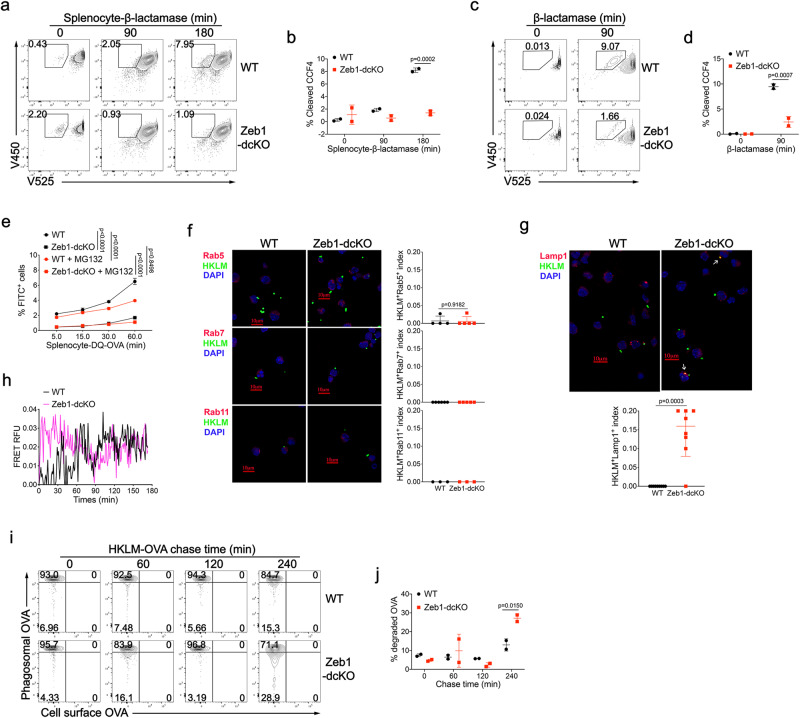
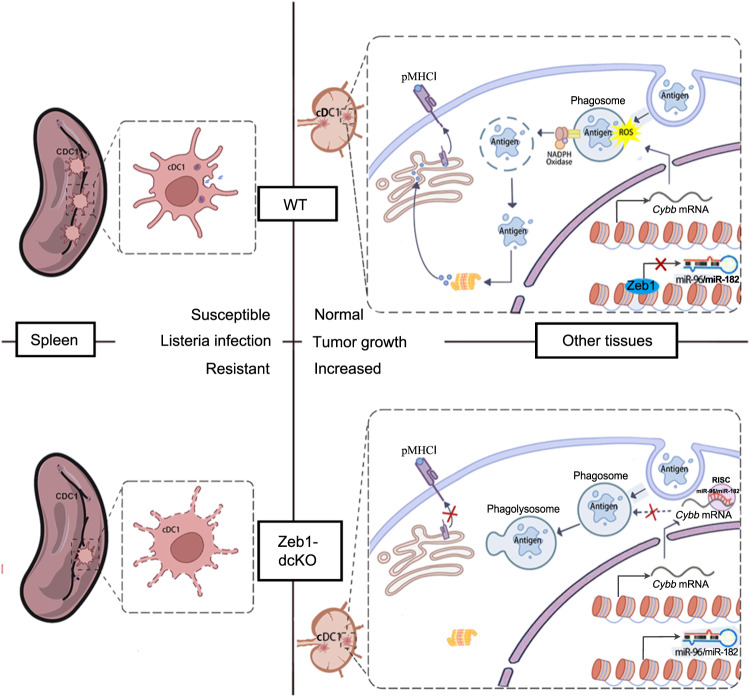
Type 1 conventional dendritic cells (cDC1) are the most efficient cross-presenting cells that induce protective cytotoxic T cell response. However, the regulation of their homeostasis and function is incompletely understood. Here we observe a selective reduction of splenic cDC1 accompanied by excessive cell death in mice with Zeb1 deficiency in dendritic cells, rendering the mice more resistant to Listeria infection. Additionally, cDC1 from other sources of Zeb1-deficient mice display impaired cross-presentation of exogenous antigens, compromising antitumor CD8+ T cell responses. Mechanistically, Zeb1 represses the expression of microRNA-96/182 that target Cybb mRNA of NADPH oxidase Nox2, and consequently facilitates reactive-oxygen-species-dependent rupture of phagosomal membrane to allow antigen export to the cytosol. Cybb re-expression in Zeb1-deficient cDC1 fully restores the defective cross-presentation while microRNA-96/182 overexpression in Zeb1-sufficient cDC1 inhibits cross-presentation. Therefore, our results identify a Zeb1-microRNA-96/182-Cybb pathway that controls cross-presentation in cDC1 and uncover an essential role of Zeb1 in cDC1 homeostasis.


Conflict of interest statement

The authors declare no competing interests.

Figures

Fig. 1
Fig. 1. DC-specific ablation of Zeb1 selectively reduced splenic cDC1.
a Flow cytometry of cDC in spleen (top row), pLN (middle row) and thymus (bottom row) from WT and Zeb1-dcKO mice. b Frequencies and numbers of XCR1+SIRPα- cDC1 and XCR1-SIRPα+ cDC2 among cDC in spleen, pLN, thymus from mice as in a (spleen: WT, n = 4; Zeb1-dcKO, n = 5; pLN: WT, n = 5; Zeb1-dcKO, n = 4; thymus: WT, n = 3; Zeb1-dcKO, n = 4). c Flow cytometry of cDC in liver (top row) and lung (bottom row) from WT and Zeb1-dcKO mice. d Frequencies and numbers of CD103+CD11b cDC1 and CD103-CD11b+ cDC2 among cDC in liver, lung from mice as in c (WT, n = 3; Zeb1-dcKO, n = 4). e Flow cytometry of Lin- myeloid cells (Lin-=CD3-CD19- hereinafter) in spleen (top row) and pLN (bottom row) from WT and Zeb1-dcKO mice. f Frequency and number of CD317+Ly6C+ pDC among Lin- myeloid cells from mice as in e (spleen, WT, n = 4; Zeb1-dcKO, n = 4; pLN, WT, n = 3; Zeb1-dcKO, n = 4). g UMAP plot showing unsupervised clustering of total splenic cDC (top row) and the population individually (bottom row) from WT and Zeb1-dcKO mice by scRNA-seq analysis. h Flow cytometry of splenic cDC1 (top row) and cDC2 (bottom row) from WT and Zeb1-dcKO mice. i Frequencies of dying (Annexin V+ 7-AAD+) splenic cDC1 and cDC2 among total cDC1 or cDC2 from mice as in h (WT, n = 3; Zeb1-dcKO, n = 4). j Flow cytometry of splenic cDC from mixed BM chimeric mice. k Frequencies of donor cDC (among total cDC) and cDC1 (among donor cDC) in spleen from mixed BM chimeric mice as in j (B6:WT, n = 8; B6:KO, n = 10). l Flow cytometry of CD11b+ cells in spleen of mixed BM chimeric mice. m Frequencies of donor CD11b+ cells (among total CD11b+ cells) and CD11b+Ly6G+ neutrophils cells (among donor CD11b+ cells) in spleen of mixed BM chimeric mice as in l (B6:WT, n = 4; B6:KO, n = 5). Each symbol represents an individual mouse, small horizontal lines indicate the mean (± s.d.). Data are representative of two (hm) or three (af) independent experiments. Data are presented as mean ± s.d. Statistical analysis was performed using two-tailed unpaired Student’s t-test. Source data are provided as a Source Data file.
Fig. 2
Fig. 2. DC-specific Zeb1-deficient mice are resistant to Listeria infection.
a Survival of WT and Zeb1-dcKO mice infected intravenously (i.v.) with 1 × 106 CFU of L. monocytogenes (n = 10). b Listeria CFUs per spleen and liver of WT and Zeb1-dcKO mice at day 2 after i.v. infection with 2.5 × 104 CFU of L. monocytogenes (n = 5). c Histopathology (H&E) of spleen and liver from WT and Zeb1-dcKO mice at day 2 after i.v. infection with 2.5 × 104 CFU of L. monocytogenes (scale bars: 100 μm). Numbers of lesions in the sections were enumerated and shown at the bottom. d ELISA of cytokines secreted to serum of WT and Zeb1-dcKO mice at indicated time points after i.v. infection with 1 × 106 CFU of L. monocytogenes (WT, n = 5; Zeb1-dcKO, n = 7; For IL-10, n = 4). Each symbol represents an individual mouse, small horizontal lines indicate the mean (± s.d.). Data are representative of three independent experiments. Data are presented as mean ± s.d. nd: not detected. Statistical analysis was performed using two-tailed unpaired Student’s t-test (b) or two-way ANOVA with Sidak’s multiple comparisons test (d), or log-rank (Mantel–Cox) test of survival curve (a). Source data are provided as a Source Data file.
Fig. 3
Fig. 3. DC-specific deletion of Zeb1 impairs antitumor immunity.
Tumor growth (a) and survival curves (b) of WT and Zeb1-dcKO mice injected subcutaneously (s.c.) with 2 × 105 B16F10 melanoma cells (n = 8). c Flow cytometry of Lin-CD45+CD64-F4/80-MHC II + myeloid cells was used to identify cDC1 (XCR1+SIRPα) and cDC2 (XCR1SIRPα+) subsets in tumor from WT and Zeb1-dcKO mice at day 12 after s.c. injection with 2 × 105 B16F10 melanoma cells. d Frequencies and numbers of cDC1 and cDC2 among CD11c+CD26+ cDC in tumors of WT and Zeb1-dcKO mice as in c (WT, n = 4; Zeb1-dcKO, n = 5). e Flow cytometry of live LinLy6C myeloid cells was used to identify migratory and resident cDC1 and cDC2 in tumor dLN of mice as in c. f Frequencies and numbers of cDC1 and cDC2 among migratory or resident cDC in tumor dLN of mice as in c (WT, n = 7; Zeb1-dcKO, n = 6). g Flow cytometry of tumor infiltrating leukocytes (TILs) (top row), TIL CD4+ T cells (middle row), TIL CD8+ T cells (bottom row) in tumor from mice as in c. h Frequencies and numbers of TIL CD4+ or CD8+ T cells (among TILs) (top row) and CD44+CD62L CD4+ (among TIL CD4+ T cells) or CD44+CD62L CD8+ (among TIL CD8+ T cells) activated T cells (bottom row) in tumor from mice as in c (WT, n = 8; Zeb1-dcKO, n = 6). i Flow cytometry of TIL CD4+ T cells (Top row), TIL CD8+ T cells (bottom rows) in tumor from mice as in c. j Frequencies and numbers of IFN-γ-producing CD4+ T cells (among TIL CD4+ T cells) and of IFN-γ-, Granzyme B- and Perforin-producing CD8+ T cells (among TIL CD8+ T cells) in tumor from mice as in c (WT, n = 8; Zeb1-dcKO, n = 6). Each symbol represents an individual mouse, small horizontal lines indicate the mean (±s.d.). Data are representative of three independent experiments. Data are presented as mean ± s.d. Statistical analysis was performed using two-tailed unpaired Student’s t-test (d, f, h, j), or two-way ANOVA with Sidak’s multiple comparisons test (a), or log-rank (Mantel–Cox) test of survival curve (b). Source data are provided as a Source Data file.
Fig. 4
Fig. 4. Zeb1 is selectively required for cross-presentation by cDC1.
a Flow cytometry of OT-I T cells from WT and Zeb1-dcKO mice receiving adoptive transfer of 5 × 105 CFSE-labeled OT-I T cells, at day 3 after i.v. immunization of 5 × 105 irradiated ovalbumin (OVA)-loaded β2m−/− splenocytes. b Frequency of CFSE-CD44+ OT-I T cells among total OT-I T cells from mice as in a (WT, n = 5; Zeb1-dcKO, n = 4). Each symbol represents an individual mouse, small horizontal lines indicate the mean (± s.d.). cDC1 sorted from pLNs (c) or mLNs (d) of WT and Zeb1-dcKO mice were cultured for 3 days with CFSE-labeled OT-I T cells and different dose of HKLM-OVA, and assayed for OT-I proliferation and activation (CFSE-CD44+). WT and Zeb1-deficient Flt3L-cDC1 (e) or Flt3L-cDC2 (f) were cultured and analyzed as described in c and d, with different dose of irradiated OVA-loaded β2m-/- splenocytes as antigens. Flt3L-cDC1 (g) or Flt3L-cDC2 (h) of both genotypes were cultured and analyzed as described in c and d, with various dose of HKLM-OVA as antigens. Flt3L-cDC1 (i) or Flt3L-cDC2 (j) of both genotypes were cultured and analyzed as described in c and d, with various dose of soluble OVA as antigens. Flt3L-cDC1 (k) or Flt3L-cDC2 (l) of both genotypes were cultured and analyzed as described in c and d, with different amounts of SIINFEKL peptides as antigens. Data are representative of three independent experiments. Data are presented as mean ± s.d. Statistical analysis was performed using two-tailed unpaired Student’s t-test (b) or two-way ANOVA with Sidak’s multiple comparisons test (cl). Source data are provided as a Source Data file.
Fig. 5
Fig. 5. Integrated analysis of transcriptomes and Zeb1 occupancy identifies Zeb1 target genes that support cross-presentation.
a Volcano plot illustrating DEGs in WT and Zeb1-deficient Flt3L-cDC1 challenged with HKLM-OVA for 4 h (n = 2). b Bubble plot depicting KEGG pathway analysis of DEGs in WT and Zeb1-deficient Flt3L-cDC1 after stimulation as in a (n = 2). GSEA profiles of KEGG pathways of antigen processing and presentation (c), phagosome (d), lysosome pathway (e), in WT and Zeb1-deficient Flt3L-cDC1 after stimulation as in a. f Heatmaps of differentially expressed signature genes in pathways of antigen processing and presentation, phagosome and lysosome in WT and Zeb1-deficient Flt3L-cDC1 after stimulation as in a (n = 2). g Immunoblot analysis of NOX2 subunits Cybb and Ncf2 in WT and Zeb1-deficient Flt3L-cDC1 after stimulation with HKLM-OVA for 4 h. Relative protein level is quantified by normalization to actin protein (n = 3, from 3 independent experiments). h Bubble plot presenting KEGG pathway analysis of DEGs in intersection of Zeb1-regulated genes obtained from above bulk RNA-seq and Zeb1-bound genes obtained from CUT&Tag with Flt3L-cDC1 after stimulation. i Integrative Genomics Viewer (IGV) showing Zeb1 binding peaks (CUT&Tag) in indicated gene loci of WT Flt3L-cDC1 challenged with HKLM-OVA for 4 h. j miRNA-seq illustrating expression levels of the indicated miRNAs in WT and Zeb1-deficient Flt3L-cDC1 challenged with HKLM-OVA for 4 h (n = 2 biologically independent samples in one experiment). k Relative luciferase activity in HEK293T cells transfected with dual reporter vector containing WT or mutated miR-96/182- or miR-467d-binding sites in Cybb together with empty or miR-96- or miR-182- or miR-467d-expressing vector. Renilla luciferase activity is normalized to firefly luciferase activity. * marked on nucleotides represents mutated sites. Each symbol represents an individual sample, small horizontal lines indicate the mean (±s.d.). Data are representative of three independent experiments (g, k) (error bars, s.d.). Data are presented as mean ± s.d. Statistical analysis was performed using two-tailed unpaired Student’s t-test. Source data are provided as a Source Data file.
Fig. 6
Fig. 6. Zeb1 controls phagosomal ROS-dependent rupture of phagosomal membrane in cDC1.
a WT or Zeb1-deficient Flt3L-cDC1, or Zeb1-deficient Flt3L-cDC1 lentivirally transduced with Cybb containing synonymously mutated miR-96 binding sites were cultured for 3 days with CFSE-labeled OT-I T cells and different dose of HKLM-OVA and assayed for OT-I proliferation and activation (CFSE-CD44+). b WT Flt3L-cDC1 retrovirally transduced with empty vector (EV) or miR-96 or miR-182 were cultured and analyzed as described in (a), with various dose of HKLM-OVA as antigens. c Intracellular and mitochondrial ROS production in WT and Zeb1-deficient Flt3L-cDC1 challenged with HKLM-OVA for indicated times, were measured by flow cytometric analysis of CellROX and MitoSOX fluorescence. The mean fluorescent intensity (MFI) of CellROX and MitoSOX fluorescence were quantified at the bottom. d, e Phagosomal ROS production in WT and Zeb1-deficient Flt3L-cDC1 exposed with OxyBURST/Alexa Fluor 647-conjugated HKLM-OVA for indicated times, were measured by flow cytometric analysis (d) of OxyBURST and Alexa Fluor 647 fluorescence. The phagosomal ROS production was quantified as the ratio of OxyBURST+ cells to Alexa Fluor 647+ cells (e, top row) or MFI of OxyBURST in Alexa Fluor 647+ cells (e, bottom row). f WT and Zeb1-deficient Flt3L-cDC1 were cultured with HKLM-OVA for 30 min, and treated with or without DPI (10 μM) for 4 h before addition of CFSE-labeled OT-I T cells, and assayed for OT-I proliferation and activation (CFSE-CD44+). g, h Confocal microscope images of mCherry::galectin-3-expressed WT and Zeb1-deficient Flt3L-cDC1 challenged with Alexa Fluor 647-labeled HKLM-OVA. Colocalizing signal of Galectin-3+HKLM+ cells were counted and plotted as a ratio of total HKLM+ cells. Each symbol represents an individual sample, small horizontal lines indicate the mean (±s.d.). Data are representative of three independent experiments. Data are presented as mean ± s.d. Statistical analysis was performed using Two-tailed unpaired Student’s test (h) or two-way ANOVA with Tukey’s (a, f) or Sidak’s (b, e) multiple comparisons test. Source data are provided as a Source Data file.
Fig. 7
Fig. 7. Zeb1 deficiency prevents antigen export to the cytosol and enhances phago-lysosome fusion in cDC1.
CCF4-loaded WT and Zeb1-deficient Flt3L-cDC1 were incubated with irradiated β-lactamase-loaded β2m−/− splenocytes (a, b) or soluble β-lactamase (c, d) for indicated times. The cleavage of CCF4 was monitored as change in CCF4 fluorescence by flow cytometry (a, c). The efficiency of antigen export to the cytosol was quantified as frequency of cleaved-CCF4+ cells (b, d) (n = 2). e WT and Zeb1-deficient Flt3L-cDC1 were incubated with irradiated DQ-OVA-loaded β2m-/- splenocytes in the presence or absence of MG132 for indicated times, and percentages of FITC+ cells were monitored by flow cytometry (n = 3). Confocal microscope images of WT and Zeb1-deficient Flt3L-cDC1 stained with anti-Rab5, anti-Rab7, anti-Rab11 (f) or anti-Lamp1 (g) antibodies 4 h after phagocytosis of Alexa Fluor 647-labeled HKLM-OVA. Colocalizing signal of Rab5+HKLM+, Rab7+HKLM+, Rab11+HKLM+ or Lamp1+HKLM+ were counted and plotted as a ratio of total HKLM+ cells. h Phago-lysosome fusion was measured by exposing WT and Zeb1-deficient Flt3L-cDC1 loaded with lysosomal FRET acceptor Alexa Fluor 594-Hydrazide to donor Alexa Fluor 488-labeled HKLM-OVA. Fluorescent measurement was taken every 1 min for 3 h. i Flt3L-cDC1 were allowed to internalize HKLM-OVA at 16 °C and incubated for indicated chase periods at 37 °C to allow phagosome maturation. Organelles from lysed cells were analyzed for phagosomal OVA and non-internalized cell surface OVA by flow cytometry. j The degradation of phagosomal OVA was quantified as frequency of phagosomes containing decreased abundance of OVA (n = 2). Each symbol represents an individual sample or section, small horizontal lines indicate the mean (±s.d.). Data are representative of three independent experiments. Data are presented as mean ± s.d. Statistical analysis was performed using Two-tailed unpaired Student’s test (g) or two-way ANOVA with Tukey’s (e) or Sidak’s (b, d, j) multiple comparisons test. Source data are provided as a Source Data file.
Fig. 8
Fig. 8. Proposed model for the role of Zeb1 in homeostasis and function of cDC1.
Zeb1 deficiency in dendritic cells leads to a selective reduction of splenic cDC1, associated with excessive cell death, rendering mice more resistant to Listeria infection. Additionally, cDC1 from other sources of Zeb1-deficient mice display impaired cross-presentation of exogenous antigens, compromising antitumor CD8+ T cell responses. Mechanistically, Zeb1 facilitates the production of phagosomal reactive oxygen species (ROS) by repressing the expression of microRNA-96/182 that targeted Cybb mRNA of NADPH oxidase Nox2. Consequently, loss of Zeb1 in cDC1 diminishes phagosomal ROS and subsequent phagosomal membrane rupture that allows antigen export to the cytosol.

References

    1. Merad M, Sathe P, Helft J, Miller J, Mortha A. The dendritic cell lineage: ontogeny and function of dendritic cells and their subsets in the steady state and the inflamed setting. Annu Rev. Immunol. 2013;31:563–604. doi: 10.1146/annurev-immunol-020711-074950. - DOI - PMC - PubMed
    1. Cabeza-Cabrerizo M, et al. Dendritic cells revisited. Annu Rev. Immunol. 2021;39:131–166. doi: 10.1146/annurev-immunol-061020-053707. - DOI - PubMed
    1. Nutt SL, Chopin M. Transcriptional networks driving dendritic cell differentiation and function. Immunity. 2020;52:942–956. doi: 10.1016/j.immuni.2020.05.005. - DOI - PubMed
    1. Reizis B. Plasmacytoid dendritic cells: development, regulation, and function. Immunity. 2019;50:37–50. doi: 10.1016/j.immuni.2018.12.027. - DOI - PMC - PubMed
    1. Anderson DA, 3rd, Dutertre CA, Ginhoux F, Murphy KM. Genetic models of human and mouse dendritic cell development and function. Nat. Rev. Immunol. 2021;21:101–115. doi: 10.1038/s41577-020-00413-x. - DOI - PMC - PubMed

Publication types