

A novel bidirectional LSTM deep learning approach for COVID-19 forecasting
- PMID: 37863921
- PMCID: PMC10589260
- DOI: 10.1038/s41598-023-44924-8
A novel bidirectional LSTM deep learning approach for COVID-19 forecasting
Abstract
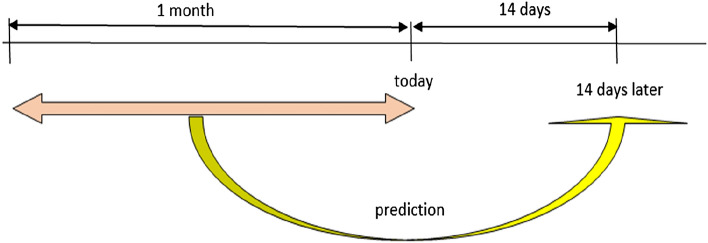
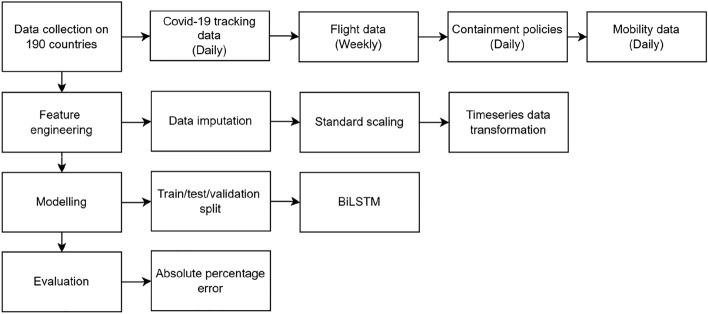
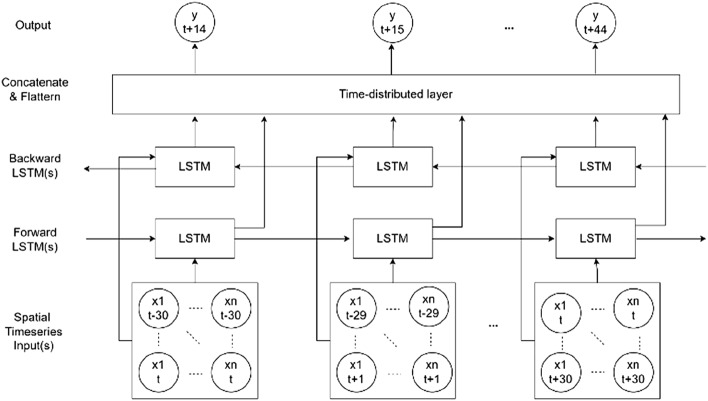
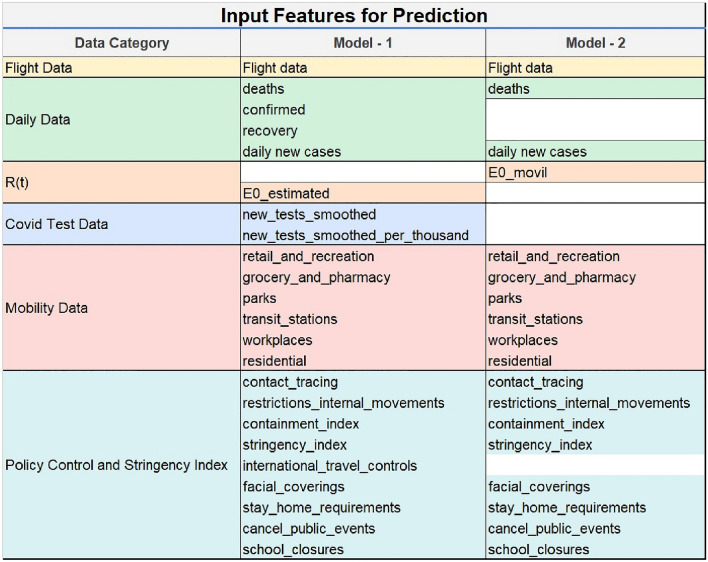
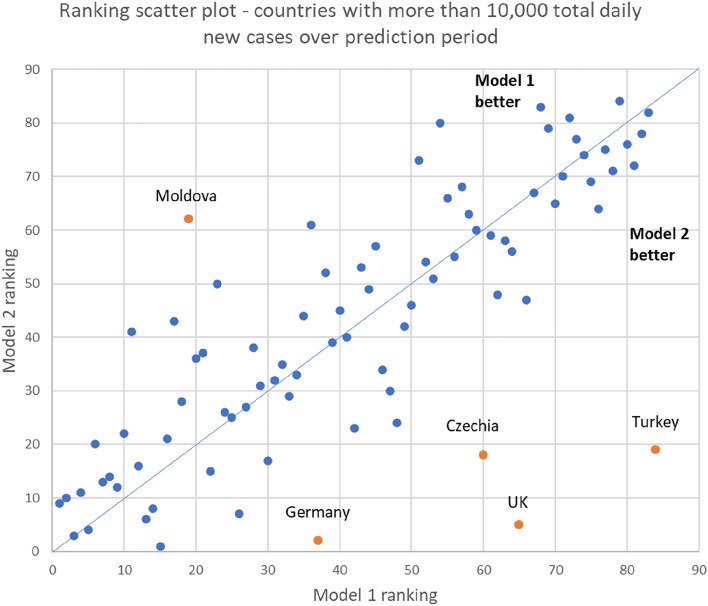
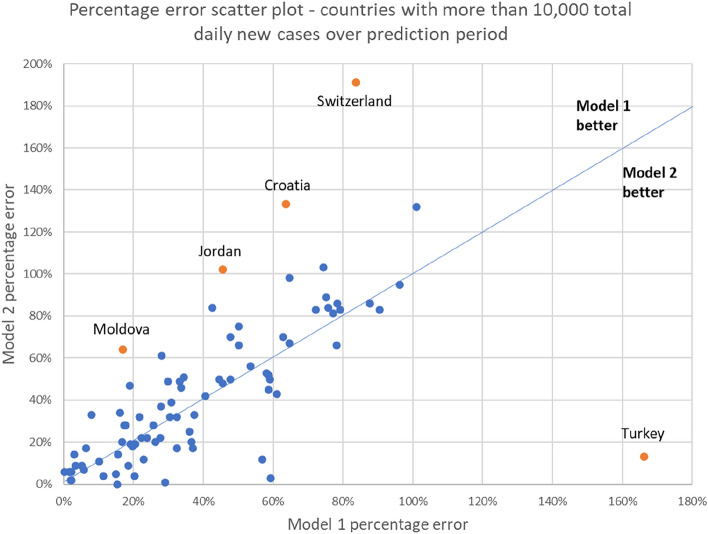
COVID-19 has resulted in significant morbidity and mortality globally. We develop a model that uses data from thirty days before a fixed time point to forecast the daily number of new COVID-19 cases fourteen days later in the early stages of the pandemic. Various time-dependent factors including the number of daily confirmed cases, reproduction number, policy measures, mobility and flight numbers were collected. A deep-learning model using Bidirectional Long-Short Term Memory (Bi-LSTM) architecture was trained on data from 22nd Jan 2020 to 8 Jan 2021 to forecast the new daily number of COVID-19 cases 14 days in advance across 190 countries, from 9 to 31 Jan 2021. A second model with fewer variables but similar architecture was developed. Results were summarised by mean absolute error (MAE), root mean squared error (RMSE), mean absolute percentage error (MAPE), and total absolute percentage error and compared against results from a classical ARIMA model. Median MAE was 157 daily cases (IQR: 26-666) under the first model, and 150 (IQR: 26-716) under the second. Countries with more accurate forecasts had more daily cases and experienced more waves of COVID-19 infections. Among countries with over 10,000 cases over the prediction period, median total absolute percentage error was 33% (IQR: 18-59%) and 34% (IQR: 16-66%) for the first and second models respectively. Both models had comparable median total absolute percentage errors but lower maximum total absolute percentage errors as compared to the classical ARIMA model. A deep-learning approach using Bi-LSTM architecture and open-source data was validated on 190 countries to forecast the daily number of cases in the early stages of the COVID-19 outbreak. Fewer variables could potentially be used without impacting prediction accuracy.
© 2023. Springer Nature Limited.
Conflict of interest statement
The authors declare no competing interests.
Figures
Similar articles
-
A COVID-19 Pandemic Artificial Intelligence-Based System With Deep Learning Forecasting and Automatic Statistical Data Acquisition: Development and Implementation Study.J Med Internet Res. 2021 May 20;23(5):e27806. doi: 10.2196/27806. J Med Internet Res. 2021. PMID: 33900932 Free PMC article.
-
Time series forecasting of new cases and new deaths rate for COVID-19 using deep learning methods.Results Phys. 2021 Aug;27:104495. doi: 10.1016/j.rinp.2021.104495. Epub 2021 Jun 26. Results Phys. 2021. PMID: 34221854 Free PMC article.
-
Water quality assessment of a river using deep learning Bi-LSTM methodology: forecasting and validation.Environ Sci Pollut Res Int. 2022 Feb;29(9):12875-12889. doi: 10.1007/s11356-021-13875-w. Epub 2021 May 14. Environ Sci Pollut Res Int. 2022. PMID: 33988840
-
Predictions for COVID-19 with deep learning models of LSTM, GRU and Bi-LSTM.Chaos Solitons Fractals. 2020 Nov;140:110212. doi: 10.1016/j.chaos.2020.110212. Epub 2020 Aug 19. Chaos Solitons Fractals. 2020. PMID: 32839642 Free PMC article.
-
Application of machine learning in the prediction of COVID-19 daily new cases: A scoping review.Heliyon. 2021 Oct;7(10):e08143. doi: 10.1016/j.heliyon.2021.e08143. Epub 2021 Oct 11. Heliyon. 2021. PMID: 34660935 Free PMC article.
Cited by
-
A dynamic ensemble model for short-term forecasting in pandemic situations.PLOS Glob Public Health. 2024 Aug 22;4(8):e0003058. doi: 10.1371/journal.pgph.0003058. eCollection 2024. PLOS Glob Public Health. 2024. PMID: 39172923 Free PMC article.
References
-
- Worldometers info. https://www.worldometers.info/coronavirus/. Accessed 2021.
-
- Medina-Ortiz D, Contreras S, Barrera-Saavedra Y, Cabas-Mora G, Olivera-Nappa Á. Country-wise forecast model for the effective reproduction number RT of coronavirus disease. Front. Phys. 2020;8:304. doi: 10.3389/fphy.2020.00304. - DOI
-
- Liu, Z., Magal, P., Seydi, O., & Webb, G. Predicting the cumulative number of cases for the COVID-19 epidemic in China from early data. arXiv preprint arXiv:2002.12298 (2020). - PubMed
-
- Peng, L., Yang, W., Zhang, D., Zhuge, C., & Hong, L. Epidemic analysis of COVID-19 in China by dynamical modeling. arXiv preprint arXiv:2002.06563 (2020).
MeSH terms
Substances
LinkOut - more resources
Full Text Sources
Medical
