. 2023 Oct 20;13(1):17971.
doi: 10.1038/s41598-023-44026-5.

Photophysiologically active green, red, and brown macroalgae living in the Arctic Polar Night

Affiliations

Photophysiologically active green, red, and brown macroalgae living in the Arctic Polar Night

Natalie Summers et al. Sci Rep. .

Abstract

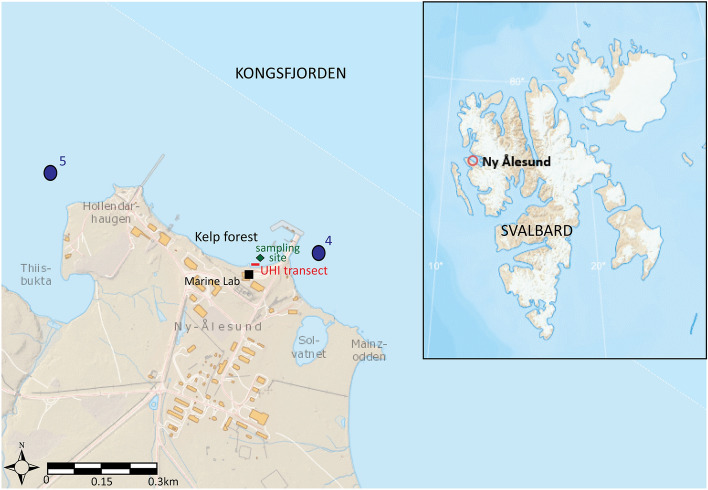
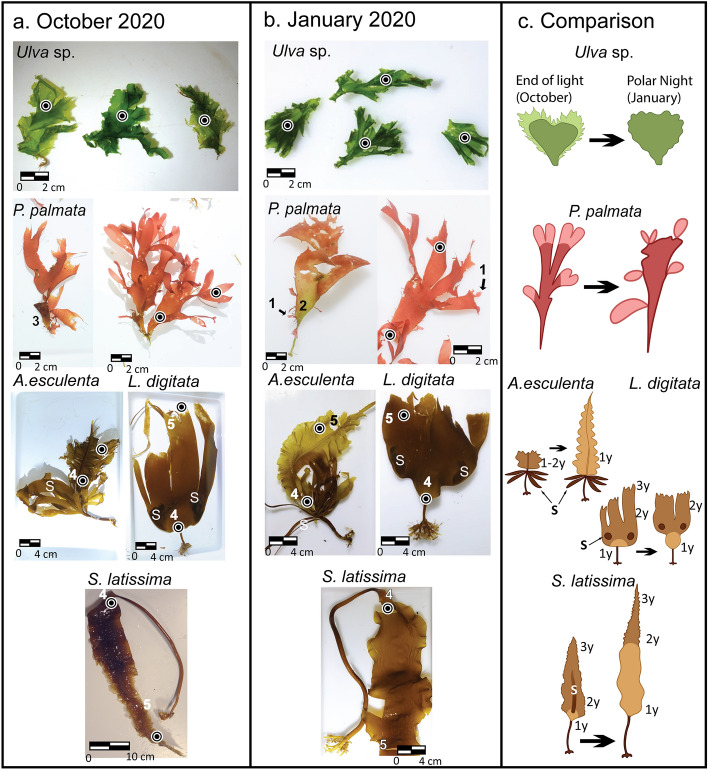
Arctic macroalgae species have developed different growth strategies to survive extreme seasonal changes in irradiance in polar regions. We compared photophysiological parameters such as the light saturation parameter (Ek) and pigment composition of green, red, and brown macroalgae collected in January (Polar Night) and October 2020 (end of the light season). Macroalgae in January appeared healthier (morphologically) and had longer lamina (new growth) than those in October. EK values for red, and brown algae were higher with lower maximum quantum yield of PS II fluorescence (Fv/Fm) in January versus October. Furthermore, in January, new tissues in kelp species had higher EK than the older tissue. Higher EK and lower Fv/Fm during the Polar Night indicates that the photosynthetic apparatus is active but slow. Furthermore, we discuss Chlorophyll (Chl) a emission spectra under blue and green excitation light to determine the ratio of Chl a in photosystem II (PS II) vs photosystem I (PS I). Absorbance spectra of P. palmata was used to interpret the emission spectra. The observed spectral shifts in the absorbance and reflectance spectra of different macroalgae is discussed. Photophysiological methods provide health information complementary to future mapping and monitoring of macroalgae. These results reveal that macroalgae grow new tissue in darkness.


Conflict of interest statement

The authors declare no competing interests.

Figures

Figure 1
Figure 1
Map showing our study area in Kongsfjorden, Svalbard (78°55′40.0"N 11°55′52.9"E). Localization of our macroalgae sampling site (green diamond) next to the UHI transect (red line) from Summers et al. and located in front of the marine lab (black square) in Ny-Ålesund. Location of aerial hyperspectral imaging study sites from Volent et al. are shown as blue dots marked 4 and 5. Base map from https://toposvalbard.npolar.no/, courtesy of the Norwegian Polar Institute.
Figure 2
Figure 2
Macroalgal species collected in October (a) and January (b) 2020 from Kongsfjorden, Svalbard. Black dots show where tissue samples were taken for RLC, in-vivo Chl a emission spectra and pigment analysis. The green algae Ulva sp. had dark and non-degraded tissue on the edge of the lamina in January, while in October the tissue was pale green and degraded on the edges of the lamina. Palmaria palmata had new tissue growing on the edges of the thallus in January (1) often with a greenish thallus base (2), indicating old tissue with a loss of phycoerythrin (2). In October, the main thallus of P. palmata was growing from the thallus of the previous year (3). In the three kelp species, the growth zones are located at the meristem (4) while the older tissue is at the apex of the lamina (5). The sori (S) are also clearly visible for A. esculenta, and L. digitata in both January and October. (c) Sketches show the cycle from the end of the light season in October (left image) to the Polar Night (January, right image) with new tissue in lighter color compared to old tissue (darker). For brown algae, (1y, 2y, 3y) denotes age (in years) of the tissue. The lamina of S. latissima during the Polar Night was 40 to 90 cm long. Illustrations in (c) by Malin Bø Nevstad.
Figure 3
Figure 3
Photosynthetic parameters in green, red, and brown macroalgae, comprising photosynthetic efficiency (α), maximum relative electron transport rate (rETRmax), light saturation parameter (EK), and the maximum quantum yield in the dark (Fv/Fm) derived from RLC measured in (a) October and (b) January. The mean values are represented by dots and the individual measurements (n = 3) are represented by crosses. For statistical significance see RLC section in results.
Figure 4
Figure 4
Pigment concentrations (µg pigment g ww−1) in green, red, and brown macroalgae in new tissue (left box in light brown or red) and old tissue (right box in dark brown or red), as well as between seasons (left: October, right: January). The mean values are represented by dots and the individual measurements (n = 3) are represented by crosses. Pigment nomenclature from with pigment abbreviations as follows: Chl a = chlorophyll a, Chl b = chlorophyll b, Lut = lutein, Neo = neoxanthin, Viola = violaxanthin βε-Car =  βε carotene, ββ-Car =  ββ carotene, Chl c1 + c2 = chlorophyll c1 and c2, Fuco = fucoxanthin, Fuco der = fucoxanthin derivative. For statistical significance see Pigments section in results.
Figure 5
Figure 5
In-vivo Chl a emission spectra from PS II under blue and green excitation light for green, red, and brown algae, measured in October (left) and in January (right). Solid line represents the mean ( n = 3) and the dotted line is the standard deviation.
Figure 6
Figure 6
(a) Normalized spectral absorbance measurements for phycobiliprotein-containing red alga Palmaria palmata. Thick red solid line: total in-vivo pigment absorbance spectra, thin red solid line: absorbance of light harvesting complex II (LHC II) (mainly phycoerythrin, PE) and PS II that provides 95% of Chl a fluorescence signal. Dark red dashed line: Absorbance of light harvesting complex I (LHC I) and PS I (non-fluorescent). The phycobiliprotein peak, dominated by PE, is at 495 nm with a shoulder at 545–560 nm. The Chl a absorbance peaks at 679 nm and 681 nm indicates that the majority of Chl a is bonded to PS I, and the Chl a peak at 676 nm indicates Chl a bonded to PS II, highlighting a spectral shift. Blue and green arrows show the excitation light peaks (452 nm, 525 nm) used for Chl a emission spectra measurements. (b) emission spectra of P. palmata under blue (left) and green (right) excitation light. Light red solid line represents new tissue and dark red solid line represents old tissue with the dotted lines representing standard deviation. (c) In-vivo spectral absorbance and reflectance of whole tissue of green (Ulva sp.), red (P. palmata), and brown (S. latissima) algae, showing spectral shift of Chl a bonded to PS I or PS II. (d) In-vivo reflectance spectra from the Polar Night (January 2020, detailed in Summers et al. ) of green (Ulva sp.), red (P. palmata) and brown algae (average of A. esculenta, L. digitata, and S. latissima). Light colors indicate the standard error.

References

    1. Berge J, et al. Unexpected levels of biological activity during the polar night offer new perspectives on a warming arctic. Curr. Biol. 2015;25:2555–2561. doi: 10.1016/j.cub.2015.08.024. - DOI - PubMed
    1. Johnsen, G., Leu, E. & Gradinger, R. Marine micro- and macroalgae in the Polar Night in Polar Night Marine Ecology Advances in Polar Ecology Vol. 4 (ed. Berge, J., Johnsen, G., Cohen, J.) Ch. 4, 67–112 (Springer, 2020).
    1. Lüning, K. & tom Dieck, I. Environmental triggers in algal seasonality. Botanica Marina32, 389–398, doi:10.1515/botm.1989.32.5.389 (1989).
    1. Raven JA, Hurd CL. Ecophysiology of photosynthesis in macroalgae. Photosynth. Res. 2012;113:105–125. doi: 10.1007/s11120-012-9768-z. - DOI - PubMed
    1. Wang, Y. et al. A comparative study of the photosynthetic capacity in two green tide macroalgae using chlorophyll fluorescence. Springer Plus5, doi:10.1186/s40064-016-2488-7 (2016). - PMC - PubMed

Publication types