. 2023 Oct 20;13(1):17944.
doi: 10.1038/s41598-023-42616-x.

Thermodynamic model of the oxidation of Ln-doped UO2

Affiliations

Thermodynamic model of the oxidation of Ln-doped UO2

V L Vinograd et al. Sci Rep. .

Abstract

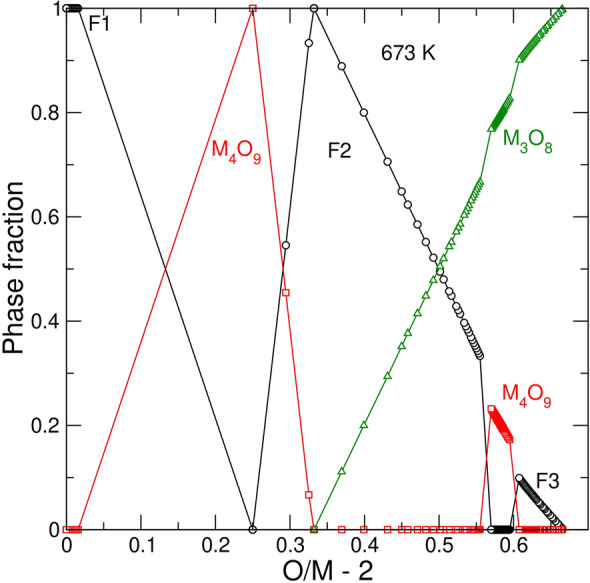
Ln-doped UO2 is often considered as a model system of spent nuclear fuel (SNF) helping to reveal effects of fission and activation products on its chemical stability. Comparing thermodynamics of UO2-UO3 and LnO1.5-UO2-UO3 systems provides a means to understand the phenomenon of an increased resistivity of Ln-doped UO2 to oxidation in air relative to pure UO2. Here a thermodynamic model is developed and is applied to investigate detailed phase changes occurring along the oxidation of Ln-doped fluorite to U3O8. The study proposes that an enhanced resistivity to oxidation of Ln-doped UO2 is likely caused by a thermodynamically driven partitioning of Ln between a fluorite-type phase and a U3O8 polymorph, which at ambient temperatures becomes hindered by slow diffusion.


Conflict of interest statement

The authors declare no competing interests.

Figures

Figure 1
Figure 1
Model fit to the experimental data on ΔGO2=RTln(PO2/P0) vs. δ=x/2 for pure UO2. The experimental data are from Lindemer & Sutton, Nakamura & Fujino and Saito.
Figure 2
Figure 2
Model fit to the experimental data on ΔGO2=RTln(PO2/P0) vs. δ=(x-y)/2 for the system GdO1.5-UO2-UO3. The experimental data are from Lindemer & Sutton. Note, that δ can be written as δ = (x − y)/2, as it is a function of the mole fractions, x and y, of the UO2.5 and LnO1.5 endmembers. δ can be also evaluated as δ = O/M − 2. A negative/positive deviation from δ = 0 implies the presence of either oxygen vacancies or oxygen interstitials. Note also, that δ characterizes non-stoichiometry only of a mono-phase fluorite, while O/M − 2 is also applicable to a poly-phase system. ΔGO2 is a convenient function to visualize effects of the temperature and/or the partial pressure of O2 on the chemical potential of O2, while the dimensionless quantity log(PO2/P0) is more convenient when the temperature and the pressure effects need to be distinguished. Both quantities are used throughout the text.
Figure 3
Figure 3
Model fit to the experimental data on log(PO2/P0) vs. O/M-2 for pure UO2. The experimental data are from Saito . Solid lines correspond to the equilibrium with the hexagonal polymorph of U3O8. The dashed line corresponds to the orthorhombic α-U3O8.
Figure 4
Figure 4
Model fit to the experimental data on log(PO2/P0) vs. O/M-2 for UO2 doped with 4.8 mol % of LaO1.5. The experimental data are from Stadlbauer et al. . Solid lines correspond to the equilibrium with the hexagonal polymorph of M3O8. The dashed line corresponds to the orthorhombic α-M3O8.
Figure 5
Figure 5
Predicted evolution of composition of phases in a sample containing 4.8 mol % of LaO1.5 in the process of equilibrium oxidation at 673 and 873 K. Filled and empty symbols correspond to 873 K and 673 K isotherms, respectively.
Figure 6
Figure 6
Fractions of phases in a sample containing 4.8 mol % of LaO1.5 in the process of equilibrium oxidation at 673 K. Symbols are the same as in Fig. 5.
Figure 7
Figure 7
Variation of the lattice parameter in UO2-NdO1.5 solid solutions predicted from the thermodynamic model. Solid lines are the 1123 K isotherms computed at different values of log(PO2/P0) such that the pressure variation approximately covers the range of redox conditions in the data of Wadier . Dashed lines (red online) are the 1373 and 1673 K isotherms computed at logPO2/P0=0. These isotherms correspond to the synthesis conditions in the study of Keller & Boroujerdi. The other experimental data are from Lee et al., Fukushima et al., Ohmichi et al. and Une & Oguma.

References

    1. Kleykamp H. The chemical state of fission products in oxide fuels at different stages of the nuclear fuel cycle. Nucl. Tech. 1988;80:412–422. doi: 10.13182/NT88-A34065. - DOI
    1. Carbol, P., Wegen, D. H., Wiss, T. & Fors, P. Spent nuclear fuel as waste material in Comprehensive Nuclear Materials (ed. Konings, R.) 389–420 (Elsevier, 2012).
    1. Böhm W, Kiehlmann HD, Neufert A, Peehs M. Gd2O3 up to 9 weight percent, an established burnable poison for advanced fuel management in pressurized water reactors. Kerntechnik. 1987;50:234–240. doi: 10.1515/kern-1987-500411. - DOI
    1. Kim J-S, Kwon S-K, Sanchez M, Cho G-C. Geological storage of high-level nuclear waste. KSCE J. Civ. Eng. 2011;15:721–737. doi: 10.1007/s12205-011-0012-8. - DOI
    1. Kertes AS, Guillaumont R. Solubility of UO2. A comparative review. Nucl. Chem. Waste Manag. 1985;5:215–219. doi: 10.1016/0191-815X(85)90080-4. - DOI