. 2023 Oct 20;13(1):17947.
doi: 10.1038/s41598-023-44919-5.

Combined ultrasound and photoacoustic C-mode imaging system for skin lesion assessment

Affiliations

Combined ultrasound and photoacoustic C-mode imaging system for skin lesion assessment

Anatoly Fedorov Kukk et al. Sci Rep. .

Abstract

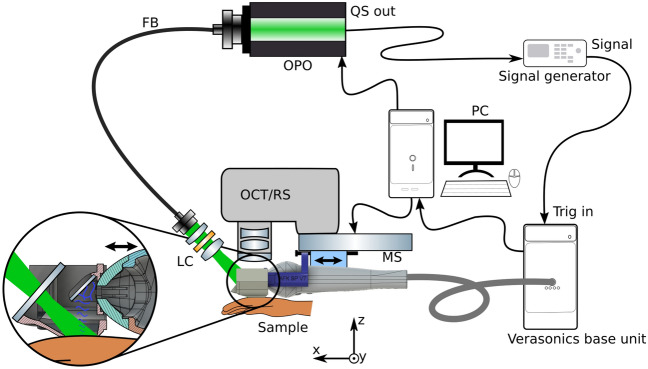
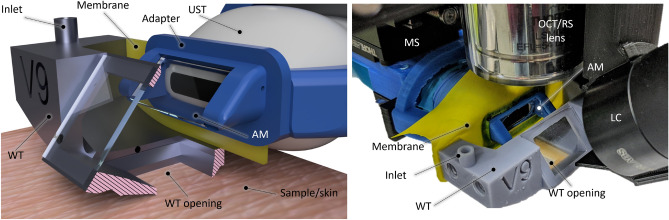
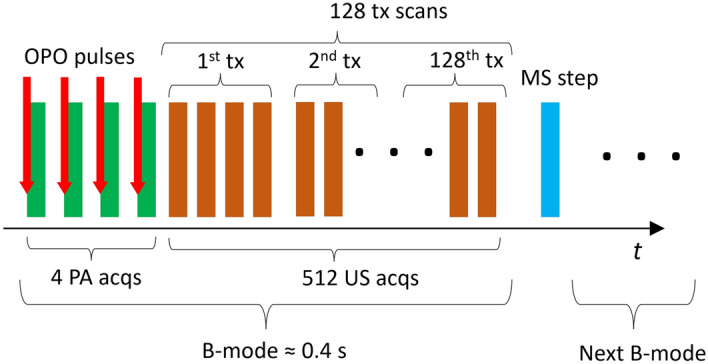
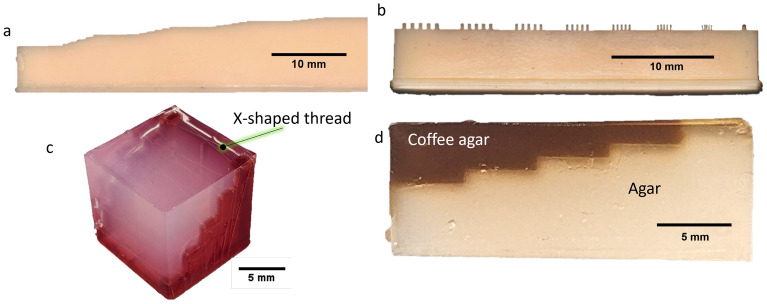
Accurate assessment of the size and depth of infiltration is critical for effectively treating and removing skin cancer, especially melanoma. However, existing methods such as skin biopsy and histologic examination are invasive, time-consuming, and may not provide accurate depth results. We present a novel system for simultaneous and co-localized ultrasound and photoacoustic imaging, with the application for non-invasive skin lesion size and depth measurement. The developed system integrates an acoustical mirror that is placed on an ultrasound transducer, which can be translated within a flexible water tank. This allows for 3D (C-mode) imaging, which is useful for mapping the skin structure and determine the invasion size and depth of lesions including skin cancer. For efficient reconstruction of photoacoustic images, we applied the open-source MUST library. The acquisition time per 2D image is <1 s and the pulse energies are below the legal Maximum Permissible Exposure (MPE) on human skin. We present the depth and resolution capabilities of the setup on several self-designed agar phantoms and demonstrate in vivo imaging on human skin. The setup also features an unobstructed optical window from the top, allowing for simple integration with other optical modalities. The perspective towards clinical application is demonstrated.


Conflict of interest statement

The authors declare no competing interests.

Figures

Figure 1
Figure 1
Sketch of the experimental setup. FB fiber bundle, LC light collimator, MS motorized stage. The US and PA perform B-mode imaging in the y-z plane; by translating the adapter in x direction with defined steps the C-mode is achieved. A photograph and a rendered sketch of the water tank with adapter are shown in Fig. 2.
Figure 2
Figure 2
Left: rendered 3D image of the WT and UST adapter, being positioned on skin (without the OCT/RS setup). The WT is cut in the middle for a better view of the opening and the adapter, revealing the acoustical mirror (AM). Right: photograph of the US/PA setup being placed under the RS/OCT lens. The displayed inlet features a narrow water channel that runs through the WT and terminates just above the opening, making it easier to fill and drain the WT.
Figure 3
Figure 3
Sketch of the PA/US data acquisition sequence. First, the 4 PA measurements are performed, which are followed by 512 measurement events, which complete a full B-mode image. The MS motion and the OPO pulse release is done with a Python script.
Figure 4
Figure 4
Image of agar phantoms for resolution measurements. (a) The “stairs” phantom with different step sizes; (b) the phantom with grooves for lateral resolution measurement; (c) cube agar phantom with floss strain in X shape at different depths; (d) the “coffee stairs” agar for demonstration of PA depth.
Figure 5
Figure 5
The results for resolution measurement on grooves and stairs phantoms. The smallest period/step sizes that could still be distinguished are presented. (a) Smallest groove period (200 µm, at the left side) and (b) step size of 100 µm, measured with US; (c) period of 300 µm  and (d) step of 200 µm, measured with PA, respectively.
Figure 6
Figure 6
Results for the experimentally determined resolution according to Sparrow’s criterion (the smallest separation at which 2 strains can be distinguished) at different depths inside the cube phantom. Left: results for US, right: results for PA. Note: the starting depth of 0 mm is the position at the acoustical focal plane of the transducer, i.e. at 20 mm.
Figure 7
Figure 7
Results for FWHM of US on a single 20 µm thick strain measured at different depths inside an agar phantom. Left: results for US, right: results for PA. Note: the starting depth of 0 mm is the position at the acoustical focal plane of the transducer, i.e. at 20 mm.
Figure 8
Figure 8
US and PA imaging with the coffee agar phantom. Left images are measurements of the 2–3 mm depth steps, right images: 4–5 mm depth. (a,b) US; (c,d) PA; (e,f) combined image with US and PA are shown in grayscale and false color, respectively; (g,h) C-mode representation of the phantoms. The edges of the images are blurred due to the shadowing effect from the 10 mm WT opening, which is more visible with the US imaging. The speckles on the US images are due to the electronic noise caused by the OPO functioning.
Figure 9
Figure 9
Example in vivo measurement on a human nevus. (a) The image of the skin lesion (dark spot at the center) placed inside the WT, taken from the OCT module before the US/PAT measurement. The white, yellow and the green lines mark the imaging area, clipping line and the approximate lesion position in (b) respectively. The dominance of blue color is caused by an optical filter of the OCT/RS module. The blurry horizontal line in the middle is the edge of the acoustical mirror positioned above the opening. (b) C-mode representation of the combined US/PA measurement, which is cut diagonally at the center of the lesion (the dashed yellow lines represent the cutting plane, which intersects the sample at the solid yellow line), revealing the PAT signal. US is shown in grayscale and PAT in false color. (c) The corresponding histological measurement, with yellow line indicating the position of the deepest melanocytic invasion (corresponding Breslow thickness) of 340 µm, measured by a histologist.
Figure 10
Figure 10
Comparison of combined in vivo US/PA measurement on human nevi (left) and the corresponding histological measurements (right). US is represented in grayscale and the PA in false color. The dash lines represent the manual measurement of the lesion borders. Top: a thin lesion from heel area with a Breslow thickness of 1 mm. Bottom: a thicker nevus from abdomen area with average 3 mm thickness and maximal depth of 3.5 mm.

Similar articles

Cited by

References

    1. Bhatia S, Tykodi SS, Thompson JA. Treatment of metastatic melanoma: An overview. Oncology. 2009;23:488. - PMC - PubMed
    1. Maio M, et al. Five-year survival rates for treatment-naive patients with advanced melanoma who received ipilimumab plus dacarbazine in a phase III trial. J. Clin. Oncol. 2015;33:1191. - PMC - PubMed
    1. Song X, et al. Overall survival in patients with metastatic melanoma. Curr. Med. Res. Opin. 2015;31:987–991. - PubMed
    1. Aubuchon M, et al. Epidemiology, management and survival outcomes of primary cutaneous melanoma: A ten-year overview. Acta Chir. Belgica. 2017;117:29–35. - PubMed
    1. Szeimies, R.M., Hauschild, A., Garbe, C., Kaufmann R. & Landthaler, M. Tumoren der Haut: Grundlagen – Diagnostik – Therapie (Georg Thieme Verlag, 2010).

Publication types