

Genome-wide association study in 404,302 individuals identifies 7 significant loci for reaction time variability
- PMID: 37864076
- PMCID: PMC10730420
- DOI: 10.1038/s41380-023-02292-9
Genome-wide association study in 404,302 individuals identifies 7 significant loci for reaction time variability
Abstract
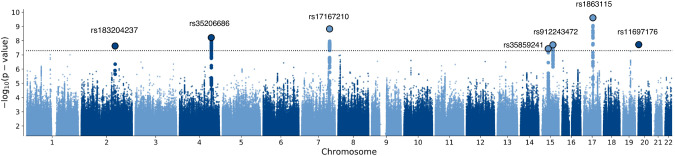
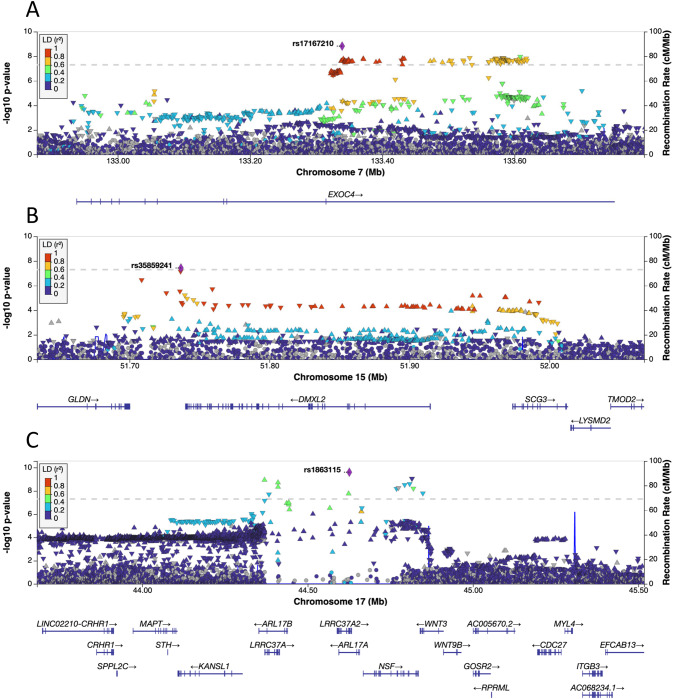
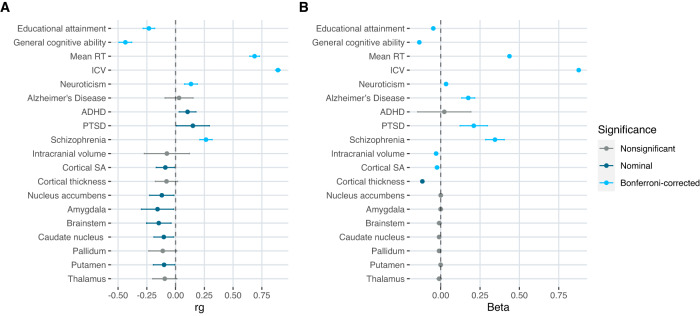
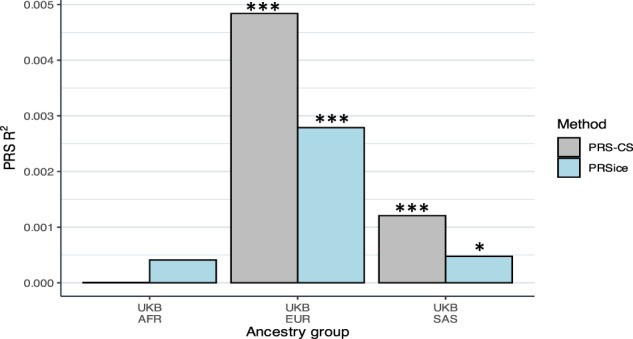
Reaction time variability (RTV), reflecting fluctuations in response time on cognitive tasks, has been proposed as an endophenotype for many neuropsychiatric disorders. There have been no large-scale genome-wide association studies (GWAS) of RTV and little is known about its genetic underpinnings. Here, we used data from the UK Biobank to conduct a GWAS of RTV in participants of white British ancestry (n = 404,302) as well as a trans-ancestry GWAS meta-analysis (n = 44,873) to assess replication. We found 161 genome-wide significant single nucleotide polymorphisms (SNPs) distributed across 7 genomic loci in our discovery GWAS. Functional annotation of the variants implicated genes involved in synaptic function and neural development. The SNP-based heritability (h2SNP) estimate for RTV was 3%. We investigated genetic correlations between RTV and selected neuropsychological traits using linkage disequilibrium score regression, and found significant correlations with several traits, including a positive correlation with mean reaction time and schizophrenia. Despite the high genetic correlation between RTV and mean reaction time, we demonstrate distinctions in the genetic underpinnings of these traits. Lastly, we assessed the predictive ability of a polygenic score (PGS) for RTV, calculated using PRSice and PRS-CS, and found that the RTV-PGS significantly predicted RTV in independent cohorts, but that the generalisability to other ancestry groups was poor. These results identify genetic underpinnings of RTV, and support the use of RTV as an endophenotype for neurological and psychiatric disorders.
© 2023. The Author(s).
Conflict of interest statement
The authors declare the following competing interest: OA has received speaker’s honorarium from Lundbeck and is a consultant for Healthlytix. The remaining authors declare no competing interests.
Figures
Update of
-
Genome-wide association study in 404,302 individuals identifies 7 significant loci for reaction time variability.medRxiv [Preprint]. 2023 Apr 4:2023.04.03.23288056. doi: 10.1101/2023.04.03.23288056. medRxiv. 2023. Update in: Mol Psychiatry. 2023 Sep;28(9):4011-4019. doi: 10.1038/s41380-023-02292-9. PMID: 37066411 Free PMC article. Updated. Preprint.
References
-
- MacDonald SW, Li SC, Bäckman L. Neural underpinnings of within-person variability in cognitive functioning. Psychol Aging. 2009;24:792–808. - PubMed
-
- Haynes BI, Bunce D, Kochan NA, Wen W, Brodaty H, Sachdev PS. Associations between reaction time measures and white matter hyperintensities in very old age. Neuropsychologia. 2017;96:249–55. - PubMed
-
- Bunce D, Bielak AA, Cherbuin N, Batterham PJ, Wen W, Sachdev P, et al. Utility of intraindividual reaction time variability to predict white matter hyperintensities: a potential assessment tool for clinical contexts? J Int Neuropsychol Soc. 2013;19:971–6. - PubMed
-
- Kofler MJ, Rapport MD, Sarver DE, Raiker JS, Orban SA, Friedman LM, et al. Reaction time variability in ADHD: a meta-analytic review of 319 studies. Clin Psychol Rev. 2013;33:795–811. - PubMed
Publication types
MeSH terms
Grants and funding
LinkOut - more resources
Full Text Sources
Medical
