

A systematic review of the data, methods and environmental covariates used to map Aedes-borne arbovirus transmission risk
- PMID: 37864153
- PMCID: PMC10588093
- DOI: 10.1186/s12879-023-08717-8
A systematic review of the data, methods and environmental covariates used to map Aedes-borne arbovirus transmission risk
Abstract
Background: Aedes (Stegomyia)-borne diseases are an expanding global threat, but gaps in surveillance make comprehensive and comparable risk assessments challenging. Geostatistical models combine data from multiple locations and use links with environmental and socioeconomic factors to make predictive risk maps. Here we systematically review past approaches to map risk for different Aedes-borne arboviruses from local to global scales, identifying differences and similarities in the data types, covariates, and modelling approaches used.
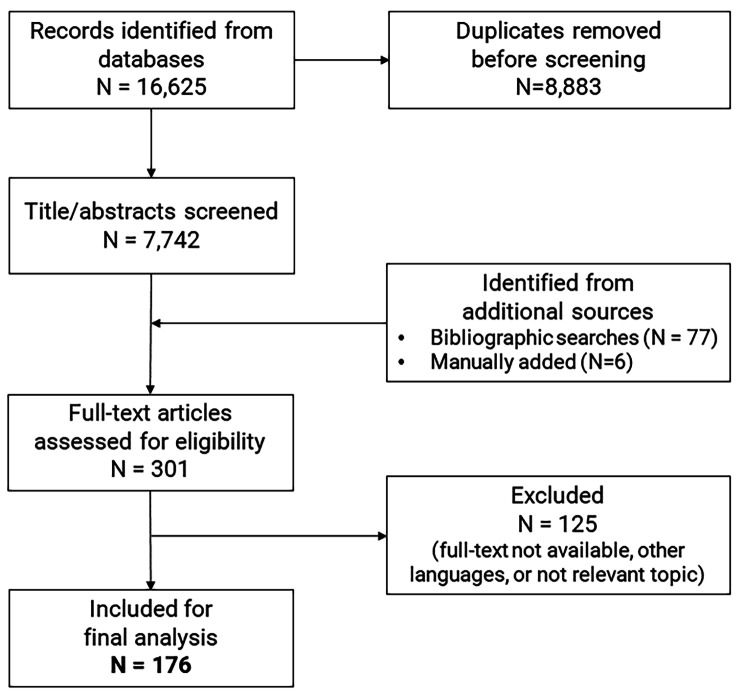
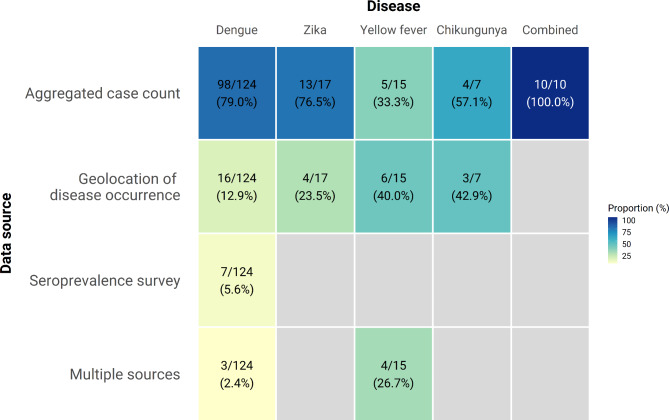
Methods: We searched on-line databases for predictive risk mapping studies for dengue, Zika, chikungunya, and yellow fever with no geographical or date restrictions. We included studies that needed to parameterise or fit their model to real-world epidemiological data and make predictions to new spatial locations of some measure of population-level risk of viral transmission (e.g. incidence, occurrence, suitability, etc.).
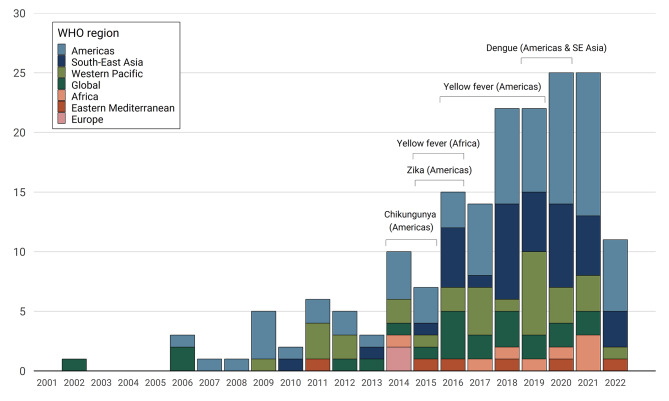
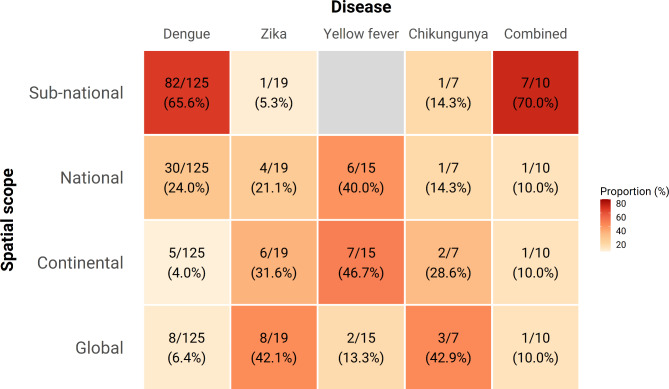
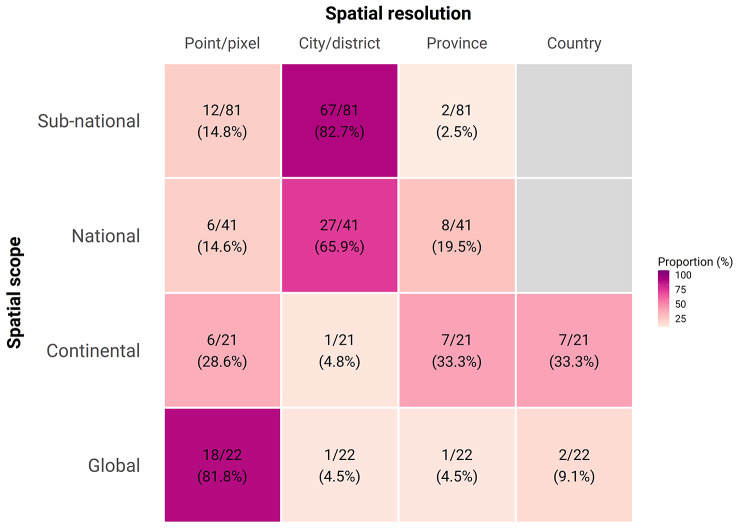
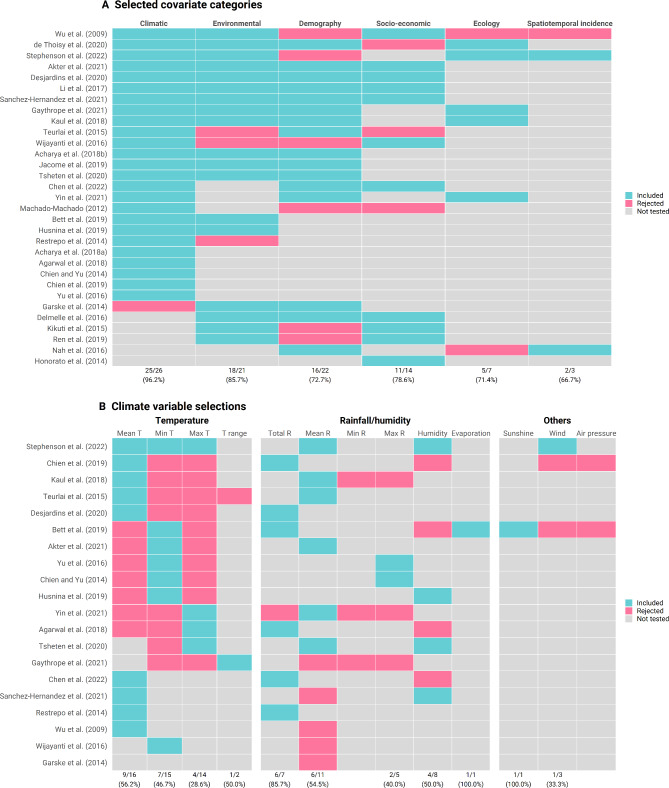
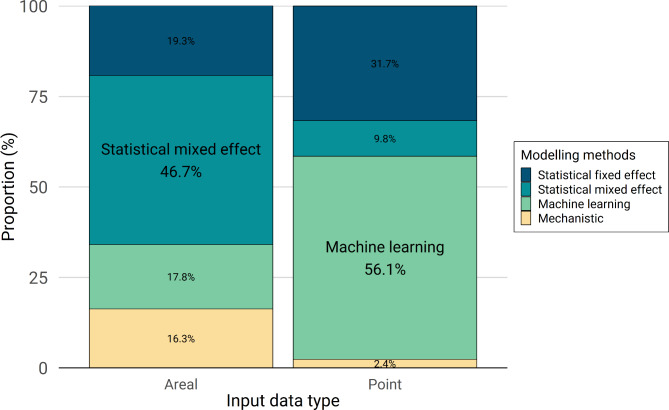
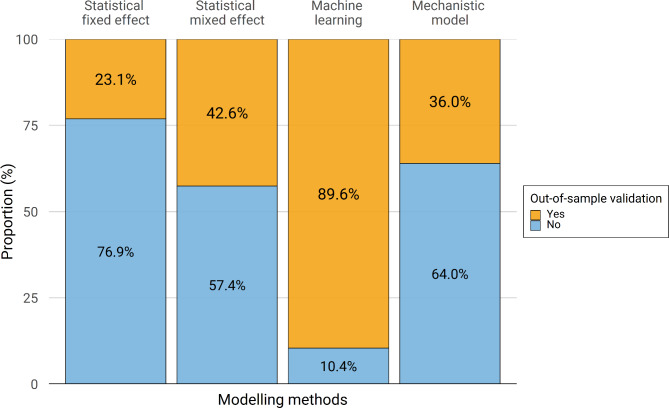
Results: We found a growing number of arbovirus risk mapping studies across all endemic regions and arboviral diseases, with a total of 176 papers published 2002-2022 with the largest increases shortly following major epidemics. Three dominant use cases emerged: (i) global maps to identify limits of transmission, estimate burden and assess impacts of future global change, (ii) regional models used to predict the spread of major epidemics between countries and (iii) national and sub-national models that use local datasets to better understand transmission dynamics to improve outbreak detection and response. Temperature and rainfall were the most popular choice of covariates (included in 50% and 40% of studies respectively) but variables such as human mobility are increasingly being included. Surprisingly, few studies (22%, 31/144) robustly tested combinations of covariates from different domains (e.g. climatic, sociodemographic, ecological, etc.) and only 49% of studies assessed predictive performance via out-of-sample validation procedures.
Conclusions: Here we show that approaches to map risk for different arboviruses have diversified in response to changing use cases, epidemiology and data availability. We identify key differences in mapping approaches between different arboviral diseases, discuss future research needs and outline specific recommendations for future arbovirus mapping.
Keywords: Aedes-borne diseases; Arboviruses; Chikungunya; Dengue; Geostatistical models; Predictive modelling; Risk mapping; Yellow fever; Zika.
© 2023. BioMed Central Ltd., part of Springer Nature.
Conflict of interest statement
The authors declare no competing interests.
Figures
References
-
- Cattarino L, Rodriguez-Barraquer I, Imai N, Cummings DAT, Ferguson NM. Mapping global variation in dengue transmission intensity. Sci Transl Med. 2020;12:eaax4144. - PubMed
Publication types
MeSH terms
Grants and funding
LinkOut - more resources
Full Text Sources
Medical
Miscellaneous
