. 2023 Oct 31;42(10):113305.
doi: 10.1016/j.celrep.2023.113305.

High-calorie diets uncouple hypothalamic oxytocin neurons from a gut-to-brain satiation pathway via κ-opioid signaling

Affiliations

High-calorie diets uncouple hypothalamic oxytocin neurons from a gut-to-brain satiation pathway via κ-opioid signaling

Tim Gruber et al. Cell Rep. .

Abstract

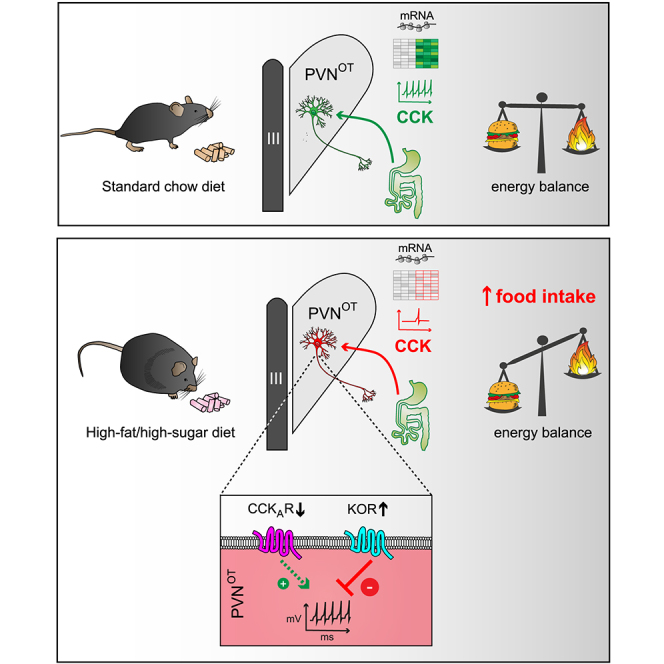
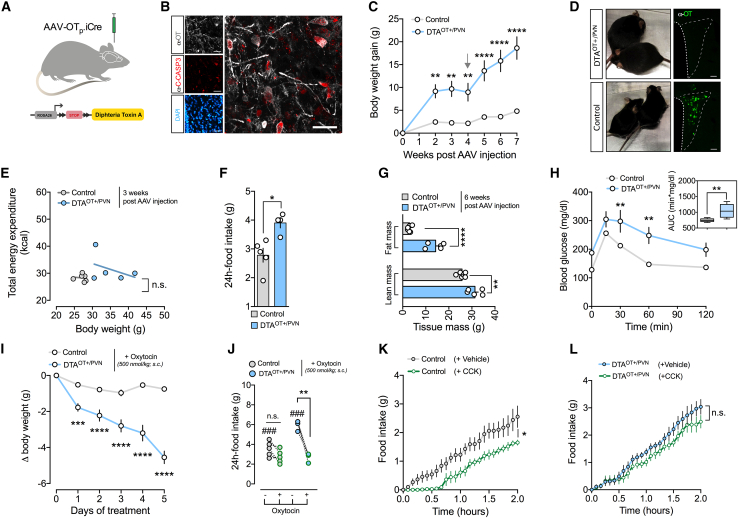
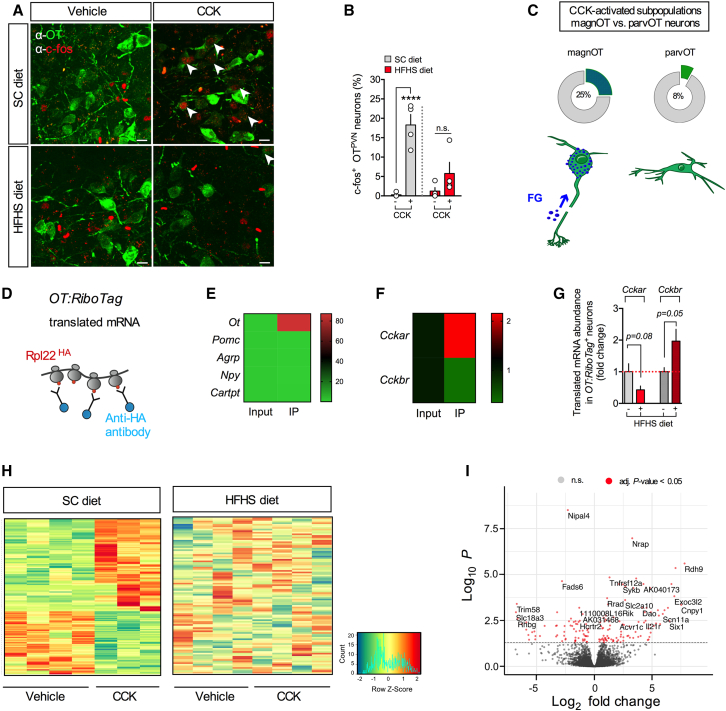
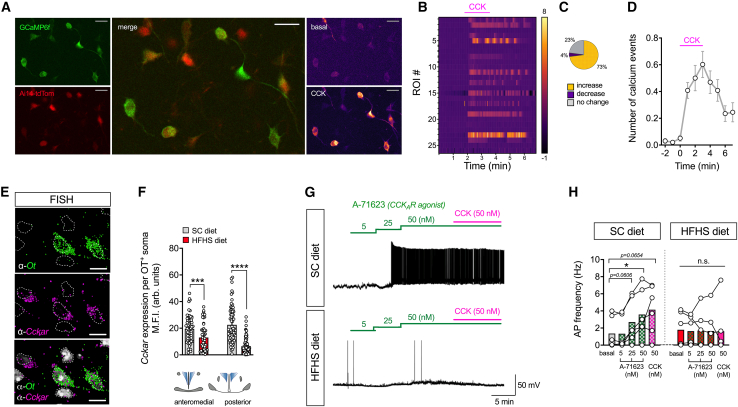
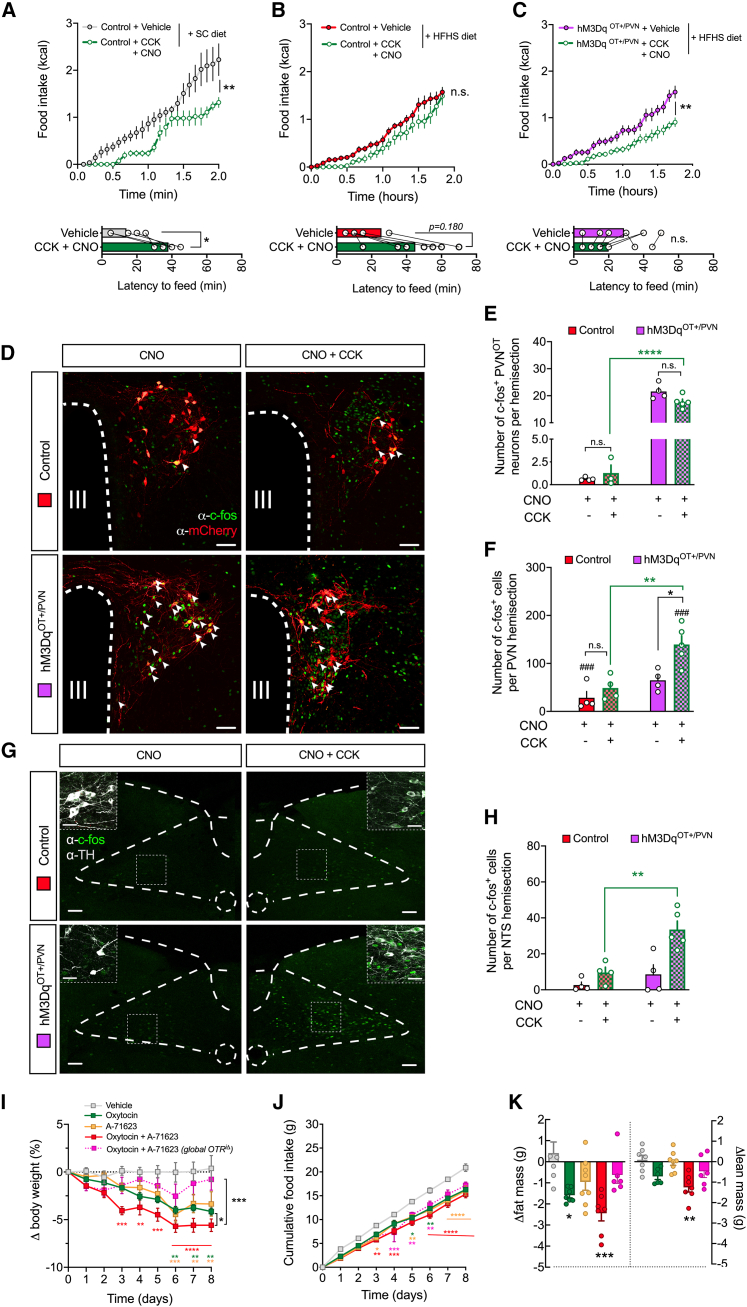
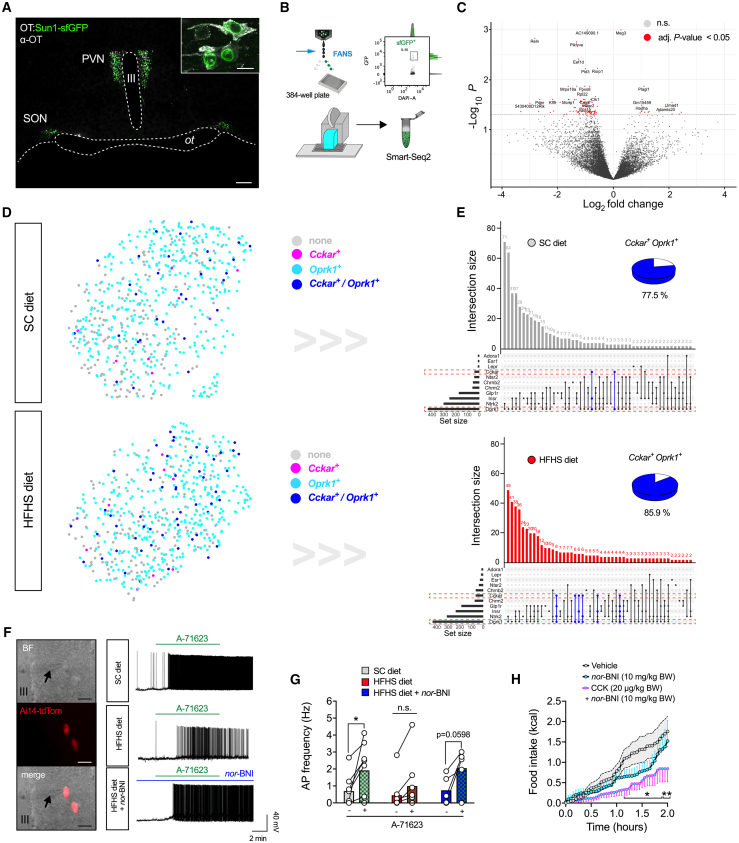
Oxytocin-expressing paraventricular hypothalamic neurons (PVNOT neurons) integrate afferent signals from the gut, including cholecystokinin (CCK), to adjust whole-body energy homeostasis. However, the molecular underpinnings by which PVNOT neurons orchestrate gut-to-brain feeding control remain unclear. Here, we show that mice undergoing selective ablation of PVNOT neurons fail to reduce food intake in response to CCK and develop hyperphagic obesity on a chow diet. Notably, exposing wild-type mice to a high-fat/high-sugar (HFHS) diet recapitulates this insensitivity toward CCK, which is linked to diet-induced transcriptional and electrophysiological aberrations specifically in PVNOT neurons. Restoring OT pathways in diet-induced obese (DIO) mice via chemogenetics or polypharmacology sufficiently re-establishes CCK's anorexigenic effects. Last, by single-cell profiling, we identify a specialized PVNOT neuronal subpopulation with increased κ-opioid signaling under an HFHS diet, which restrains their CCK-evoked activation. In sum, we document a (patho)mechanism by which PVNOT signaling uncouples a gut-brain satiation pathway under obesogenic conditions.

Keywords: CCK; CP: Neuroscience; NTS; PVN; gut hormone; gut-brain axis; neuropeptide; obesity; opioids; oxytocin; paraventricular hypothalamic nucleus.


Conflict of interest statement

Declaration of interests M.H.T. participated in a scientific advisory board meeting of ERX Pharmaceuticals, Inc. (Cambridge, MA, USA) in 2019. He was a member of the Research Cluster Advisory Panel (ReCAP) of the Novo Nordisk Foundation between 2017 and 2019. He attended a scientific advisory board meeting of the Novo Nordisk Foundation Center for Basic Metabolic Research, University of Copenhagen, in 2016. He received funding for his research projects by Novo Nordisk (2016–2020) and Sanofi-Aventis (2012–2019). He consulted for Böhringer Ingelheim Pharma GmbH & Co. KG (2020). He delivered a scientific lecture for Sanofi-Aventis Deutschland GmbH in 2020. R.G.J. is a scientific advisor to Servier, Agios Pharmaceuticals, and is a shareholder and member of the scientific advisory board of Immunomet Therapeutics.

Figures

None
Graphical abstract
Figure 1
Figure 1
Virus-mediated ablation of PVNOT neurons induces hyperphagic obesity that is rectifiable by exogenous OT treatment and associated with CCK insensitivity (A) Schematic of the experimental paradigm with an OT-specific AAV-OTp-iCre used to induce the expression of diphtheria toxin A (DTA) selectively in PVNOT neurons. (B) Confocal micrograph depicting immunoreactivity to cleaved caspase-3 (C-CASP3; red) in PVNOT neurons (gray) 5 days post injection. Scale bar, 50 μm. (C) BW gain of DTAOT+/PVN and control mice fed an SC diet. The arrow at 3 weeks post injection indicates single housing in metabolic cages. Data are presented as mean ± SEM. ∗∗p < 0.01, ∗∗∗∗p < 0.0001. n = 5–7 mice (two-way ANOVA). (D) Representative images of two pairs of DTAOT+/PVN and control mice 5 weeks post injection (top and bottom, respectively) next to micrographs depicting the absence and presence of PVNOT neurons, respectively. Scale bar, 100 μm. (E) Linear regression analysis of total energy expenditure (EE) and BW of DTAOT+/PVN and control mice 2 weeks post injection. Data are presented as individual mice. n.s., not significant. n = 5–7 mice. (F) Daily food intake of a separate cohort of DTAOT+/PVN and control mice pair housed for mitigating isolation stress (see supplemental information). Data are presented as mean ± SEM. p < 0.05. n = 4–5 pairs of mice (unpaired Student’s t test). (G) Body composition of DTAOT+/PVN and control mice 6 weeks post injection. Data are presented as mean ± SEM. ∗∗p < 0.01, ∗∗∗∗p < 0.0001. n = 5–7 mice (unpaired Student’s t test). (H) Blood glucose changes of DTAOT+/PVN and control mice upon a glucose tolerance test (2 g/kg BW, i.p.; left) and area under the curve (right). Data are presented as mean ± SEM. ∗∗p < 0.01, ∗∗∗∗p < 0.0001. n = 5–7 mice (two-way ANOVA). (I) BW change in a separate cohort of DTAOT+/PVN and control mice upon treatment with exogenous OT (500 nM/kg BW, s.c., twice daily). Data are presented as mean ± SEM. ∗∗∗∗p < 0.0001. n = 8–10 mice (two-way ANOVA). (J) Change in food intake of pair-housed DTAOT+/PVN and control mice upon treatment with exogenous OT (500 nM/kg BW, s.c., twice daily) relative to sham injections. Data are presented as mean ± SEM. ∗∗∗∗p < 0.0001. n = 4–5 pairs of mice (unpaired Student’s t test). (K) Cumulative food intake of control mice upon vehicle versus CCK (20 μg/kg BW, i.p.). Data are presented as mean ± SEM. p < 0.05, ∗∗p < 0.01. n = 7 mice in a cross-over design (two-way ANOVA). (L) Cumulative food intake of DTAPVN(OT+) mice upon vehicle versus CCK (20 μg/kg BW, i.p.). Data are presented as mean ± SEM. n = 5 mice in a cross-over design (two-way ANOVA).
Figure 2
Figure 2
Chronic exposure to an HFHS diet impairs the electrical and transcriptional activation of PVNOT neurons in response to peripheral CCK (A) Representative confocal micrographs depicting neuronal activation by means of nuclear c-Fos immunoreactivity (red) in PVNOT neurons (green) in adult male C57BL/6J mice fed either an SC or HFHS diet receiving CCK (20 μg/kg BW, i.p.). Scale bar, 10 μm. (B) Corresponding quantification of c-Fos+ PVNOT neurons relative to total PVNOT neurons counted. Data are presented as mean ± SEM. ∗∗∗∗p < 0.0001, n = 4 mice, 4–8 hemisections per mouse (unpaired Student’s t test). (C) Quantification of CCK-activated (c-Fos+) subpopulations of PVNOT in a separate cohort pre-treated with fluorogold (FG; 15 mg/kg BW, i.p.) to distinguish parvOT neurons (FG) from magnOT neurons (FG+); data are represented as mean in percent relative to total parvOT and magnOT cell count, respectively. n = 3 mice, 46 hemisections, 2,486 cells. (D) Schematic of the OT:RiboTag mouse model used to isolate actively translated mRNA specifically from OT+ neurons by IP of the HA-tagged ribosomal subunit Rpl22. (E) Heatmap of translating mRNA enrichment of various hypothalamic neuropeptides in the immunoprecipitate (IP) relative to input. n = 4 mice. (F) Heatmap representation of enrichment in Cckar mRNA and Cckbr mRNA in IP relative to input. n = 4 mice. (G) Relative abundance of Cckar mRNA and Cckbr mRNA in the IP of OT:RiboTag mice fed an HFHS diet relative to an SC diet. n = 4 mice. (H) Heatmap representation of DEGs in hypothalamic OT+ neurons of adult male OT:RiboTag mice fed either an SC (left) or HFHS (right) diet upon injection of vehicle versus CCK (20 μg/kg BW, i.p.). Rows reflect normalized (Z score) gene expression abundance. n = 4 mice. (I) Volcano plot showing log-transformed adjusted p values plotted against fold changes for DEGs in hypothalamic OT neurons from SC diet-fed OT:RiboTag mice upon injection of vehicle versus CCK (20 μg/kg BW, i.p.).
Figure 3
Figure 3
PVNOT neurons are activated by CCK via a direct, CCKAR-dependent mechanism in lean but not obese mice (A) 2-photon micrograph of an acute brain slice expressing the Ca2+ indicator GCaMP6f (green, top left) in PVNOT neurons conditionally tagged by Ai14-tdTomato (red, bottom left) in a cell-type-specific manner (merge, center). Representative images were taken during the time-lapse recording before (top right) and after bath application of 50 nM CCK (bottom right) in the presence of synaptic blockers. Scale bars, 25 μm. (B) Heatmap representation of cytosolic Ca2+ transients of individual PVNOT neurons upon bath application of CCK (50 nM) in the presence of synaptic blockers. n = 1 mouse, 49 neurons. (C) Pie chart illustrating the percentages of PVNOT neurons that increase (yellow) or decrease their activity (purple) upon CCK application or that do not exhibit any change (gray). (D) Quantification of Ca2+ events over time, displayed in 1-min bins. n = 1 mouse, 49 neurons. (E) 3D-rendered, high-power confocal micrograph depicting Ot mRNA (green), Cckar mRNA (magenta), and DAPI (gray) upon FISH (fluorescence in situ hybridization; RNAscope). Individual nuclei are outlined for demarcation. Scale bar, 20 μm. (F) Corresponding quantification of FISH using background-corrected mean fluorescence intensity (M.F.I.) of Cckar mRNA per Ot+ soma in the rostromedial and caudal PVN of adult male C57BL/6J mice fed either an SC or HFHS diet. Data are presented as mean of all somata analyzed ± SEM. ∗∗∗∗p < 0.0001, ∗∗∗p < 0.001. n = 3 mice, 4–8 hemisections per mouse (unpaired Student’s t test). (G) Representative traces of action potential frequency of putative magnOT neurons derived from SC diet-fed versus HFHS diet-fed mice in response to increasing concentrations of bath-applied A-71623 (5, 25, and 50 nM), followed by superfusion with native CCK (50 nM). (H) Summary of changes in action potential frequency visualized in (G). Data are presented as mean superimposed with individual data points. p < 0.05, n = 2–3 mice/6 neurons per mouse (two-way ANOVA).
Figure 4
Figure 4
Blunted suppression of food intake in response to CCK on an HFHS diet is reinstated by concomitant chemogenetic activation of PVNOT neurons (A) Cumulative food intake of SC diet-fed control mice upon vehicle versus CCK (20 μg/kg BW, i.p.) plus CNO (1 mg/kg BW, i.p.). Data are presented as mean ± SEM. Shown is corresponding latency to feed (bottom). ∗∗p < 0.01, p < 0.05. n = 5 mice in a cross-over design (two-way ANOVA and paired Student’s t test [bottom]). (B) Cumulative food intake of HFHS diet-fed control mice upon vehicle versus CCK (20 μg/kg BW, i.p.) plus CNO (1 mg/kg BW, i.p.). Data are presented as mean ± SEM. Shown is corresponding latency to feed (bottom). n = 8 mice in a cross-over design (two-way ANOVA and paired Student’s t test [bottom]). (C) Cumulative food intake of HFHS diet-fed hM3DqOT+/PVN mice upon vehicle versus CCK (20 μg/kg BW, i.p.) plus CNO (1 mg/kg BW, i.p.). Data are presented as mean ± SEM. Shown is corresponding latency to feed (bottom). ∗∗p < 0.01, n = 8 mice in a cross-over design (two-way ANOVA and paired Student’s t test [bottom]). (D) Representative confocal micrographs depicting neuronal activation by means of nuclear c-Fos immunoreactivity (green) in virally transduced PVNOT neurons (mCherry+, red). Scale bar, 50 μm. (E) Quantification of activated (c-Fos+) virally transduced PVNOT neurons (mCherry+) upon CCK (20 μg/kg BW, i.p.) plus CNO (1 mg/kg BW, i.p.) injections in HFHS diet-fed hM3DqOT+/PVN mice or control mice. ∗∗∗∗p < 0.0001, n = 4 mice/3–8 hemisections (one-way ANOVA). (F) Quantification of activated (c-Fos+) PVN neurons overall upon CCK (20 μg/kg BW, i.p.) plus CNO (1 mg/kg BW, i.p.) injections in HFHS diet-fed hM3DqOT+/PVN mice or control mice. ∗∗p < 0.01, ##p < 0.01, n = 4 mice/3–8 hemisections (one-way ANOVA). (G) Representative confocal micrographs depicting neuronal activation (c-Fos+, green) across the NTS of hM3DqOT+/PVN mice or control mice following either CNO or CNO+CCK; insets display co-localization with TH (gray). Scale bar, 100 μm and 20 μm (inset). (H) Quantification of activated (c-Fos+) NTS neurons upon CCK (20 μg/kg BW, i.p.) plus CNO (1 mg/kg BW, i.p.) injections in HFHS diet-fed hM3DqOT+/PVN mice or control mice. ∗∗p < 0.01. n = 4 mice/3–8 hemisections (one-way ANOVA). (I) Relative BW changes of male wild-type mice and tamoxifen-inducible global OTR−/− mice, all fed an HFHS diet and treated bidaily with either OT (500 nmol/kg BW, s.c.), A-71623 (30 nmol/kg BW, i.p.), or their combination. Data are presented in percent of initial BW as mean ± SEM. p < 0.05, ∗∗p < 0.01, ∗∗∗p < 0.001, ∗∗∗∗p < 0.0001. n = 6–8 mice (two-way ANOVA). (J) Cumulative food intake of the cohort shown in (H). Data are presented as mean ± SEM. p < 0.05, ∗∗p < 0.01, ∗∗∗p < 0.001, ∗∗∗∗p < 0.0001. n = 6–8 mice (two-way ANOVA). (K) Changes in body composition of the cohort shown in (H) and (I) at the end of study. Data are presented relative to initial body composition as mean ± SEM. ∗∗p < 0.01, ∗∗∗∗p < 0.0001. n = 5–7 mice (unpaired Student’s t test).
Figure 5
Figure 5
Intersectional regulation of hypothalamic OT neurons by CCKAR and κ-opioid receptors is dependent on dietary context (A) Confocal micrographs of coronal brain section from an adult male OT:Sun1-sfGFP mouse, depicting the nuclear localization of sfGFP (green) in hypothalamic OT neurons (gray) of the PVN and SON. III, third ventricle; ot, optic tract. Scale bars, 200 μm and 25 μm (inset). (B) Schematic of the workflow used to sort individual sfGFP+ nuclei into 384-well plates using FANS (top left) with a representative FANS plot displayed (top right); isolation was followed by low-volume pipetting robot-assisted single nucleus lysis, cDNA synthesis, and library preparation for snRNA-seq2 (bottom). (C) Volcano plot highlighting differential gene expression changes across the sum of individual OT nuclei from adult male OT:Sun1-sfGFP mice chronically fed an HFHS diet relative to SC diet-fed littermate controls. n = 2 mice. (D) Upset plot visualization of intersectional expression of select receptors in individual OT nuclei from SC diet-fed (top) and HFHS diet-fed (bottom) OT:Sun1-sfGFP mice. Transcripts for Cckar and Oprk1 are highlighted (red dash boxes), as well as their intersections (blue bars). Percentages of Cckar+ OT nuclei also expressing Oprk1 are visualized as pie charts for each panel. (E) UMAP plot visualization of individual OT nuclei from SC diet-fed (top) and HFHS diet-fed (bottom) OT:Sun1-sfGFP mice, colored according to their expression of either Cckar (magenta), Oprk1 (cyan), their combination (blue), or none (gray). N = 2; 614 cells (SC diet) and 588 cells (HFHS diet). (F) Representative traces of action potential frequency of magnOT neurons derived from adult male OT:Ai14-tdTomato reporter mice fed either an SC diet or HFHS diet in response to bath-applied A-71623 (25 nM) with or without pre-treatment with nor-BNI (200 nM). Scale bar, 25 μm. (G) Summary of changes in action potential frequency visualized in (F). Data are presented before and after application of A-71623 as mean ± SEM. p < 0.05. n = 2–3 mice/5–8 neurons per mouse (paired Student’s t test). (H) Cumulative food intake of HFHS diet-fed male C57BL/6J wild-type mice upon injection of a CCK + nor-BNI combination (20 μg/kg BW and 10 mg/kg BW, respectively; i.p.), nor-BNI alone (10 mg/kg BW, i.p.), or vehicle. Data are presented as mean ± SEM. p < 0.05, ∗∗p < 0.01. n = 6–7 mice (two-way ANOVA).

References

    1. Locke A.E., Kahali B., Berndt S.I., Justice A.E., Pers T.H., Day F.R., Powell C., Vedantam S., Buchkovich M.L., Yang J., et al. Genetic studies of body mass index yield new insights for obesity biology. Nature. 2015;518:197–206. doi: 10.1038/nature14177. - DOI - PMC - PubMed
    1. McCormack S.E., Blevins J.E., Lawson E.A. Metabolic Effects of Oxytocin. Endocr. Rev. 2020;41:121–145. doi: 10.1210/endrev/bnz012. - DOI - PMC - PubMed
    1. Swanson L.W., Sawchenko P.E. Hypothalamic integration: organization of the paraventricular and supraoptic nuclei. Annu. Rev. Neurosci. 1983;6:269–324. doi: 10.1146/annurev.ne.06.030183.001413. - DOI - PubMed
    1. Cox J.E., Sims J.S. Ventromedial hypothalamic and paraventricular nucleus lesions damage a common system to produce hyperphagia. Behav. Brain Res. 1988;28:297–308. doi: 10.1016/0166-4328(88)90132-5. - DOI - PubMed
    1. Michaud J.L., Boucher F., Melnyk A., Gauthier F., Goshu E., Lévy E., Mitchell G.A., Himms-Hagen J., Fan C.M. Sim1 haploinsufficiency causes hyperphagia, obesity and reduction of the paraventricular nucleus of the hypothalamus. Hum. Mol. Genet. 2001;10:1465–1473. doi: 10.1093/hmg/10.14.1465. - DOI - PubMed

Publication types