. 2023 Nov 2;110(11):1938-1949.
doi: 10.1016/j.ajhg.2023.09.014. Epub 2023 Oct 20.

Identification of a robust DNA methylation signature for Fanconi anemia

Affiliations

Identification of a robust DNA methylation signature for Fanconi anemia

Daria Pagliara et al. Am J Hum Genet. .

Abstract

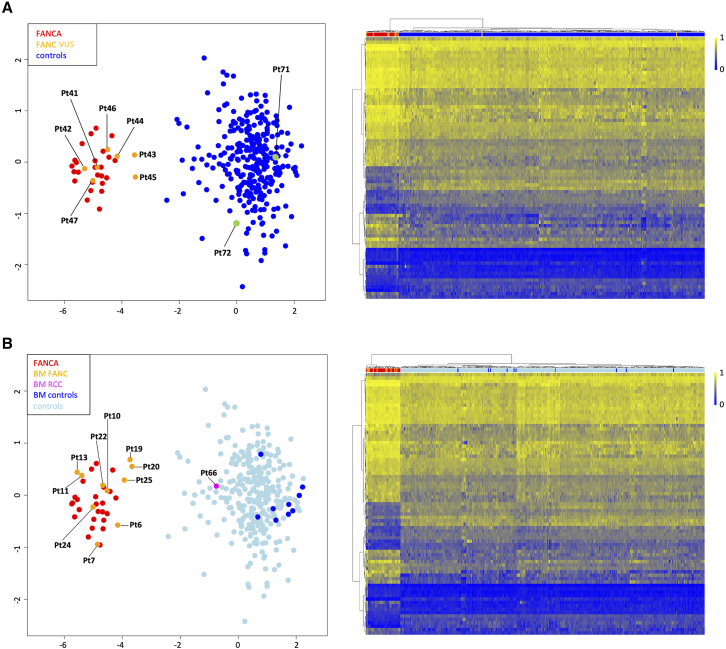
Fanconi anemia (FA) is a clinically variable and genetically heterogeneous cancer-predisposing disorder representing the most common bone marrow failure syndrome. It is caused by inactivating predominantly biallelic mutations involving >20 genes encoding proteins with roles in the FA/BRCA DNA repair pathway. Molecular diagnosis of FA is challenging due to the wide spectrum of the contributing gene mutations and structural rearrangements. The assessment of chromosomal fragility after exposure to DNA cross-linking agents is generally required to definitively confirm diagnosis. We assessed peripheral blood genome-wide DNA methylation (DNAm) profiles in 25 subjects with molecularly confirmed clinical diagnosis of FA (FANCA complementation group) using Illumina's Infinium EPIC array. We identified 82 differentially methylated CpG sites that allow to distinguish subjects with FA from healthy individuals and subjects with other genetic disorders, defining an FA-specific DNAm signature. The episignature was validated using a second cohort of subjects with FA involving different complementation groups, documenting broader genetic sensitivity and demonstrating its specificity using the EpiSign Knowledge Database. The episignature properly classified DNA samples obtained from bone marrow aspirates, demonstrating robustness. Using the selected probes, we trained a machine-learning model able to classify EPIC DNAm profiles in molecularly unsolved cases. Finally, we show that the generated episignature includes CpG sites that do not undergo functional selective pressure, allowing diagnosis of FA in individuals with reverted phenotype due to gene conversion. These findings provide a tool to accelerate diagnostic testing in FA and broaden the clinical utility of DNAm profiling in the diagnostic setting.

Keywords: DNA methylation profiling; Fanconi anemia; classifier; diagnostic tool; episignature; gene conversion; hematological disorders; machine learning; mosaicism; variant classification.


Conflict of interest statement

Declaration of interests Dr. Sadikovic is a shareholder in EpiSign Inc, a software company involved in commercialization of EpiSign Technology.

Figures

None
Graphical abstract
Figure 1
Figure 1
Identification of a DNAm signature for the Fanconi anemia complementation group A (A) DNAm discovery. MDS (left) and heatmap (right) plots showing clustering of the DNAm profiles of 25 FANCA samples (red) segregating from those of 111 age-, sex-, and batch-matched control samples (blue) using 82 differentially methylated CpG probes defining the FA episignature. Control samples were used for model training and included healthy subjects and individuals with other genetic disorders. The heatmap showing the DNAm levels were clustered by Ward’s method with dendrograms representing the Euclidian distances between samples (columns) and individual CpG sites (rows). Sample groups are indicated using color bars above the heatmap. (B) Volcano plot showing differences in methylation of the tested probes (represented as circles on the plot) between the FANCA and control groups. For each probe, the magnitude (mean methylation difference, x axis) and significance (−log10 adjusted p value, y axis) of DNAm difference between groups was evaluated to identify the most informative probes (red). Negative and positive mean methylation differences reflect decreased methylation (hypomethylation) and increased methylation (hypermethylation) in FA samples compared with controls, respectively. (C) DNAm signature validation. MDS (left) and unsupervised hierarchical clustering (right) analyses were performed by considering additional 132 healthy controls and 41 individuals affected with other genetic diseases (light blue) and 14 pediatric cases with hematological disorders with clinical features partially overlapping with FA (RCC, AA, DBA6, GATA2-D, and BMFS2) (orange). Sample groups are indicated using color bars above the heatmap.
Figure 2
Figure 2
The FANCA DNAm signature shows broad specificity for Fanconi anemia (A) MDS (left) and heatmap (right) plots showing clustering of the peripheral blood DNAm profiles of 14 subjects with FA belonging to different complementation groups (FANCA, orange; FANCC, purple; FANCG, light blue; FANCL, brown; FANCP, magenta), segregating from those of healthy heterozygous carriers (gray), and healthy controls plus other genetic disorders (blue). FANCA samples used for training are depicted in red; FA subjects with reverted phenotype due to gene conversion (individual 40 and individual 73) are in unfilled red circles. The heatmap showing the DNAm levels were clustered by Ward’s method with dendrograms representing the Euclidian distances between samples (columns) and individual CpG sites (rows). Sample groups are indicated using color bars above the heatmap, using the same color code of the left; individual 40 and individual 73 were depicted in yellow, and their profile is highlighted by light-blue box. (B) Sample classification using the FA DNAm signature. An SVM classification model was trained with FANCA samples used for probe selection (red) and used to classify different cohorts available in an internal database. Showed results are the summary of 4-fold cross-validation when the SVM model is trained using FANCA training samples and 75% of all other control samples in the OPBG database. The FA samples belonging to the different complementation groups (peripheral blood, purple; bone marrow aspirates, magenta), heterozygous healthy carriers (yellow), molecularly and clinically unsolved FA cases (orange), reverted FA cases (maroon), and 25% of controls (healthy subjects and individuals with different genetic diseases) (peripheral blood, gray; bone marrow aspirates, pink) were used for testing. Each sample is plotted on the basis of its scoring by the model. SVM scoring ranges from 0 to 1 (y axis), representing the probability of having a DNAm profile fitting FA. All FA samples showed an SVM score >0.75, while non-FA samples had an SVM score <0.50. RATARS: Radio-Tartaglia syndrome (MIM: 619312); MRD23: intellectual developmental disorder 23 (MIM: 615761); DYT28: dystonia 28 (MIM: 617284); WDSTS: Wiedemann-Steiner syndrome (MIM: 605130); KBG syndrome (MIM: 148050).
Figure 3
Figure 3
The FA DNAm signature successfully classifies molecularly or clinically unsolved FA cases as well as bone marrow aspirate samples (A) MDS (left) and heatmap (right) plots showing the clustering of 9 “unsolved” cases who were tested using the FA DNAm signature. Clustering with FA samples is observed for 7 subjects with clinical features fitting or suggestive of FA with inconclusive molecular data (orange), confirming diagnosis of FA. In these cases, DEB testing validated the DNAm analysis. The remaining 2 individuals (green) were found to cluster with the control group (blue), rejecting a diagnosis of FA. DEB testing performed in one of the two cases confirmed the DNAm finding. The FANCA samples used for training are shown in red. Sample groups are indicated using color bars above the heatmap. (B) MDS (left) and heatmap (right) plots showing the episignature robustness in properly classifying BMA samples from FA cases (orange) and those from healthy individuals (blue) and a subject with RCC (magenta). FANCA and control samples from peripheral blood are depicted in red and light blue, respectively. Sample groups are indicated using color bars above the heatmap.
Figure 4
Figure 4
The FA DNAm signature demonstrates high specificity using different datasets from the EpiSign knowledge database Training samples are depicted in blue, while testing samples are in gray. For each tested sample, the MVP score was generated using an SVM classifier. With only 3 exceptions, all testing samples from controls and other rare genetic disorders (approx. 2,000 samples) received MVP scores <0.25, demonstrating an overall high specificity of the model. Genetic information to verify/exclude the occurrence of biallelic FA gene variants in the three non-FA cases was not available. Additionally, healthy carriers and samples from other hematological disorders also received scores below 0.25, further confirming the model’s specificity to FA. All tested FA individuals, including the revertant ones due to gene conversion, received scores above the cut-off value of 0.25, indicating an overall high sensitivity of the model. ADCADN, cerebellar ataxia deafness and narcolepsy syndrome (MIM: 604121); ARTHS, Arboleda-Tham syndrome (MIM: 616268); ATRX, X-linked alpha-thalassemia/impaired intellectual development syndrome (MIM: 300032); AUTS18, susceptibility to autism 18 (MIM: 615032); BEFAHRS, Beck-Fahrner syndrome (MIM: 618798); BFLS, Borjeson-Forssman-Lehmann syndrome (MIM: 301900); BIS, blepharophimosis-intellectual disability SMARCA2 syndrome (MIM: 619293); CdLS, Cornelia de Lange syndrome (MIM: 122470); CSS_c.6200, Coffin-Siris syndrome 1,2 (MIM: 135900 and 614607), missense variants within the BAF250_C domain; CSS4_c.2650, Coffin-Siris syndrome 4 (MIM: 614609), missense variants within the helicase ATP-binding domain; CSS9, Coffin-Siris syndrome 9 (MIM: 615866); DYT28, dystonia 28 (MIM: 617284); EEOC, epileptic encephalopathy-childhood onset (MIM: 615369); FLHS, Floating-Harbour syndrome (MIM: 136140); GADEVS, Gabriele-de Vries syndrome (MIM: 617557); GTPTS, genitopatellar syndrome (MIM: 606170); HMA, Hunter-McAlpine craniosynostosis syndrome (MIM: 601379); HVDAS, Helsmoortel-van der Aa syndrome (MIM: 615873), central region (C), terminal region (T); ICF, immunodeficiency-centromeric instability-facial anomalies syndrome (MIM: 242860); IDDSELD, intellectual developmental disorder with seizures and language delay (MIM: 619000); KDM2B, KDM2B-related neurodevelopmental disorder; KDM4B, intellectual developmental disorder, autosomal dominant 65 (MIM: 619320); KDVS, Koolen-De Vries syndrome (MIM: 610443); LLS, Luscan-Lumish syndrome (MIM: 616831); MKHK, Menke-Hennekam syndrome 1 and 2 (MIM: 618332 and 618333), ID4 domains (ID4); MLASA2, myopathy lactic acidosis and sideroblastic anemia 2 (MIM: 613561); MRD, intellectual developmental disorder (MRD23 [MIM: 615761], MRD51 [MIM: 617788]); MRX93, intellectual developmental disorder X-linked (MIM: 300659); MRXSA, intellectual developmental disorder X-linked syndromic Armfield type (MIM: 300261); MRXSCJ, intellectual developmental disorder X-linked syndromic Claes-Jensen type (MIM: 300534); MRXSN, intellectual developmental disorder X-linked syndromic Nascimento type (MIM: 300860); MRXSSR, intellectual developmental disorder X-linked syndromic Snyder-Robinson type (MIM: 309583); PHMDS, Phelan-McDermid syndrome (MIM: 606232); PRC2, PRC2 complex (Weaver and Cohen-Gibson) syndrome; RENS1, Renpenning syndrome (MIM: 309500); RMNS, Rahman syndrome (MIM: 617537); RSTS, Rubinstein-Taybi syndrome (MIM: 180849); SBBYSS, Ohdo syndrome (MIM: 603736); TBRS, Tatton-Brown-Rahman syndrome (MIM: 615879); VCFS, velocardiofacial syndrome (MIM: 192430), deletions of chromosome 22q11.2 with the typical deletion range (core), comprehensive (comp), also including proximal deletion range; WDSTS, Wiedemann-Steiner syndrome (MIM: 605130); WHS, Wolf-Hirschhorn syndrome (MIM: 194190).

References

    1. Kutler D.I., Singh B., Satagopan J., Batish S.D., Berwick M., Giampietro P.F., Hanenberg H., Auerbach A.D. A 20-year perspective on the International Fanconi Anemia Registry (IFAR) Blood. 2003;101:1249–1256. - PubMed
    1. Auerbach A.D. Fanconi anemia and its diagnosis. Mutat. Res. 2009;668:4–10. - PMC - PubMed
    1. Mehta P.A., Ebens C. In: GeneReviews Seattle (WA) Adam M.P., Mirzaa G.M., Pagon R.A., Wallace S.E., Bean L.J., Gripp K.W., Amemiya A., editors. University of Washington, Seattle; 2002. Fanconi Anemia; pp. 1993–2023. - PubMed
    1. Schneider M., Chandler K., Tischkowitz M., Meyer S. Fanconi anemia: genetics, molecular biology, and cancer – implications for clinical management in children and adults. Clin. Genet. 2015;88:13–24. - PubMed
    1. Dufour C., Pierri F. Modern management of Fanconi anemia. Hematology. Am. Soc. Hematol. Educ. Program. 2022;2022:649–657. - PMC - PubMed

Publication types

MeSH terms

LinkOut - more resources