. 2023 Nov 2;30(11):1520-1537.e8.
doi: 10.1016/j.stem.2023.09.015. Epub 2023 Oct 20.

TGFB1 induces fetal reprogramming and enhances intestinal regeneration

Affiliations

TGFB1 induces fetal reprogramming and enhances intestinal regeneration

Lei Chen et al. Cell Stem Cell. .

Abstract

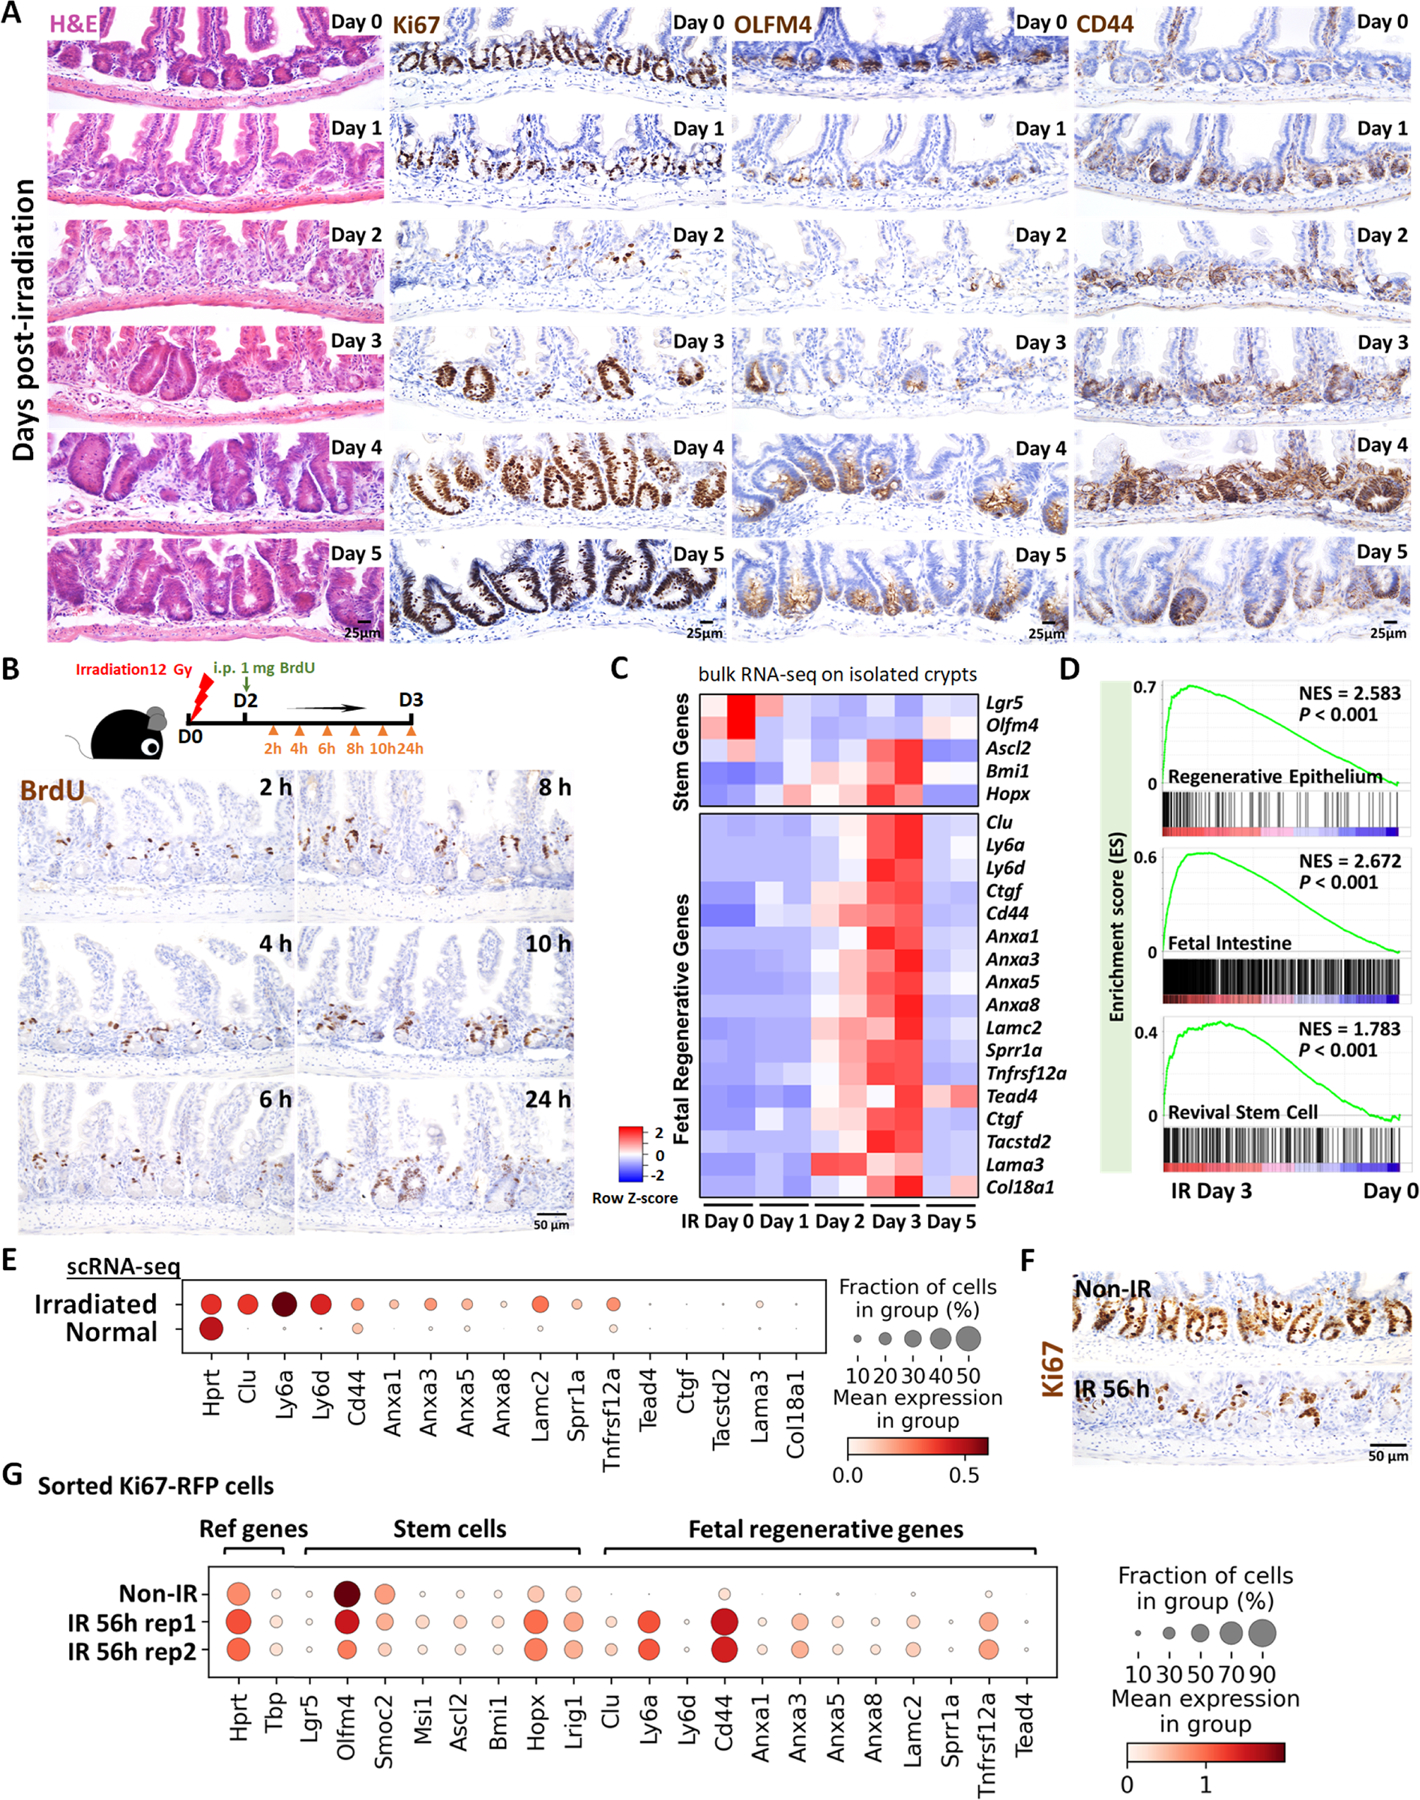
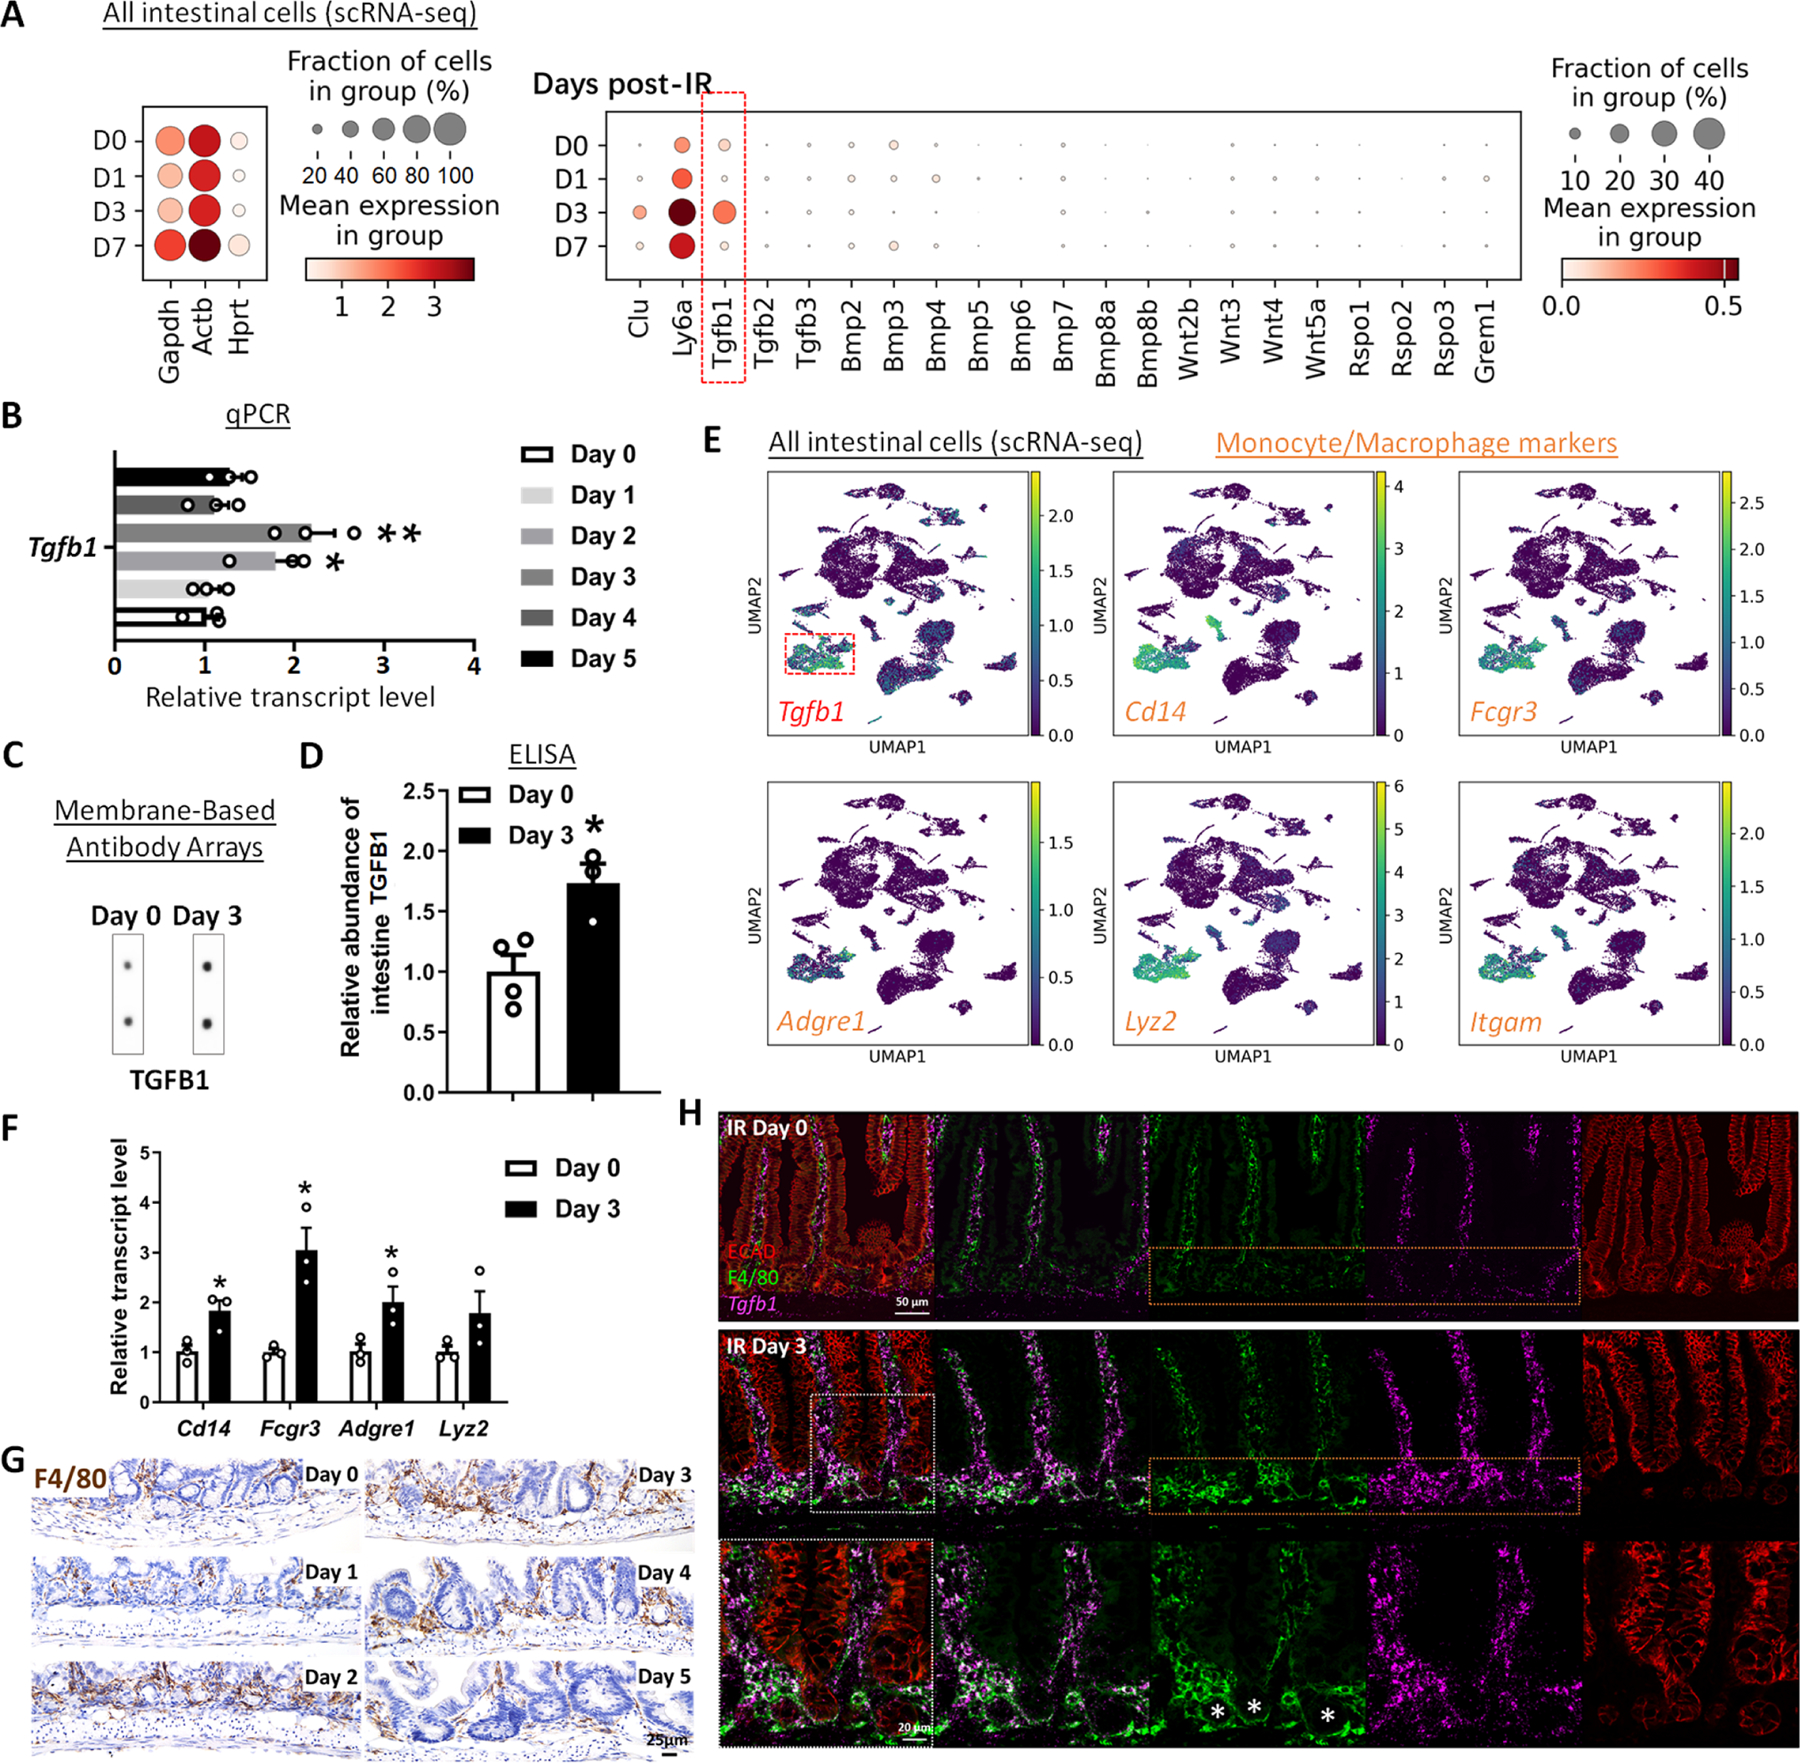
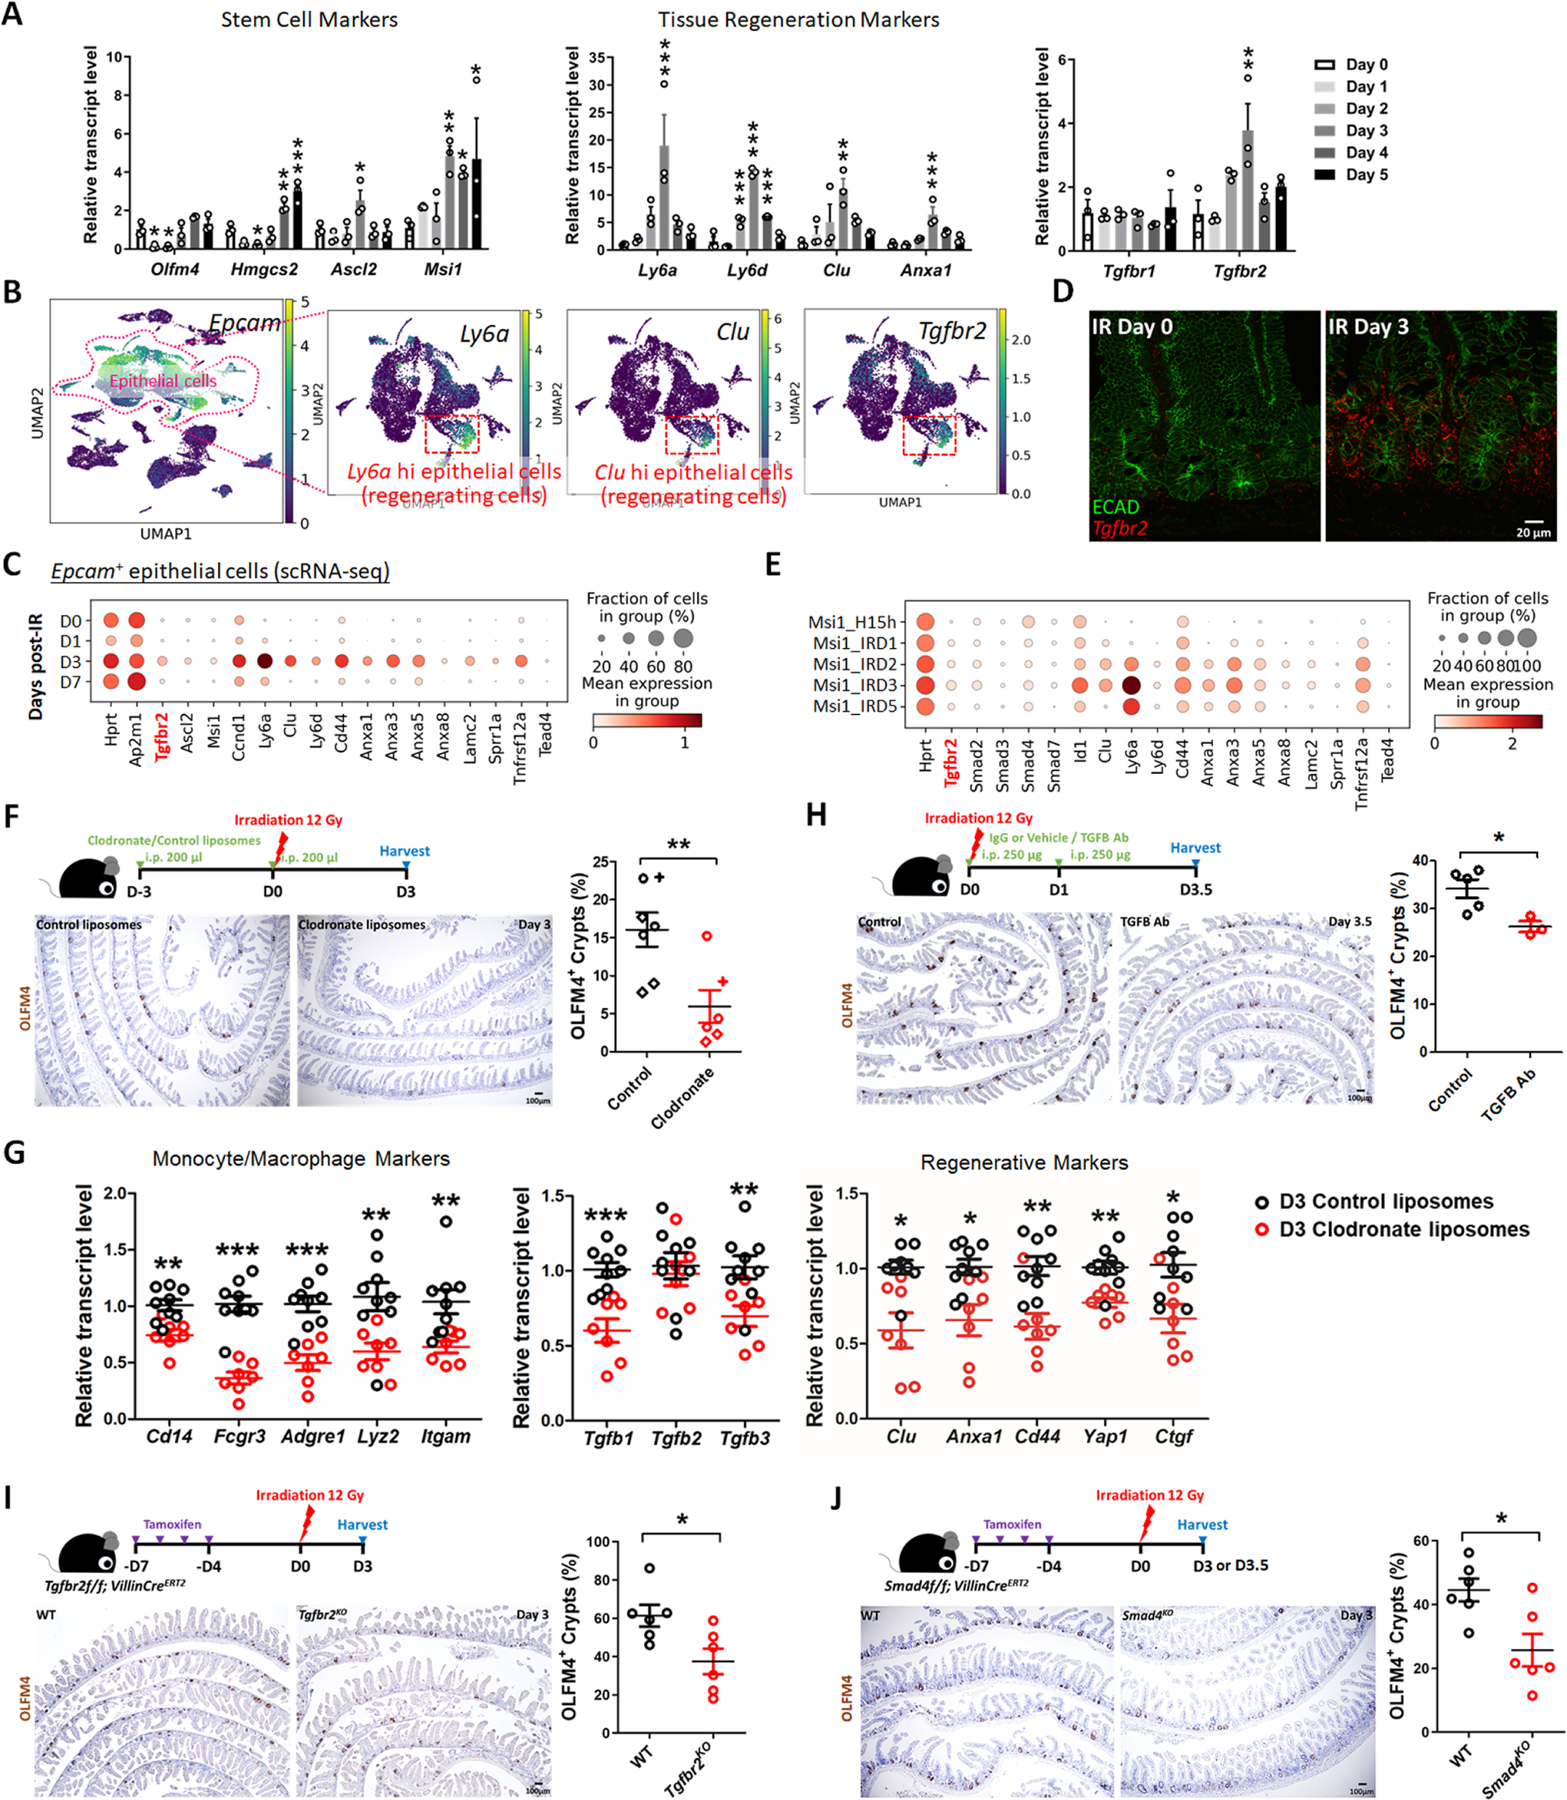
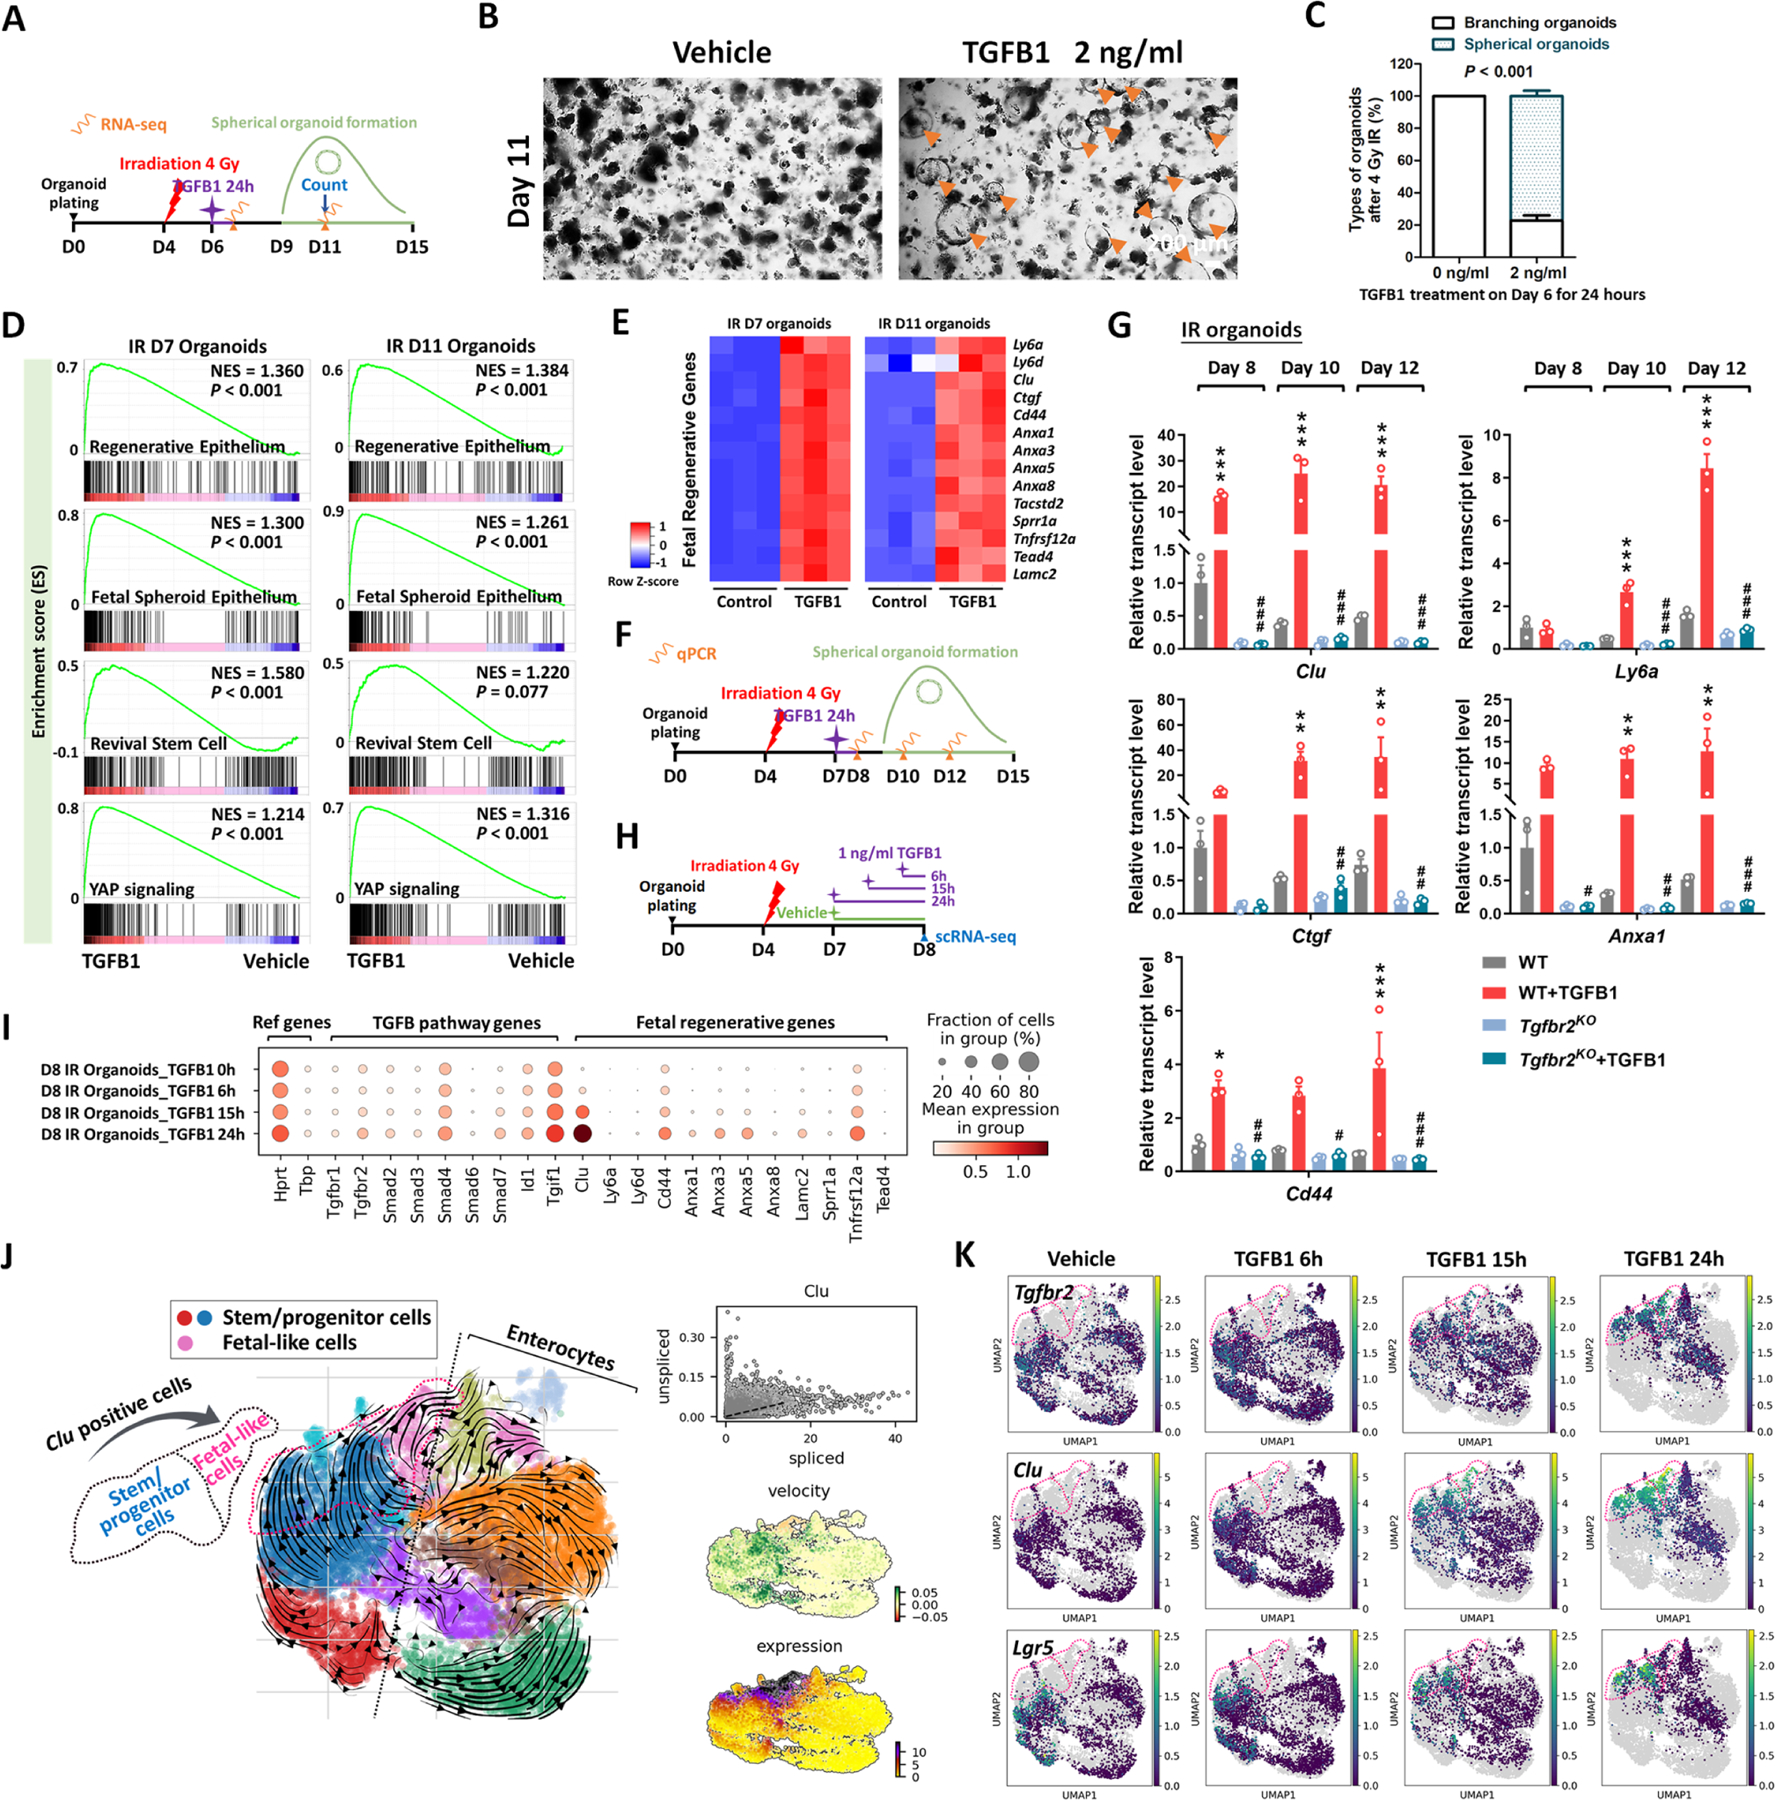
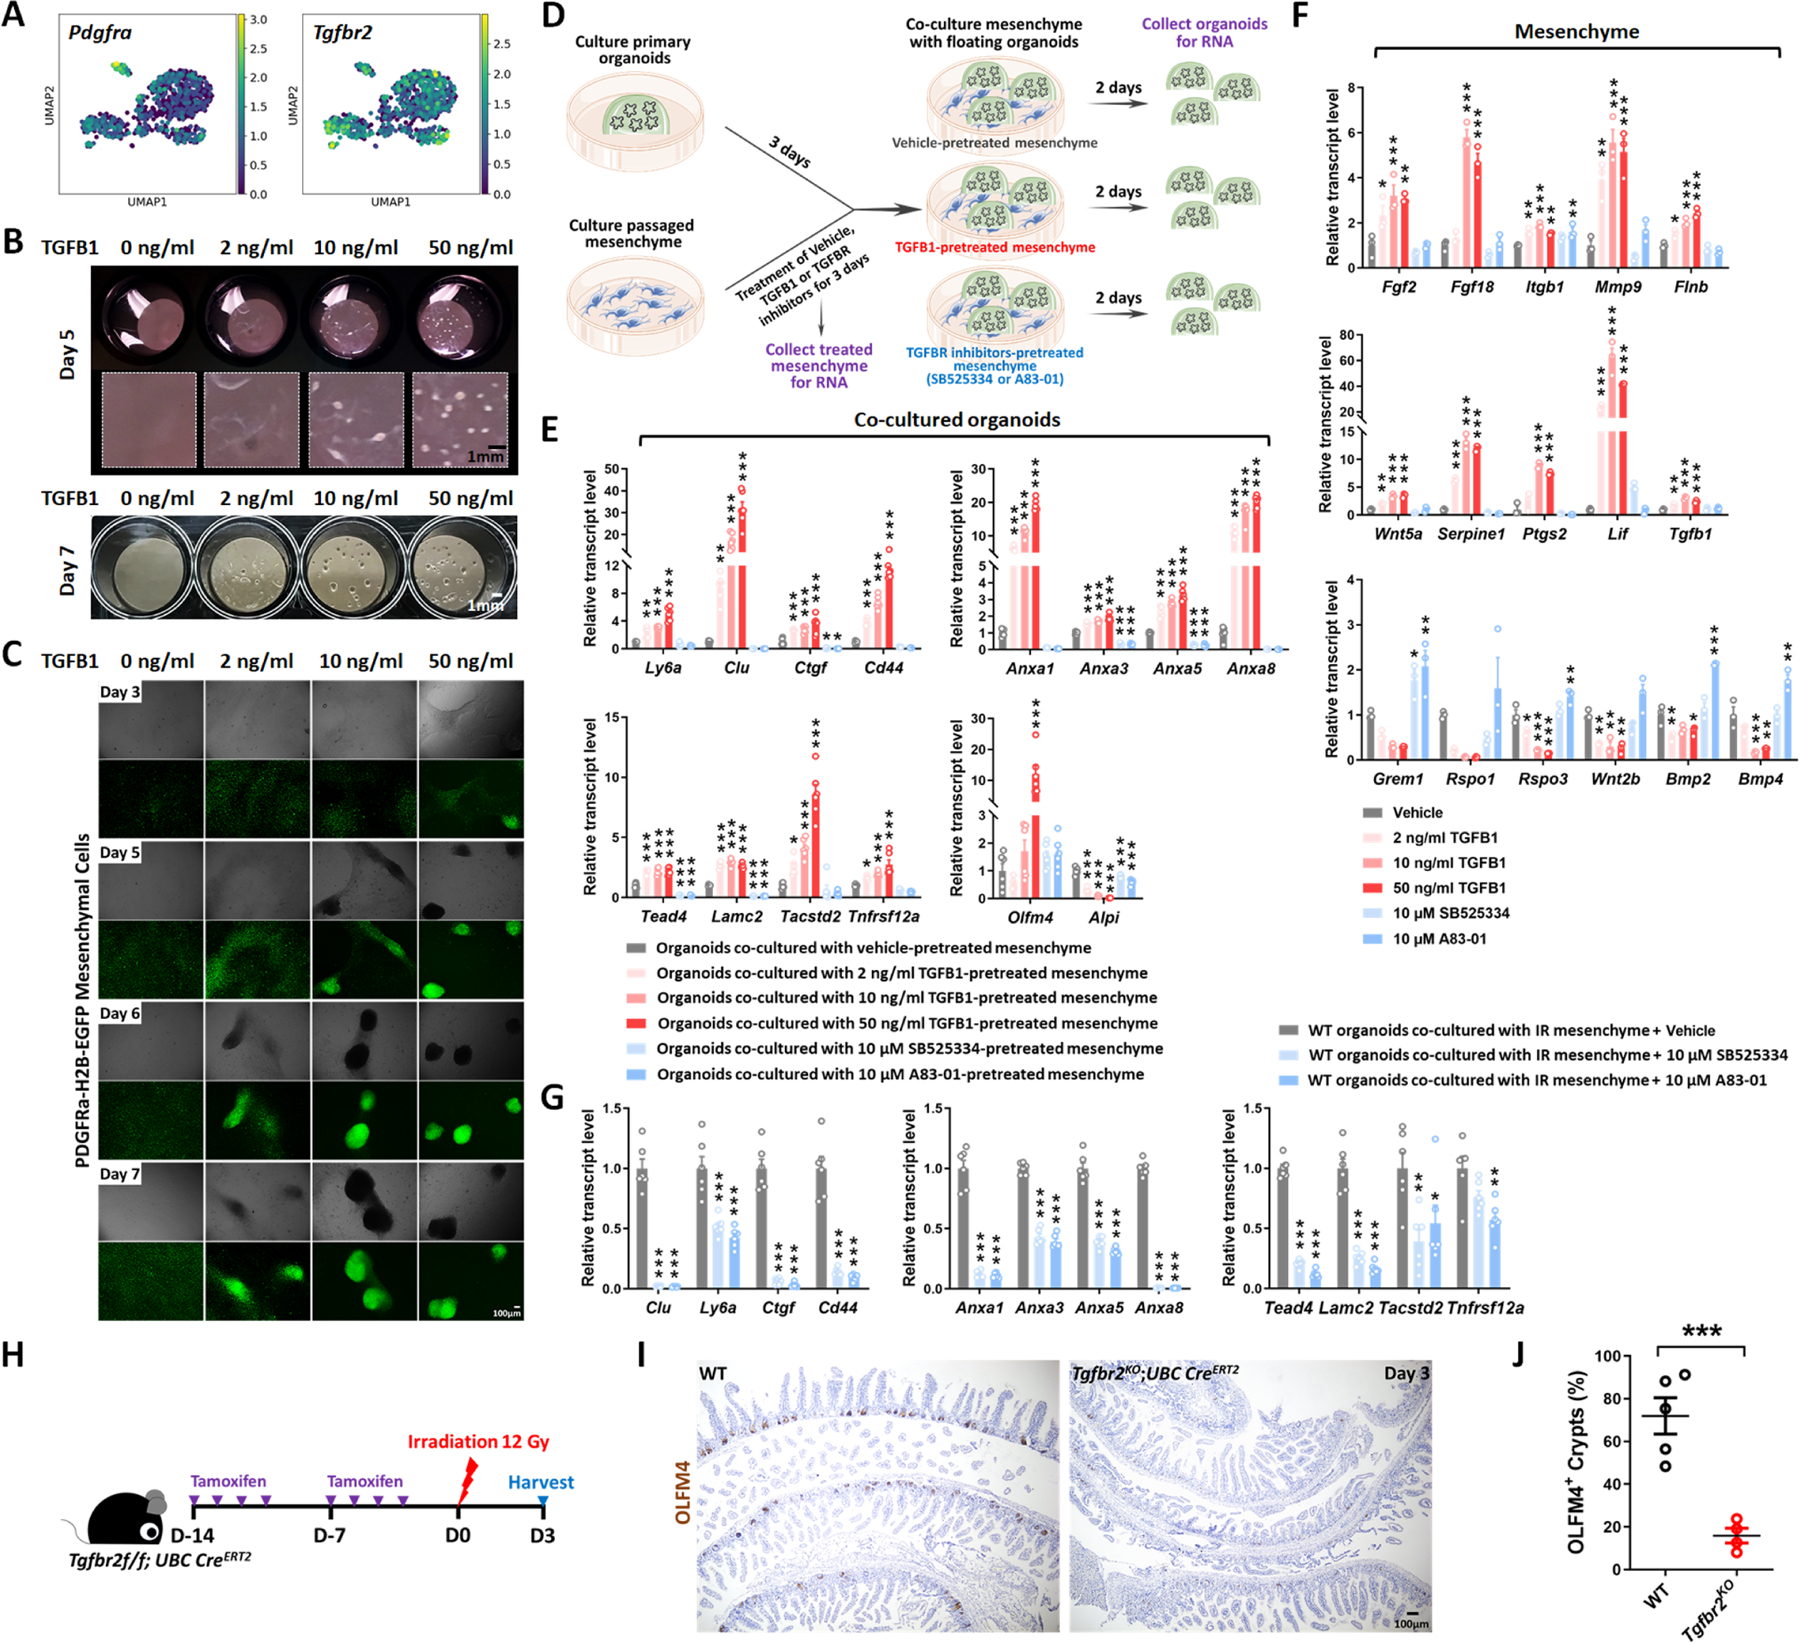
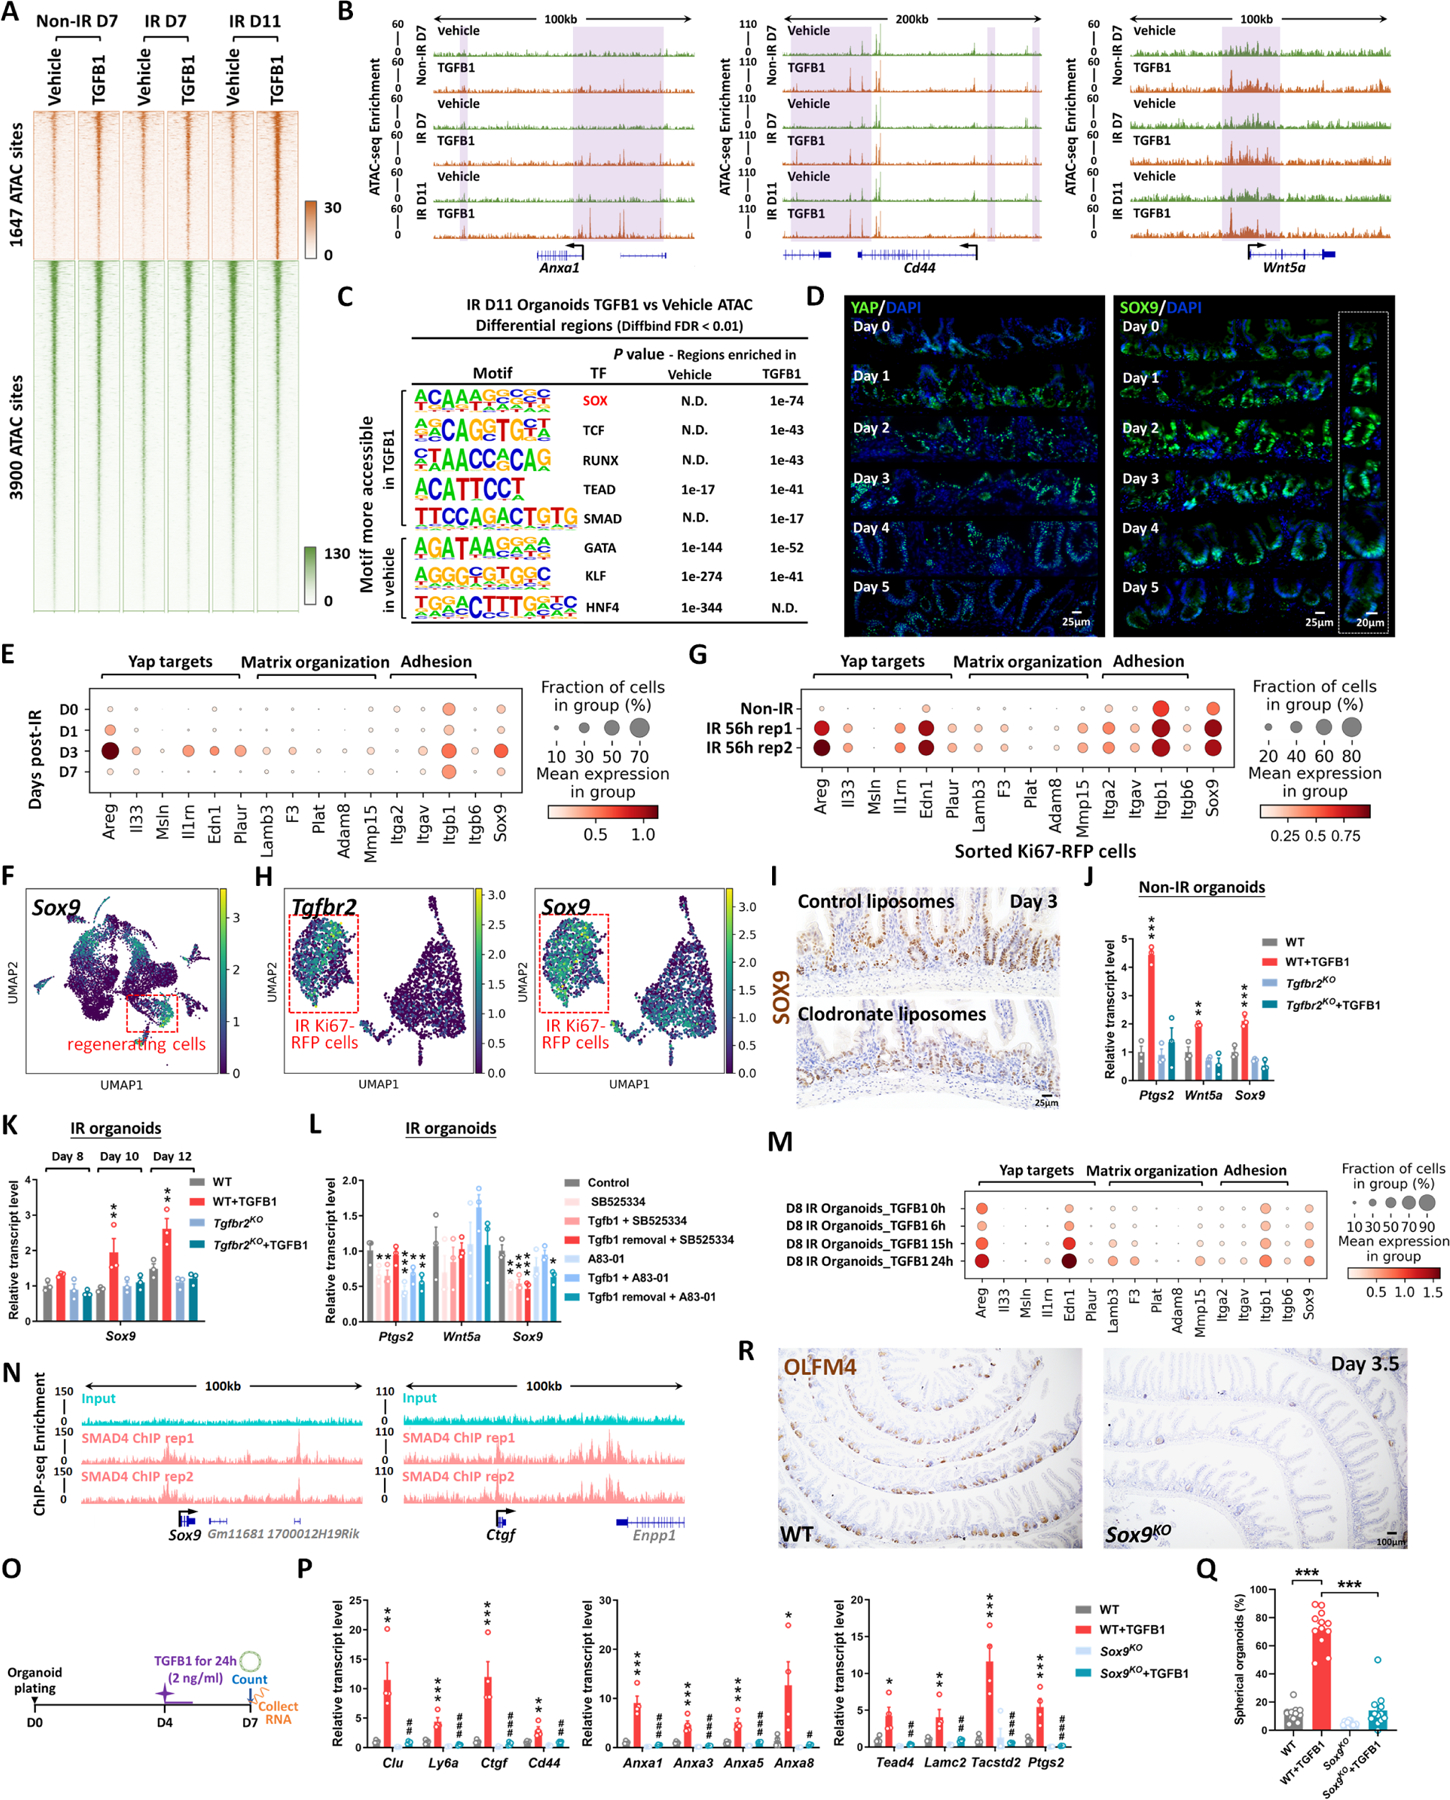
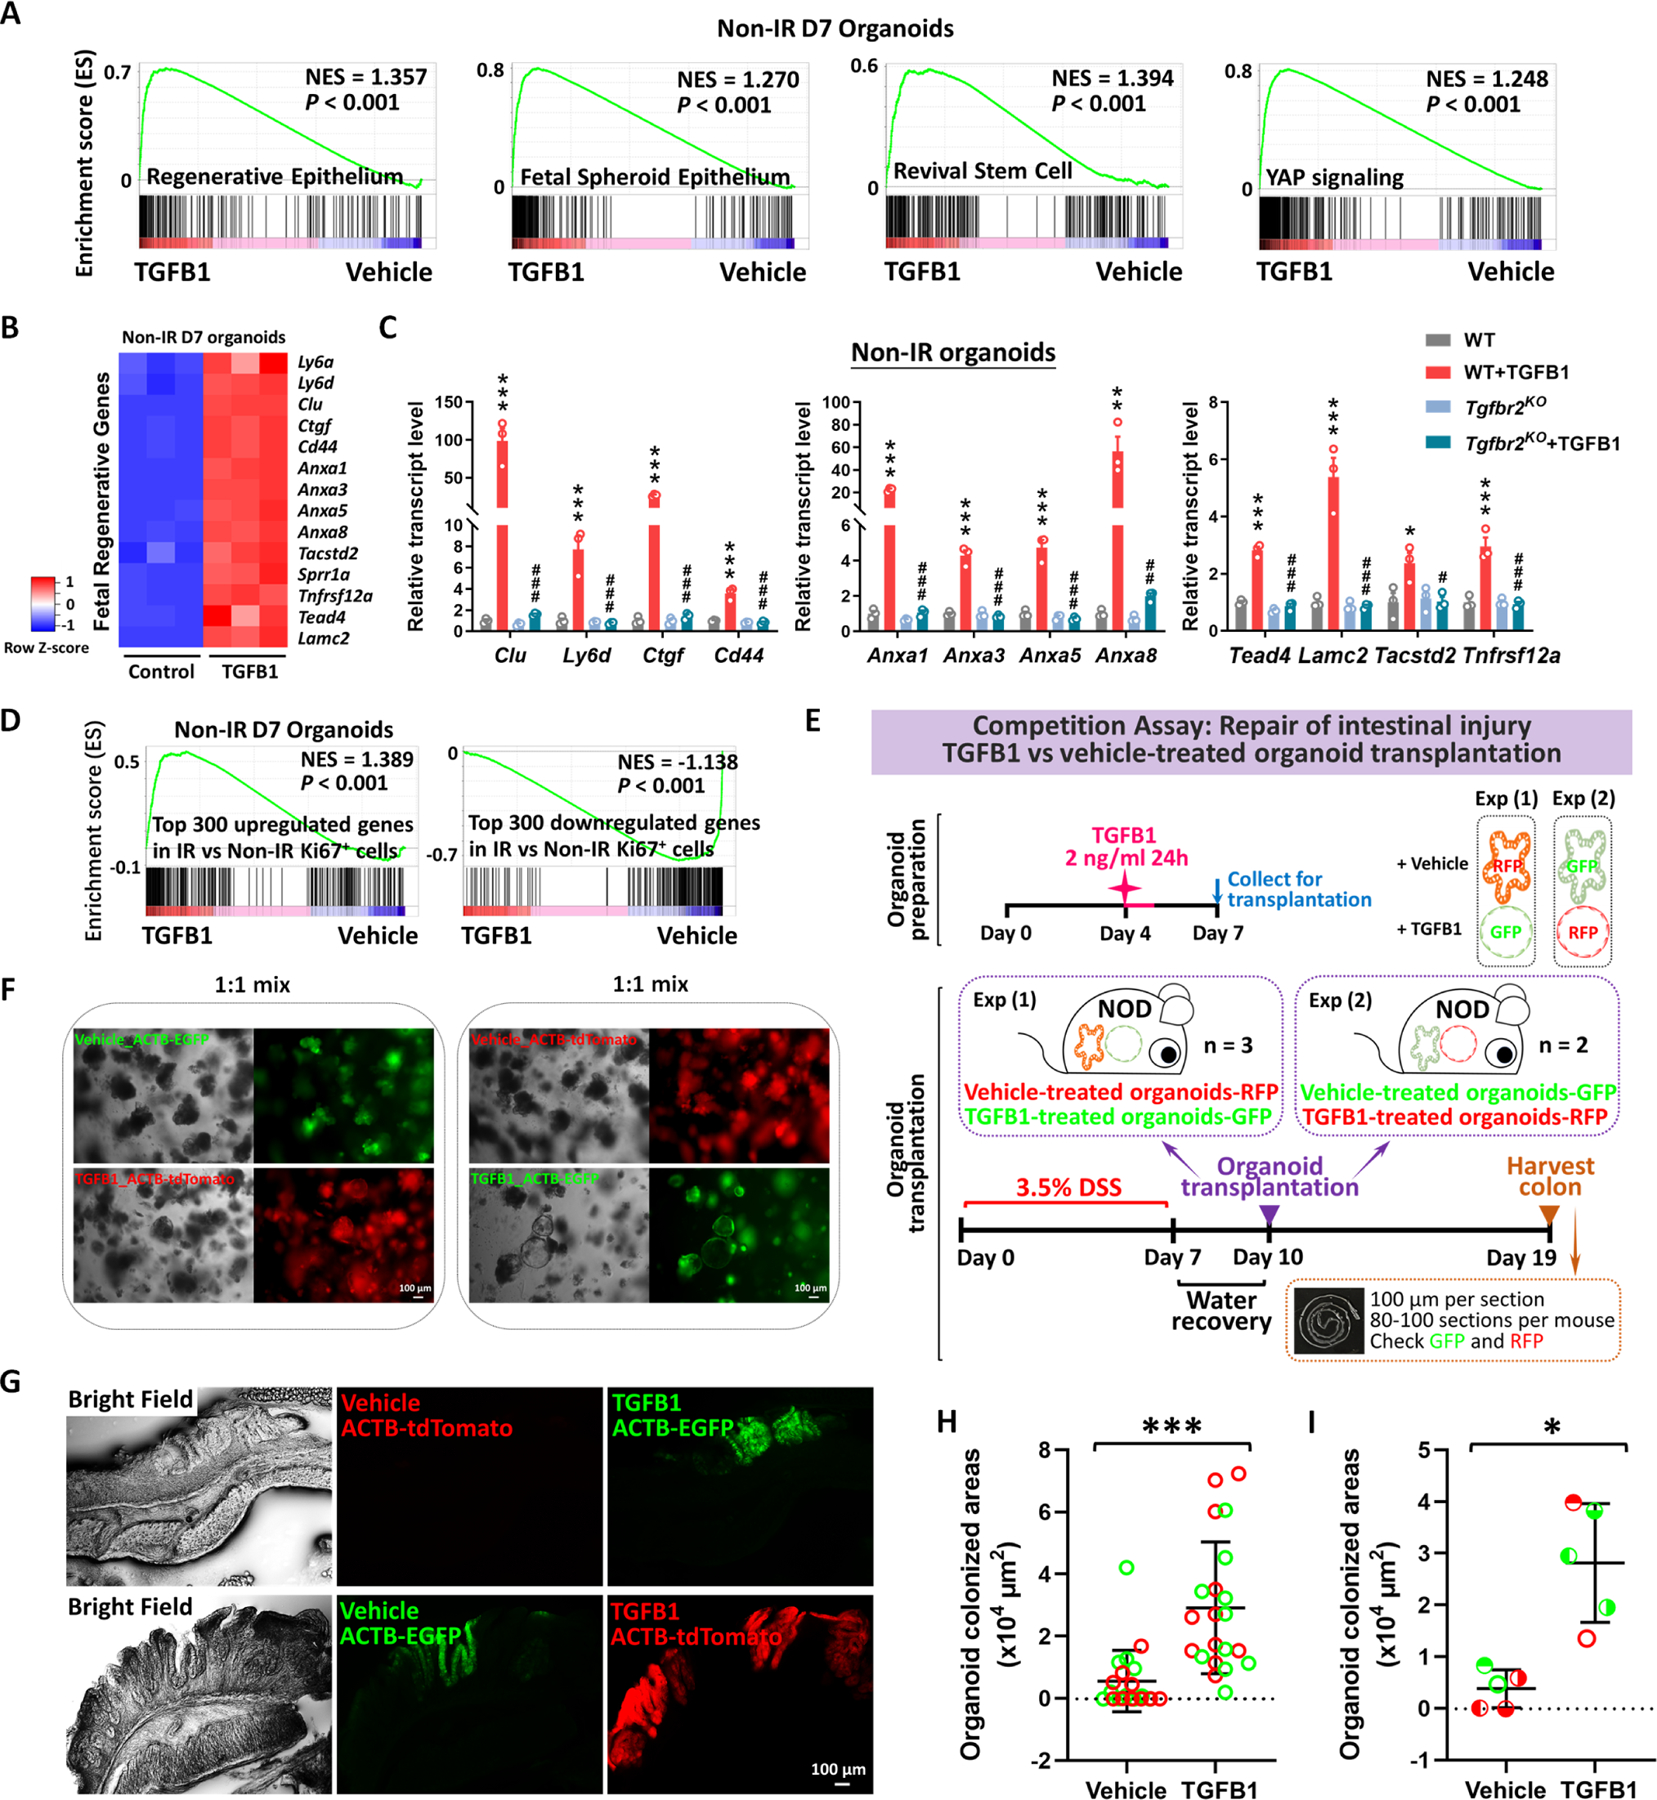
The gut epithelium has a remarkable ability to recover from damage. We employed a combination of high-throughput sequencing approaches, mouse genetics, and murine and human organoids and identified a role for TGFB signaling during intestinal regeneration following injury. At 2 days following irradiation (IR)-induced damage of intestinal crypts, a surge in TGFB1 expression is mediated by monocyte/macrophage cells at the location of damage. The depletion of macrophages or genetic disruption of TGFB signaling significantly impaired the regenerative response. Intestinal regeneration is characterized by the induction of a fetal-like transcriptional signature during repair. In organoid culture, TGFB1 treatment was necessary and sufficient to induce the fetal-like/regenerative state. Mesenchymal cells were also responsive to TGFB1 and enhanced the regenerative response. Mechanistically, pro-regenerative factors, YAP/TEAD and SOX9, are activated in the epithelium exposed to TGFB1. Finally, pre-treatment with TGFB1 enhanced the ability of primary epithelial cultures to engraft into damaged murine colon, suggesting promise for cellular therapy.

Keywords: Clu; TGFB1; fetal reversion; intestine; macrophage; monocyte; organoid transplantation; regeneration; regenerative medicine; revival stem cell.


Conflict of interest statement

Declaration of interests L.C. and M.P.V are listed inventors of a provisional patent application 63392365.

Figures

Figure 1.
Figure 1.. Crypt regeneration mainly starts 3 days after irradiation.
(A) Demonstration of intestinal regeneration following 12 Gy of irradiation of mice. Crypt cells are lost by 2 days post-irradiation (12 Gy) but restoration begins at Day 3 after irradiation, when highly proliferative regenerative clusters of cells expand, as evidenced by H&E staining and immunohistochemistry staining of stem/proliferative markers (brown color) including Ki67, OLFM4 and CD44 (representative of 3 biological replicates). (B) Immunostaining of BrdU (proliferative marker, brown color; representative of 3 biological replicates). Mice were injected with 1 mg of BrdU at Day 2 post-irradiation. Intestinal tissues were harvested after 2, 4, 6, 8, 10 and 24 hours of BrdU injection. (C) Heatmap depicts transcript levels of fetal/regenerative marker genes and regenerative stem cell-associated genes that are highly expressed at Day 3 post-irradiation (GSE165157, RNA-seq, n=2 biological replicates per time-point). (D) GSEA confirms that gene signatures of regenerative epithelium, fetal spheroid and revival stem cells,, are elevated at Day 3 post-irradiation (GSE165157, crypt cells, n=2 biological replicates per time-course, Kolmogorov-Smirnov test, P < 0.001). See expanded panel in Figure S1E. (E) scRNA-seq reveals that fetal/regenerative transcripts are elevated in irradiated crypt cells after 3 days of irradiation. Cell numbers per condition (GSE117783) for irradiated crypt cells: n=4252 and normal crypt cells: n=4328. (F) Immunostaining of Ki67 after 56 hours of irradiation vs. non-irradiation (proliferative marker, brown color; representative of 3 biological replicates). (G) scRNA-seq reveals that fetal/regenerative and reserve stem cell transcripts are elevated in sorted Ki67-RFP positive cells after 56 hours of irradiation. Number of cells in each condition was Non-IR Ki67-RFP positive cells: n=1739; IR 56h Ki67-RFP positive cells replicate 1: n=677; IR 56h Ki67-RFP positive cells replicate 2: n= 669. Ki67-RFP positive cells were isolated and sorted from crypt cells of Mki67tm1.1Cle/J mice after 56 hours of IR vs. non-IR control. IR: irradiation; Non-IR: non-irradiation (normal control). Also see Figure S1F–H.
Figure 2.
Figure 2.. TGFB1 is highly enriched in Day 3 irradiated mouse intestine, and monocytes/macrophages are likely the main cell source of TGFB1.
(A-C) Tgfb1 transcript is notably enriched in the intestine at 3 days post-irradiation. (A) Dot plots of scRNA-seq data following mouse irradiation at days 0, 1, 3, and 7: GSE165318, duodenum/jejunum boundary, n=3–4 biological replicates per time point) indicate that among secreted regulators of the TGF/BMP/WNT signaling pathways, transcripts corresponding to Tgfb1 are the most upregulated during regeneration of the gut (red box) and overlap expression of epithelial regenerative markers Clu and Ly6a. (B) Elevated Tgfb1 transcript levels are observed at days 2 to 3 post-irradiation. The qRT-PCR data are presented as mean ± SEM (n=3 biological replicates, whole duodenal fragments). Transcript levels are relative to Day 0 (before IR), statistical comparisons were performed using one-way ANOVA followed by Dunnett’s post at P < 0.01** or P < 0.05*. See schematic of experimental design in Figure S2A. (C-F) TGFB1 protein levels are elevated in the intestine at Day 3 post-irradiation. (C) Membrane-based antibody arrays: n=2 independent experiments, 2 technical replicates per membrane (See full blots in Figure S2B). (D) ELISA to measure TGFB1: Data are presented as mean ± SEM (n=3–4 biological replicates, duodenal fragments, Student’s t-test at P < 0.05*). (E) UMAP projection of all cells identifies a cell cluster expressing highest levels of Tgfb1, and these Tgfb1-expressing cells co-express markers of monocytes/macrophages. Cells per time point: D0: n=4415; D1: n=2995; D3: n=7368; D7: n=3783; D14: n=2220 (GSE165318). (F) qRT-PCR corroborates elevation of transcript levels of monocyte/macrophage marker genes at 3 days post-IR. All qRT-PCR data are presented as mean ± SEM (n=3 biological replicates, duodenal fragments, Student’s t-test at P < 0.05*). (G) Tissues from mice at different days post-12 Gy irradiation were probed for the monocyte/macrophage marker F4/80 using immunohistochemistry. An increase in F4/80 cells (brown color) occurs when the tissue begins to heal at 2 days post-IR (representative of 3 biological replicates, see quantification in Figure S2I). (H) RNAscope localized Tgfb1 transcripts relative to immunostaining signal from ECAD (epithelial marker) and F4/80 (representative of 3 biological replicates). Co-stains reveal that F4/80-marked macrophages are associated with damaged crypt epithelium at day 3 post-IR and overlap with regions of elevated levels of Tgfb1, suggesting that monocyte/macrophages are recruited to the damaged tissue and produce TGFB1.
Figure 3.
Figure 3.. TGFB pathway is required for epithelial regeneration in the intestine after irradiation.
(A) qRT-PCR analysis indicates that transcript levels of stem cell marker genes, tissue regeneration marker genes and Tgfbr2 are dynamic in during intestinal regeneration post-irradiation. The qRT-PCR data are presented as mean ± SEM (n=3 biological replicates, duodenal fragments). Transcript levels relative to Day 0 before irradiation. Statistical comparisons were performed using one-way ANOVA followed by Dunnett’s post at P < 0.001***, P < 0.01** or P < 0.05*. (B) scRNA-seq of mouse intestines across a time-course post-irradiation (GSE165318). Of all the epithelial cells in the dataset (marked by Epcam expression), there is a strong correlation between Tgfbr2-expressing cells and the subset of epithelial cells expressing regenerative markers (Ly6a and Clu, see expanded panel in Figure S3A). (C) Dot plots of epithelial cells from the same dataset reveal that Tgfbr2 is highly enriched at Day 3 post-irradiation and correlated with fetal/regenerative gene profiling. Hprt and Ap2m1 were used as reference genes. (D) RNAscope reveals elevated Tgfbr2 transcripts in the Day 3 irradiated intestine (representative of 3 biological replicates). ECAD: epithelial marker. (E) An independent scRNA-seq (GSE145866 ) dataset also reveals that transcripts related to TGFB pathway and fetal/regenerative genes are elevated at Day 3 post-irradiation in sorted Msi1-GFP positive cells (irradiation-resistant) and their progeny cells. Msi1-CreERT2; R26-mTmG mice were treated with tamoxifen for 15 hours and then used as controls or further irradiation for 1, 2, 3, and 5 days. Number of cells in each condition was Msi1_H15h: n= 2281; Msi1_IRD1: n= 1257; Msi1_IRD2: n= 1312; Msi1_IRD3: n= 2989; Msi1_IRD5: n= 1792. (F) Monocytes/Macrophages were depleted using clodronate-containing liposomes (2 treatments of 200 µl i.p. injections 72 hours pre- and day of irradiation). Tissues were assessed for regenerative cell clusters using OLFM4 immunostaining. Clodronate-treated samples shows a significant reduction in the number of OLFM4 positive regenerating cell clusters. Different symbols (circle, diamond and cruciform) represent biological replicates from three different batches of experiments (n=6–7 biological replicates, distal duodenum to proximal jejunum, Student’s t-test at P < 0.01**). (G) qRT-PCR confirms downregulated transcript levels of monocyte/macrophage marker genes, Tgfb genes, and regenerative marker genes in the intestine upon clodronate treatment (n=7–9 biological replicates, duodenal fragments, Student’s t-test at P < 0.001***, P < 0.01** or P < 0.05*). Tissues were collected 3 days post-irradiation. (H) Mice treated with 2 doses of neutralizing antibodies directed against TGFB were less efficient at regenerating post irradiation compared to control-treated mice, as measured by counting the number of proliferative foci as marked by OLFM4 immunostaining (n=3–5 biological replicates, distal duodenum to proximal jejunum, Student’s t-test at P < 0.05*). IgG or vehicle treated mice were used as control mice. Tissues were collected 3.5 days post-irradiation. (I) Tgfbr2 intestine-specific knockout restricts regeneration after irradiation (n=6 biological replicates, duodenum, Student’s t-test at P < 0.05*). (J) Smad4 intestine-specific knockout restricts regeneration after irradiation (n=6 biological replicates, Jejunum, Student’s t-test at P < 0.05*). Mice were treated with tamoxifen to inactivate Tgfbr2 or Smad4 in the intestinal epithelium 7 days before 12 Gy of irradiation. Intestine was collected 3 or 3.5 days post-IR and scored for regenerative foci using OLFM4 immunostaining.
Figure 4.
Figure 4.. TGFB1 is sufficient to induce fetal/regenerative gene signatures and increase Clu positive cells in organoid culture.
(A-E) Organoids treated with TGFB1 for 24 hours acquire a spheroid morphology (see orange arrows in panel B) and maintain expression of regeneration marker genes for at least 5 days post-TGFB1 treatment. (A) Schematic for the experiments to score morphology, counts, and bulk RNA-seq. Primary intestinal organoids were exposed to 4 Gy of irradiation on Day 4, followed by TGFB1 treatment on Day 6 for 24 hours. Organoids were collected for bulk RNA-seq on Day 7 and Day 11. (B) Representative images of irradiated organoids treated with vehicle or TGFB1. (C) Percentage of branching and spherical organoids upon TGFB1 treatment. Organoids were counted at Day 11, which is 5 days post-TGFB1 treatment (n=3 independent organoid cultures, Student’s t-test at P < 0.001). (D) Bulk RNA-seq of intestinal organoids cultured with TGFB1 for 24 hours show strong correlation with published gene signatures associated with intestinal regeneration post-DSS injury, fetal spheroid, revival stem cells and YAP signaling,,,,, as measured by GSEA (n=3 independent organoid cultures, Kolmogorov-Smirnov test). (E) Heatmaps display that RNA-seq expression levels of fetal/regenerative genes are highly expressed upon TGFB1 treatment compared to the vehicle controls (n=3 independent organoid cultures). (F) Schematic for the qRT-PCR experimental design. Primary intestinal organoids cultured from Tgfbr2KO mice (4 days post-tamoxifen) and their littermate WT controls, were exposed to 4 Gy of irradiation on Day 4, followed by TGFB1 treatment (1 ng/ml) on Day 7 for 24 hours. Organoids were collected on Day 8, Day 10 and Day 12 for qRT-PCR. (G) qRT-PCR indicates that expression of regeneration marker genes increases within 24 hours and is sustained for at least 5 days post-TGFB1 treatment in the WT organoids, but not in the Tgfbr2KO organoids. See more examples in Figure S4A. All the data are presented as mean ± SEM (n=3 independent organoid cultures). Statistical comparisons were performed using one-way ANOVA followed by Tukey’s multiple comparisons test at P < 0.001***, P < 0.01** or P < 0.05* (WT+TGFB1 vs WT); P < 0.001###, P < 0.01## or P < 0.05# (Tgfbr2KO+TGFB1 vs WT+TGFB1). (H-K) scRNA-seq of organoids post-irradiation and upon TGFB1 treatment across time points. (H) Schematic of scRNA-seq experimental design. Primary intestinal organoids were exposed to 4 Gy of irradiation on Day 4, followed by TGFB1 treatment (1 ng/ml) on Day 7. Organoids were collected for scRNA-seq after 6, 15, and 24 hours of TGFB1 treatment. Organoids treated with vehicle were used as control. (I) Dot plots show that TGFB1 activates TGFB pathway and fetal/regenerative genes in a time-dependent manner. (J) RNA velocity analysis identifies that cells in Lgr5-expressing clusters are synthesizing new Clu transcripts. (K) UMAP plots indicate that, across time points, there is a close correlation between Clu and Tgfbr2 expression. Lgr5-expressing clusters begin to overlap with Clu-expressing cells. Number of cells in each condition was Vehicle: n= 2815; TGFB1 6h: n= 4071; TGFB1 15h: n= 2788; TGFB1 24h: n=2177.
Figure 5.
Figure 5.. TGFB1-treated mesenchyme promotes fetal-like conversion of intestinal organoids.
(A) UMAP indicates Pdgfra-positive mesenchymal cells express Tgfbr2. Pdgfra positive mesenchymal cells were subset from the scRNA-seq data set featured in Figure S2H (GSE165318). (B-C) TGFB1-induces aggregation of Pdgfra-positive mesenchymal cells in a dose- and time-dependent manner (n=3 independent experiments, passaged mesenchyme). (D-F) TGFB1-treated mesenchyme induces fetal-like gene signatures in intestinal organoids upon co-culture. (D) Schematic of experimental design of co-culture. Passaged intestinal mesenchyme cells were pre-treated with vehicle, TGFB1 or TGFBR inhibitors for 3 days, and then co-cultured as overlaid matrigel bubbles containing primary organoids at day 3 post isolation. After 2 days of co-culture, organoids were collected in their matrix bubbles for qRT-PCR (n=6 independent organoid cultures with 2 different cell densities of mesenchyme). TGFB1 was removed during co-culture and only used for pre-treatment. TGFBR inhibitors were either kept (E) or removed (Figure S5E) in co-culture. (F) Mesenchyme cells pre-treated with vehicle, TGFB1 or TGFBR inhibitors for 3 days were also collected for qRT-PCR (n=3 independent mesenchyme cultures). (G) Presence of TGFBR inhibitors suppresses fetal-like conversion of intestinal organoids co-cultured with mesenchyme isolated from mice 3 days post-irradiation (n=6 independent organoid cultures with 2 different cell lines of mesenchyme). All the qRT-PCR data are presented as mean ± SEM. Transcript levels relative to vehicle control, and statistical comparisons were performed using one-way ANOVA followed by Dunnett’s post at P < 0.001***, P < 0.01** or P < 0.05*. (H-J) Tgfbr2 knockout via UBC-CreERT2 restricts regeneration after irradiation. 5-week old mice were treated with tamoxifen to inactivate Tgfbr2 in the whole body. Intestine was collected 3 days post-IR and scored for regenerative foci using OLFM4 immunostaining (n=4–5 biological replicates, duodenum, Student’s t-test at P < 0.001***). (H) Schematic of experimental design. (I) Representative images. (J) Quantification.
Figure 6.
Figure 6.. YAP-SOX9 circuit responds to TGFB1-induced open chromatin and epithelial regeneration in the intestine.
(A) TGFB1-induced accessible chromatin identified using ATAC-seq Day 11 TGFB1-treated vs. vehicle-treated organoids (Diffbind FDR < 0.01, n=3 independent cultures). The experimental design is the same as for bulk RNA-seq and shown in Figure 4A. (B) Examples of genes harboring TGFB1-induced open chromatin visualized using IGV. (C) HOMER de novo DNA-motif enrichment analysis of ATAC-seq regions (Diffbind FDR < 0.01) shows that SOX, TCF, RUNX, TEAD and SMAD binding sequences are more prevalent in accessible regions of TGFB1-treated organoids, whereas GATA, KLF and HNF4 binding sequences are more prevalent in accessible regions of vehicle-treated organoids. N.D.: Not Detectable. (D) Immunofluorescence staining of YAP and SOX9 across a time course post-irradiation (representative of 3 biological replicates). Dot plots (E) and UMAP (F) reveal that YAP-related gene signatures and Sox9 are elevated during regeneration post-irradiation, as evidenced by scRNA-seq (subset of intestinal epithelial cells, GSE165318). (G) scRNA-seq dot plots reveal that YAP related gene signatures and Sox9 are also elevated in sorted Ki67-RFP positive cells after 56 hours of irradiation. (H) scRNA-seq UMAP reveals that Tgfbr2-positive cells express Sox9 in sorted Ki67-RFP positive cells after 56 hours of irradiation. (I) Depletion of monocytes/macrophages (main cell sources of TGFB1 secretion) results in a downregulation of SOX9, as evidenced by immunostaining (representative of 3 biological replicates). (J-L) qRT-PCR indicates that TGFB1 induces expression of YAP related genes (Ptgs2 and Wnt5a) and Sox9 in WT organoids, and these effects are blocked in Tgfbr2KO or TGFBR inhibitor-treated organoids. All the qRT-PCR data are presented as mean ± SEM (n=3 independent organoid cultures). Transcript levels are relative to WT, and statistical comparisons were performed using one-way ANOVA followed by Dunnett’s post at P < 0.001***, P < 0.01** or P < 0.05*. (M) Dot plots show that TGFB1 activates YAP related gene signatures and Sox9 in a time-dependent manner (see experimental design in Figure 4H). (N) ChIP-seq shows that SMAD4 binds to gene loci of Sox9 and Ctgf in mouse intestinal epithelium (GSE112946 ). (O-Q) Loss of Sox9 blocked the induction of fetal/regenerative phenotypes induced by TGFB1 in organoids. (O) Schematic of experimental design. (P) qRT-PCR of fetal/regenerative markers. (Q) Percentage of spherical organoids upon TGFB1 treatment. Organoids were counted and collected for RNA extraction at Day 7, which is 3 days post-TGFB1 treatment. All the data are presented as mean ± SEM (n=4 independent organoid cultures). Statistical comparisons were performed using one-way ANOVA followed by Tukey’s multiple comparisons test at P < 0.001***, P < 0.01** or P < 0.05* (WT+TGFB1 vs WT); P < 0.001###, P < 0.01## or P < 0.05# (Sox9KO+TGFB1 vs WT+TGFB1). (R) Loss of Sox9 restricts regeneration after irradiation, as evidenced by OLFM4 immunostaining. Mice were treated with tamoxifen to inactivate Sox9 in the intestinal epithelium 7 days before 12 Gy of irradiation. Intestine was collected 3.5 days post-IR (representative of 3 biological replicates).
Figure 7.
Figure 7.. Transplantation of TGFB1-treated organoids enhances engraftment into DSS-treated mice.
(A) Gene signatures of regenerative epithelium, fetal spheroids, revival stem cells and YAP signaling,,,, are each elevated post-TGFB1 treatment, as assayed by GSEA in non-irradiated conditions (n=3 independent organoid cultures, Kolmogorov-Smirnov test, P < 0.001). (B) Heatmaps display that RNA-seq expression levels of fetal/regenerative genes are highly expressed upon TGFB1 treatment compared to the vehicle controls (n=3 independent organoid cultures). Schematic of experimental design for bulk RNA-seq for panels A-B is depicted in Figure S7A. (C) For non-IR organoids, to deplete Tgfbr2, the primary organoids were treated with 1 μM tamoxifen for 12 hours on Day 3, followed with TGFB1 (2 ng/ml) treatment on Day 6. Organoids were collected 24 hours after TGFB1 treatment. All the data are presented as mean ± SEM (n=3 independent organoid cultures). Statistical comparisons were performed using one-way ANOVA followed by Tukey’s multiple comparisons test at P < 0.001***, P < 0.01** or P < 0.05* (WT+TGFB1 vs WT); P < 0.001###, P < 0.01## or P < 0.05# (Tgfbr2KO+TGFB1 vs WT+TGFB1). (D) GSEA reveals that genes upregulated or downregulated upon TGFB1 treatment strongly correlate with transcriptional changes in Ki67-RFP cells from the intestine of mice with irradiation vs. non-irradiation, respectively, as described in Figure 1 (Kolmogorov-Smirnov test, P < 0.001, n=3 independent organoid cultures). (E) Experimental design for organoid transplantation assay, to determine the ability of TGFB1 to prime organoids in culture prior to transplantation for engrafting into damaged colonic tissue. Transgenic organoid lines were used to later help visualize transplants. Organoids were treated with either vehicle or with TGFB1 to induce regenerative properties. To induce epithelial damage in the mouse intestine, 3.5% DSS was prepared in drinking water and fed to NOD mice for 7 days. After a period of water recovery, the treated and control organoids were mixed 1:1 and used for enema-based transplant. Either vehicle-treated organoids with RFP were mixed with TGFB1-treated organoids with GFP; or vehicle-treated organoids with GFP were mixed with TGFB1-treated organoids with RFP. Organoid mixtures were transferred into DSS-treated mice on Day 10. Colon tissues were collected on Day 19, and cryosections were prepared for checking GFP or RFP under fluorescence microscope. (F) Representative images of organoids used for transplantation. (G-I) Representative images and quantification of transplant efficiency upon TGFB1 pre-treatment. (G) Fluorescent micrographs demonstrating transgenic organoid grafts into mice. (H) The size of grafts observed. (I) The average area of organoid grafts per mouse. Color indicates whether transplanted organoids derived from red or green fluorescent lines. Symbol type represents a single mouse used in the competition assay (n=21 grafts from 5 mice, Student’s t-test at P < 0.001*** or P < 0.05*).

Update of

References

    1. Metcalfe C, Kljavin NM, Ybarra R, and de Sauvage FJ (2014). Lgr5(+) Stem Cells Are Indispensable for Radiation-Induced Intestinal Regeneration. Cell stem cell 14, 149–159. 10.1016/j.stem.2013.11.008. - DOI - PubMed
    1. van Es JH, Sato T, van de Wetering M, Lyubimova A, Nee ANY, Gregorieff A, Sasaki N, Zeinstra L, van den Born M, Korving J, et al. (2012). Dll1(+) secretory progenitor cells revert to stem cells upon crypt damage. Nat Cell Biol 14, 1099-+. 10.1038/ncb2581. - DOI - PMC - PubMed
    1. Tomic G, Morrissey E, Kozar S, Ben-Moshe S, Hoyle A, Azzarelli R, Kemp R, Chilamakuri CSR, Itzkovitz S, Philpott A, and Winton DJ (2018). Phospho-regulation of ATOH1 Is Required for Plasticity of Secretory Progenitors and Tissue Regeneration. Cell stem cell 23, 436-+. 10.1016/j.stem.2018.07.002. - DOI - PMC - PubMed
    1. Yu S, Tong K, Zhao Y, Balasubramanian I, Yap GS, Ferraris RP, Bonder EM, Verzi MP, and Gao N (2018). Paneth Cell Multipotency Induced by Notch Activation following Injury. Cell stem cell 23, 46–59 e45. 10.1016/j.stem.2018.05.002. - DOI - PMC - PubMed
    1. Tetteh PW, Basak O, Farin HF, Wiebrands K, Kretzschmar K, Begthel H, van den Born M, Korving J, de Sauvage F, van Es JH, et al. (2016). Replacement of Lost Lgr5-Positive Stem Cells through Plasticity of Their Enterocyte-Lineage Daughters. Cell stem cell 18, 203–213. 10.1016/j.stem.2016.01.001. - DOI - PubMed

Publication types

Substances