. 2023 Nov 9;186(23):5135-5150.e28.
doi: 10.1016/j.cell.2023.09.016. Epub 2023 Oct 20.

Mechanopathology of biofilm-like Mycobacterium tuberculosis cords

Affiliations

Mechanopathology of biofilm-like Mycobacterium tuberculosis cords

Richa Mishra et al. Cell. .

Abstract

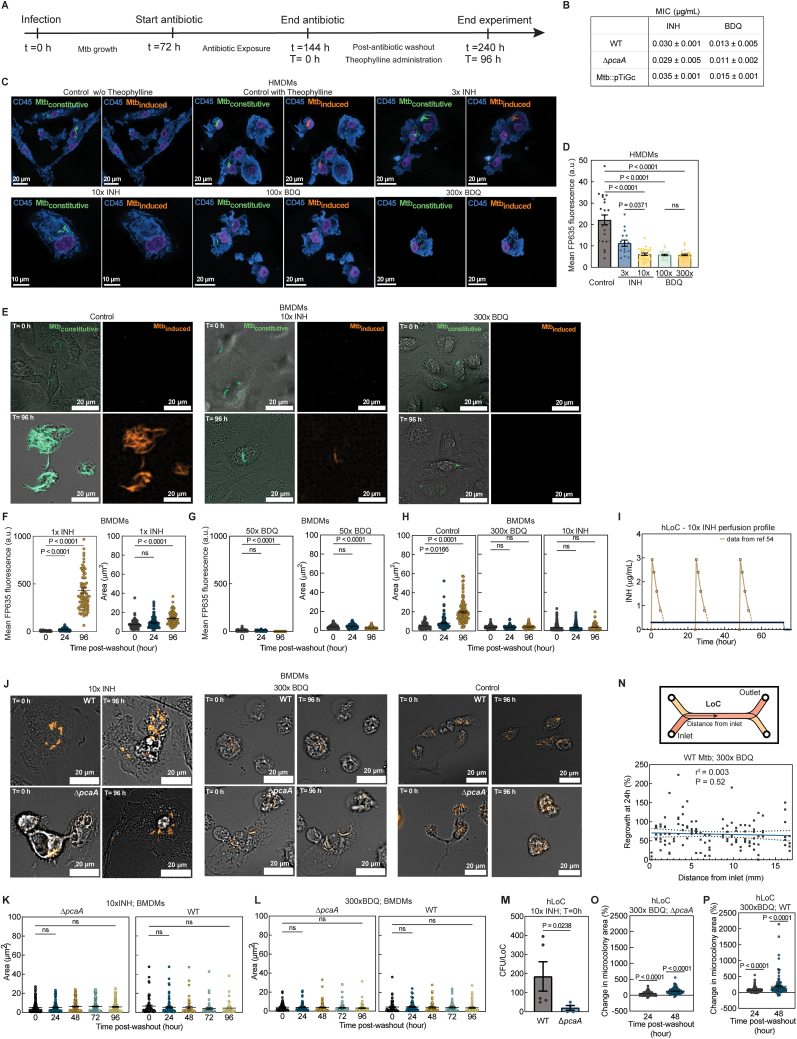
Mycobacterium tuberculosis (Mtb) cultured axenically without detergent forms biofilm-like cords, a clinical identifier of virulence. In lung-on-chip (LoC) and mouse models, cords in alveolar cells contribute to suppression of innate immune signaling via nuclear compression. Thereafter, extracellular cords cause contact-dependent phagocyte death but grow intercellularly between epithelial cells. The absence of these mechanopathological mechanisms explains the greater proportion of alveolar lesions with increased immune infiltration and dissemination defects in cording-deficient Mtb infections. Compression of Mtb lipid monolayers induces a phase transition that enables mechanical energy storage. Agent-based simulations demonstrate that the increased energy storage capacity is sufficient for the formation of cords that maintain structural integrity despite mechanical perturbation. Bacteria in cords remain translationally active despite antibiotic exposure and regrow rapidly upon cessation of treatment. This study provides a conceptual framework for the biophysics and function in tuberculosis infection and therapy of cord architectures independent of mechanisms ascribed to single bacteria.

Keywords: Mycobacterium tuberculosis; agent-based model; antibiotic therapy; biofilms; cords; lung-on-chip; mechanobiology; mycomembrane; serial block scanning face electron microscopy.


Conflict of interest statement

Declaration of interests The authors declare no competing interests.

Figures

None
Graphical abstract
Figure 1
Figure 1
Air-liquid-interface-induced mycolic acid remodeling causes intracellular Mtb cord growth in early infection (A) Snapshots of Mtb architectures in detergent-free axenic culture. (B) Classification of Mtb architectures. (C) Time-lapse snapshots of WT cord growth in macrophages (top) and ATs (below) in surfactant-competent murine LoCs. NS, normal surfactant levels. (D and E) Confocal images of intracellular WT cords in macrophages (D, top, and E) and an AT (D, bottom, and E) in murine (D) and human (E) LoCs. (F) Representative volumetric EM images and 3D reconstruction of a WT cord in a murine AT at 4 dpi. Cell boundary (yellow line). Zooms: lipid inclusions (arrowheads), lipid droplets (asterisk) in Mtb (amber). (G and H) Expression levels of indicated genes in Mtb cultured axenically with or without exposure to Curosurf (G, n = 5) and in human LoCs at 3 dpi (H, n = 4). RE, relative expression. (I) Confocal images of ΔpcaA clumps in macrophages (top) and an AT (bottom) in human LoCs. (J) Representative images of WT cords in alveolar macrophages (AMs) explanted from C57BL/6 mice at 7 dpi. SiglecF (pink), CD45 (blue), and nucleus (purple). (K, L, N, and O) Representative slices and 3D views of intracellular WT cords (K and N) and ΔpcaA clumps (L and O) in AMs of C57BL/6 mice at 7 dpi (K and L) and C3HeB/FeJ mice at 15 dpi (N and O). CD45 (pink) and PDPN (green). (M) Aspect ratios for WT cords and ΔpcaA clumps (n > 42 from LoCs, n > 18 from mice). See also Figure S1 and Video S1.
Figure S1
Figure S1
Mtb cording in the LoC and mouse models, related to Figure 1 (A) Schematic of LoC models. (B) Time-lapse snapshots of WT cords in macrophages (top) and ATs (below) in surfactant-deficient (DS) murine LoCs. (C) Confocal images of WT-infected BMDMs at 4 dpi. CD45 (blue). (D) Expression levels of the indicated genes in Mtb cultured axenically and from human LoCs at 3 dpi (n = 4). RE, relative expression. (E and F) Snapshots (E) and aspect ratios (F) of WT, ΔpcaA, and ΔpcaA attB::pcaA Mtb microcolonies cultured in detergent-free 7H9 (n > 33). (G) Non-growing fraction per field of view (FOV) for WT- and ΔpcaA-infected murine LoCs (n > 30 FOVs from n = 2 LoCs). (H and I) WT and ΔpcaA microcolony growth rates in macrophages and ATs in murine LoCs reconstituted with NS ATs (H) and DS ATs (I) (n > 110 for WT and n > 49 for ΔpcaA from n = 2 LoCs). (J and K) 3D views of WT cords in explanted AMs (J) and maximum intensity projection of WT cords in explanted AT1 cells (K) from C57BL/6 lungs at 7 dpi. CD45 (blue) and PDPN (green). (L and M) 3D views (L and M) and representative slice (L) of WT cords intracellular in AMs (L) and an AT (M) in C57BL/6 lungs at 7 dpi. CD45 (pink) and PDPN (green). (N–P) 3D views and representative slices of intracellular WT cords (N and O) and ΔpcaA clumps (P) in AMs (N and O) and an AT (P) in C3HeB/FeJ lungs at 15 dpi. (Q) Lung CFUs from WT-, ΔpcaA-, and ΔpcaA attB::pcaA Mtb-infected C3HeB/FeJ mice at all time points in this study. ns, not significant (n > 4 mice). (R) EsxB production by WT and ΔpcaA relative to GroEL2. (S) PDIM production by WT and ΔpcaA.
Figure S2
Figure S2
Nuclear compression and hypoinflammatory responses due to Mtb cording, related to Figure 2 (A and B) 3D views and representative slices of foci of infection in (A) WT- and (B) ΔpcaA-infected C3HeB/FeJ lungs at 15 dpi. CD45 (pink) and PDPN (green). (C) Representative 3D views from the epithelial face of WT- and ΔpcaA-infected human LoCs at 4 dpi. IFNB1 (pink), IL1B (yellow), IL6 (gray), and CD45 (blue surfaces). (D) RNAscope characterization of IL-6 levels from the epithelial face of WT- and ΔpcaA-infected human LoCs (n > 6 FOVs from n = 2 LoCs) at 4 dpi. (E and F) 3D views and representative slices of heavily infected AMs in (E) WT- and (F) ΔpcaA-infected C3HeB/FeJ lungs at 15 dpi. CD45 (pink) and PDPN (green). (G) 3D views, representative slice, and reconstruction of a heavily infected AT in WT-infected C3HeB/FeJ lungs at 28 dpi. (H) 3D view and XZ orthosection of an intracellular WT cord in murine AT cell monolayers at 3 dpi. (I) Representative volumetric EM images and 3D reconstruction of a WT cord in a murine AT at 4 dpi. Cell boundary (yellow line), white arrowhead: direct contact between nucleus and cord. (J) 3D views and representative slices of infections of AT cells in WT-infected C57BL/6 lungs at 15 dpi.
Figure 2
Figure 2
Sustained compression of host cell nuclei by intracellular Mtb cords leads to HDAC1-mediated immunosuppression (A) Transcriptional response of WT- and ΔpcaA-infected C3HeB/FeJ lungs at 15 dpi (top), and BMDMs at 12 h post-exposure (hpe) to WT and ΔpcaA surface lipid monolayers (bottom). (B) Immunoblot assays on human LoC effluent collected up to 4 dpi. (C and D) RNAscope characterization of selected markers from the epithelial face of control, WT-, and ΔpcaA-infected human LoCs (n > 6 fields of view from n = 2 LoCs) at 4 dpi. (E) Representative 3D views of WT-infected (left) and ΔpcaA-infected (right) AMs within C3HeB/FeJ lungs at 15 dpi. CD45 (pink), PDPN (green), and nucleus (purple surface). (F) Nuclear volume of heavily infected AMs within WT- and ΔpcaA-infected C3HeB/FeJ lungs at 15 dpi (n > 8 from n = 2 mice). (G) Representative 3D view of a WT-infected AT cell within C3HeB/FeJ lungs at 28 dpi. (H) 3D reconstruction from volumetric EM of a WT cord indenting the cellular nucleus (arrowhead, bottom) in a murine AT cell at 4 dpi. (I) Transcriptional response of BMDMs at 12 hpe to WT surface lipids monolayers cultured with or without 10% PEG. (J) Mtb microcolony area in WT-infected BMDMs at 2 dpi with the combinatorial addition of 10% PEG and IFN-γ (n > 95). (K) Mean HDAC1 intensity in WT-infected BMDM nuclei cultured with or without 10% PEG (n > 179). (L) Hdac1 expression in uninfected, WT-, and ΔpcaA-infected C3HeB/FeJ lungs at 15 dpi (n = 5 mice). (M) Mean nuclear HDAC1 intensity at foci of infection in WT- and ΔpcaA-infected C3HeB/FeJ lungs at 15 dpi (n > 895 from n = 3 mice). See also Figures S2 and S3.
Figure S3
Figure S3
PEG-induced compression attenuates inflammatory responses and HDAC1 expression in early TB, related to Figure 2 (A and B) Representative maximum intensity projections and 3D views of BMDM nuclei (A) and nuclear volume (B) cultured with or without 10% PEG (n > 550). (C) Cell length of WT and ΔpcaA (n = 125) cultured axenically with or without 10% PEG. (D) Transcriptional response of BMDMs at 12 hpe to LPS and IFN-γ cultured with or without 10% PEG. (E) Representative images of WT-infected BMDMs at 2 dpi with the combinatorial addition of 10% PEG and IFN-γ. (F) Microcolony area in WT-infected BMDMs with or without IFN-γ pre-exposure at 0 dpi (n > 80). (G–J) Representative 3D views (G and H) and expression of HDAC3 (I) and HDAC1 (J) in BMDMs 12 hpe to LPS cultured with or without 10% PEG. HDAC3 (G, yellow), HDAC1 (H, yellow), and CD45 (blue) (n > 41). (K) Hdac1-9 expression in infected AMs and interstitial macrophages relative to uninfected bystanders at 15 dpi. Data from Pisu et al. (L) Representative images of WT-infected BMDMs pre-stimulated with IFN-γ cultured with or without 10% PEG. CD45 (blue) and HDAC1 (yellow). (M) Representative slices from foci of infection in WT- and ΔpcaA-infected C3HeB/FeJ lungs at 15 dpi. CD45 (pink) and HDAC1 (yellow).
Figure 3
Figure 3
Intercellular Mtb cord growth facilitates Mtb dissemination with reduced tissue inflammation (A) Representative tile scans of WT-infected (left) and ΔpcaA-infected (right) C3HeB/FeJ lungs at 56 dpi. CD45 (pink) and PDPN (green). (B) Mean distance of WT and ΔpcaA lesions from alveoli in C3HeB/FeJ lungs (n > 10 scans from n = 3 mice) at 28 (top) and 56 dpi (bottom). (C) CFUs from WT- and ΔpcaA-infected C3HeB/FeJ spleens at 15 and 28 dpi (n > 10 mice). (D) Modular transcriptional analysis of WT- and ΔpcaA-infected C3HeB/FeJ lungs (n = 8 mice) at 56 dpi. Green (over-abundant) and pink (under-abundant) modules, compared with controls (n = 6 mice); color intensity and dot size represent degree of perturbation; false discovery rate (FDR) < 0.05 considered significant. (E) Volume to binding box length ratio for WT and ΔpcaA aggregates in C3HeB/FeJ lungs (n > 671 from n = 4 mice) at 15 and 28 dpi. (F) Time-lapse snapshots of WT (top) and ΔpcaA-infected murine LoCs. Arrowheads: macrophages interacting with Mtb aggregates, GFP macrophages (blue). (G) Confocal images from a human LoC showing WT cords intercellular between AT cells. Arrow: dying macrophage (bottom). Actin (pink) and CD45 (blue). (H) 3D volumetric EM of an intercellular WT cord (amber) between the plasma membranes of adjacent cells (yellow) in XY, YZ, and XZ slices. (I and J) 3D reconstruction of a WT intercellular cord (I) in between live AT cells and a ΔpcaA clump on top of live AT cells (J). Sparkles: debris of the original host cells. (K) 3D views of an intercellular WT cord in a C3HeB/FeJ lung at 28 dpi. CD45 (pink), PDPN (green), and nucleus (purple). See also Figure S4 and Video S2.
Figure S4
Figure S4
Immunopathological differences between WT- and ΔpcaA-infected lesions, related to Figure 3 (A) Representative tile scans of WT- and ΔpcaA-infected C3HeB/FeJ lungs at 28 dpi. CD45 (pink) and PDPN (green). (B and C) Representative images and fractional area of inflammation from hematoxylin and eosin (H&E)-stained WT- and ΔpcaA-infected C3HeB/FeJ lungs at 56 dpi. (n > 6 FOV from n = 3 mice.) (D) CFUs from C3HeB/FeJ spleens infected with WT, ΔpcaA, and ΔpcaA attB::pcaA at 15 and 28 dpi (n > 3 mice). (E) Expression levels of indicated genes in WT- and ΔpcaA-infected C3HeB/FeJ lungs at 56 dpi (n > 6 mice). (F) GSEA running enrichment score plot between WT- and ΔpcaA-infected C3HeB/FeJ mice at 56 dpi (n = 8 mice). (G) Mtb aggregates’ volume in WT- and ΔpcaA-infected C3HeB/FeJ lungs at 15 and 28 dpi (n > 671 from n = 4 mice). (H) 3D views and YZ orthosections of an intercellular WT cord in a murine AT monolayer, with (top) or without the cord shown (bottom). Actin (pink) and nucleus (purple). (I) 3D views and YZ orthosections of a ΔpcaA clump above an AT monolayer. Nuclear debris of the original host cell (gray surface). (J) XZ and YZ slices from 3D volumetric EM image of the ΔpcaA clump (amber) in Figure 3J. (K) Extended 2D views of an intercellular cord in WT-infected C3HeB/FeJ lungs at 15 dpi. CD45 (pink) and PDPN (green). (L) 3D and extended 2D views and a representative slice of an intercellular cord at the center of a WT lesion in C3HeB/FeJ lungs at 28 dpi. (M) 3D views and a representative slice of ΔpcaA lesions in C3HeB/FeJ lungs at 28 dpi.
Figure 4
Figure 4
Surface lipid compressibility explains tight-packing and long-range order in Mtb cords (A) 3D vector plot of an intercellular WT cord and an extracellular ΔpcaA clump from Figures 3I and 3J. (B) 2D-binned histogram of the alignment (cosθ) vs. distance between randomly chosen bacterial pairs. White line: . (C) Histogram and cumulative probability curves of distance from (B). (D–F) Schematic (D) and plots of (E) surface pressure Π and (F) normalized compressibility vs. relative area for Langmuir monolayers of WT and ΔpcaA surface lipids (n = 3 technical replicates). (F, inset) Energy stored: reversible work (gray) and latent heat (green). (G) Schematic of interaction forces and Ecollapse in the agent-based model. (H) Simulated microcolony growth for low and high Ecollapse. (I) Simulated microcolonies with a sweep of Ecollapse and Fnoise applied during growth. (J) Phase diagram (n = 20 simulations) of the median colony aspect ratio as a function of Ecollapse and Fnoise. (K) Classification of microcolony architectures into cords and clumps. See also Figure S5 and Video S3.
Figure S5
Figure S5
Worm-like bundle model for WT cords, related to Figure 4 (A) 3D vector plot of the intercellular WT cord in Figure 3H. (B) Log () vs. fractional arclength along an XY projection. Dashed lines: intracellular cords in Figures 1D and S2I; solid lines: intercellular cords in Figure 3I and in (A). (C) Persistence length to arclength ratio lps, obtained from (B). (D) Normalized compressibility vs. surface pressure for Langmuir monolayers of WT and ΔpcaA surface lipids. (E) ΠA isotherms for WT lipids at different temperatures (n = 3 technical replicates in D and E).
Figure 5
Figure 5
Cord architectures are resilient to mechanical perturbation and can exert forces (A) Fext applied to bacteria in the pink area of microcolonies with high and low Ecollapse. (B) Simulated microcolonies with a sweep of Ecollapse and Fext, applied during the last cell cycle. Black stars: microcolonies that separate into two. (C) Phase diagram of colony aspect ratio as a function of Ecollapse and Fext. (D) Classification of microcolony architectures into cords and clumps. (E) Colony aspect ratio as a function of Fext, for several values of Ecollapse. (F) Fmax as a function of Ecollapse. Green line: spline fit. In (C)–(F), median values from n = 25 agent-based simulations. See also Video S4.
Figure S6
Figure S6
Mtb response to antibiotic therapy, related to Figure 6 (A) Timeline of Mtb infection, antibiotic treatment, and washout in all experiments. (B) Axenic culture MICs. (C and D) Representative confocal images (C) and mean FP635 fluorescence (D) of Mtb::pTiGc-infected, antibiotic-treated HMDMs at T = 24 h (n > 16). Constitutive GFP (green), inducible FP635 (amber), and CD45 (blue). (E) Representative wide-field images of Mtb::pTiGc-infected, antibiotic-treated BMDMs at T = 0 and 96 h. (F and G) Mean FP635 fluorescence and Mtb::pTiGc microcolony area at T = 0, 24, and 96 h in 1× INH (F) and 50× BDQ-treated BMDMs (G) (n > 70 foci of infection). (H) Mtb::pTiGc microcolony area in antibiotic-treated BMDMs at T= 0, 24, and 96 h (n > 90 foci of infection). (I) AUC of serum INH and for 10× INH perfusion in human LoCs. (J) Representative wide-field images of WT- and ΔpcaA-infected, antibiotic-treated BMDMs at T = 0 and 96 h. Bacteria (amber). (K and L) ΔpcaA and WT microcolony area in 10× INH- (K) and 300× BDQ-treated BMDMs (L) at T = 0–96 h (n > 80 foci of infection). (M) CFU from WT- and ΔpcaA-infected human LoCs treated with 10× INH at T = 0 h (n > 4). (N–P) Change in bacterial microcolony area over T = 24 h (N) and T = 24–48 h relative to T = 0 h in (O) ΔpcaA- and (N and P) WT-infected human LoCs and treated with 300× BDQ (n > 80 foci of infection from n = 2 LoCs, n = 26 spatial locations in N).
Figure 6
Figure 6
Mtb cords harbor antibiotic-tolerant bacteria (A) Mean FP635 fluorescence of Mtb::pTiGc in antibiotic-treated BMDMs (n > 65) after antibiotic washout. (B) Mean FP635 fluorescence of Mtb::pTiGc in antibiotic-treated human LoCs (n > 5 from n = 2 LoCs) at T = 24 h. (C) Representative confocal images of Mtb::pTiGc-infected human LoCs treated with antibiotics at T = 24 h. Constitutive GFP (green), inducible FP635 (amber), and CD45 (blue). (D–G) Representative time-lapse microscopy snapshots of (D and F) ΔpcaA-infected and (E and G) WT-infected human LoCs (E and G) treated with 10× INH (D and E) and 1,000× BDQ (F and G) at T = 0, 24, and 96 h. Bacteria (amber). (H–K) Change in bacterial microcolony area over T = 24–96 h relative to T = 0 h in ΔpcaA-infected (H and J) and WT-infected (I and K) human LoCs treated with 10× INH (H and I, n > 71 foci of infection from n = 3 LoCs) and 1,000× BDQ (J and K, n > 43 foci of infection from n = 2 LoCs). Scale bars, 20 μm. See also Figure S6.
Figure S7
Figure S7
Summary of the mechanopathological effects of Mtb cording, related to Figures 1, 2, 3, 4, and 6

Comment in

References

    1. Middlebrook G., Dubos R.J., Pierce C. Virulence and morphological characteristics of mammalian tubercule bacilli. J. Exp. Med. 1947;86:175–184. - PMC - PubMed
    1. Ojha A.K., Baughn A.D., Sambandan D., Hsu T., Trivelli X., Guerardel Y., Alahari A., Kremer L., Jacobs W.R., Hatfull G.F. Growth of Mycobacterium tuberculosis biofilms containing free mycolic acids and harbouring drug-tolerant bacteria. Mol. Microbiol. 2008;69:164–174. doi: 10.1111/j.1365-2958.2008.06274.x. - DOI - PMC - PubMed
    1. McCarter Y.S., Ratkiewicz I.N., Robinson A. Cord formation in Bactec medium is a reliable, rapid method for presumptive identification of Mycobacterium tuberculosis complex. J. Clin. Microbiol. 1998;36:2769–2771. doi: 10.1128/JCM.36.9.2769-2771.1998. - DOI - PMC - PubMed
    1. Shepard C.C. Growth characteristics of tubercule bacilli and certain other mycobacteria in HeLa cells. J. Exp. Med. 1957;105:39–48. doi: 10.1084/JEM.105.1.39. - DOI - PMC - PubMed
    1. Bernut A., Herrmann J.-L., Kissa K., Dubremetz J.-F., Gaillard J.-L., Lutfalla G., Kremer L. Mycobacterium abscessus cording prevents phagocytosis and promotes abscess formation. Proc. Natl. Acad. Sci. USA. 2014;111:E943–E952. doi: 10.1073/pnas.1321390111. - DOI - PMC - PubMed

Publication types