. 2023 Nov 21;4(11):101248.
doi: 10.1016/j.xcrm.2023.101248. Epub 2023 Oct 20.

Desmoplastic stromal signatures predict patient outcomes in pancreatic ductal adenocarcinoma

Affiliations

Desmoplastic stromal signatures predict patient outcomes in pancreatic ductal adenocarcinoma

Shamik Mascharak et al. Cell Rep Med. .

Abstract

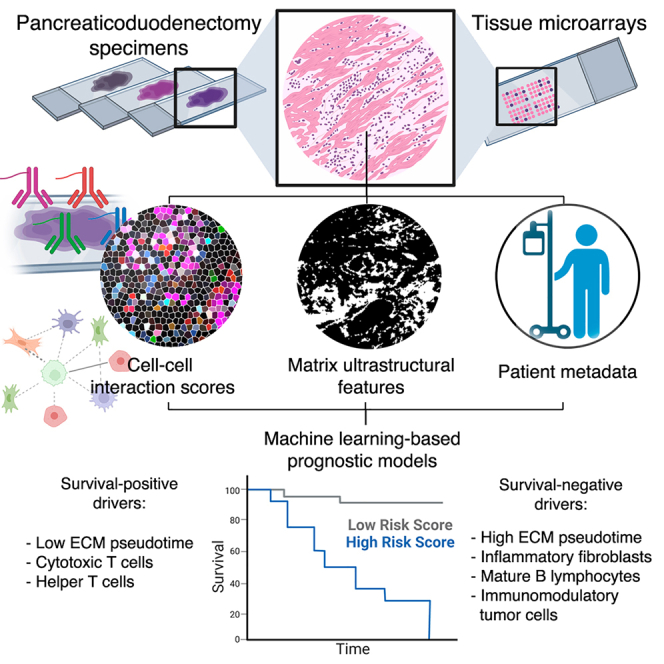
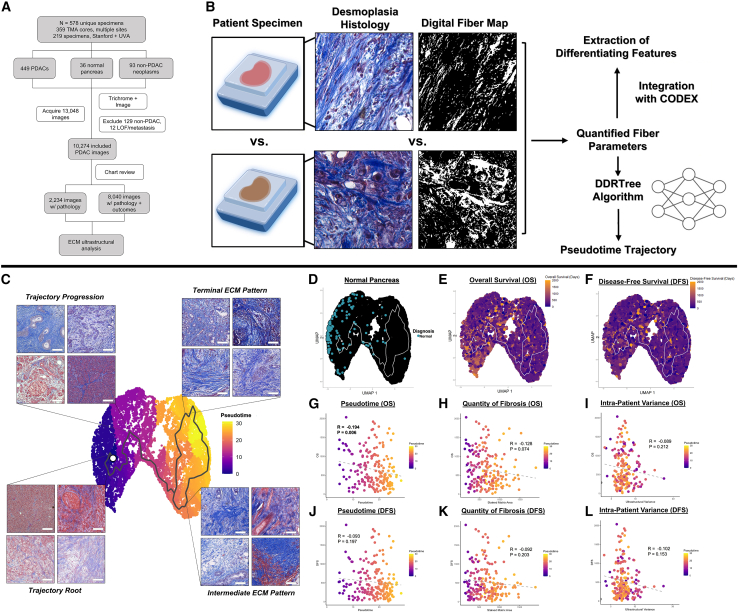
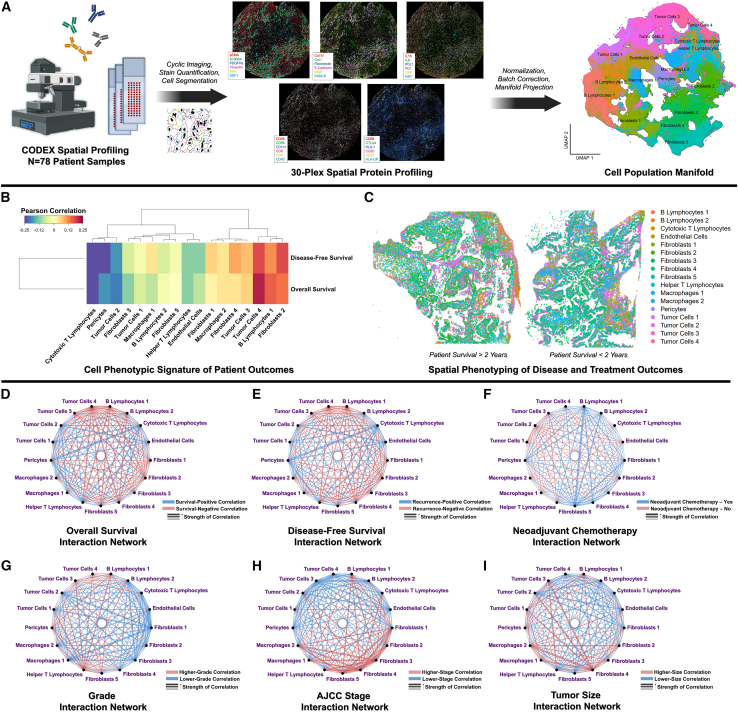
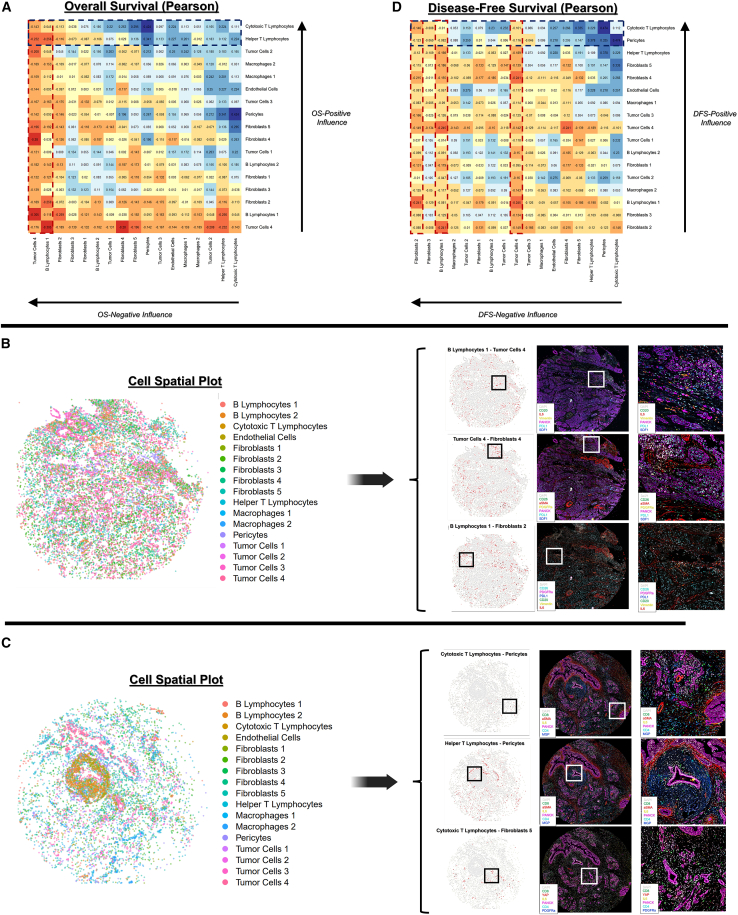
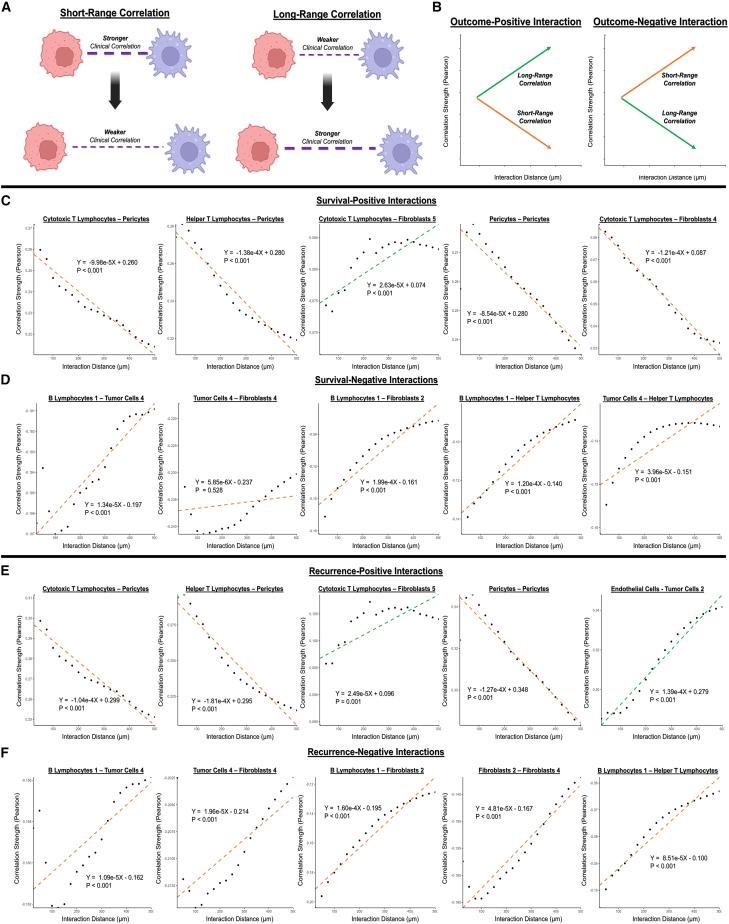
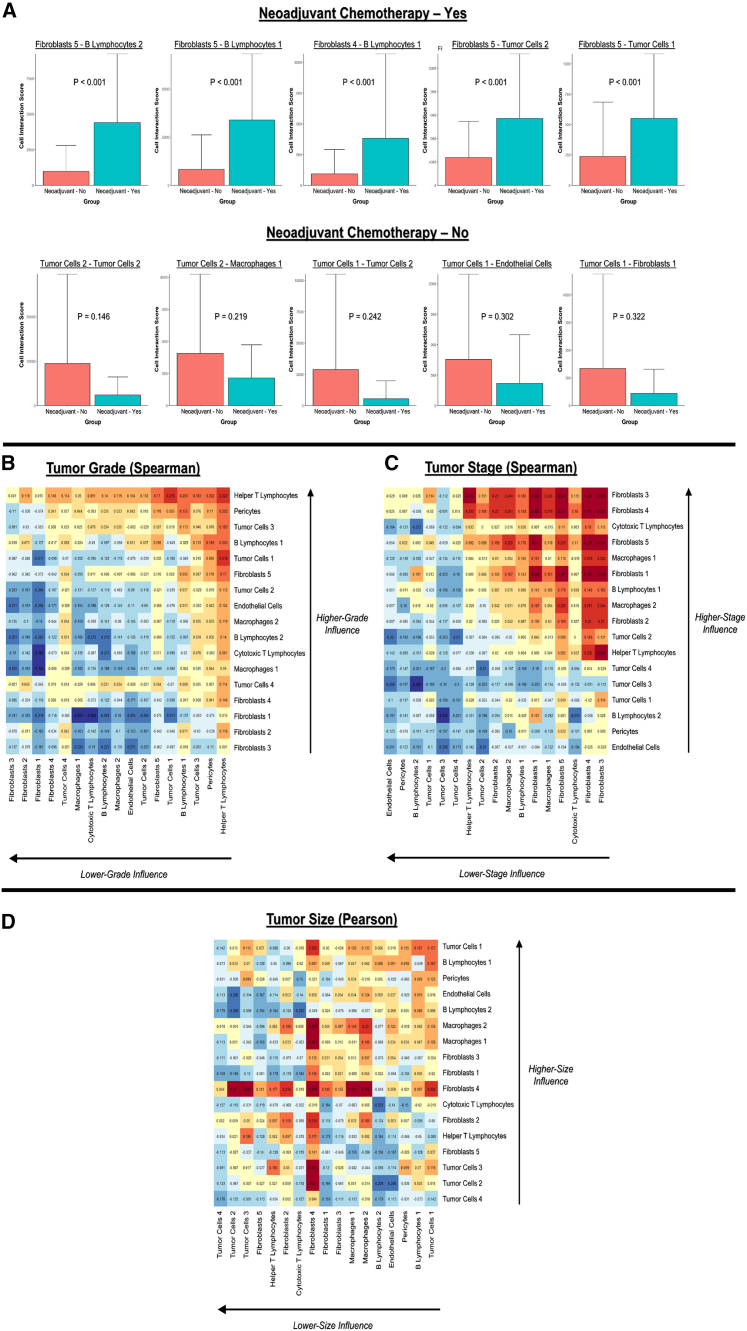
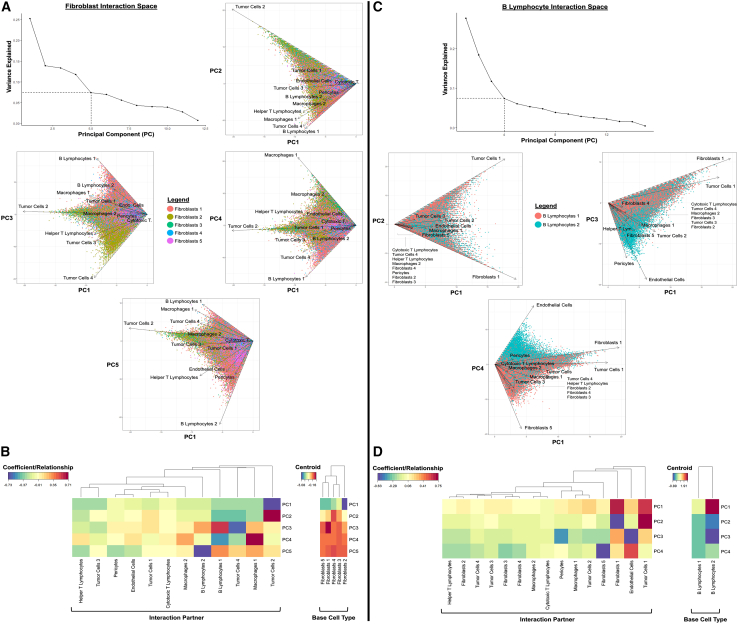
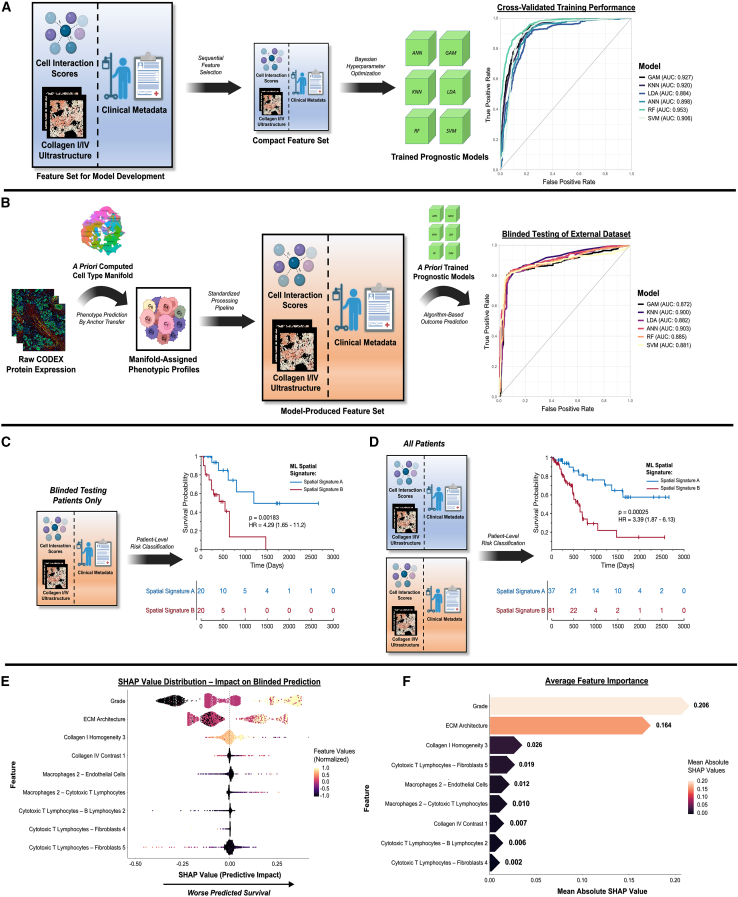
Pancreatic ductal adenocarcinoma (PDAC) is projected to become the second leading cause of cancer-related death. Hallmarks include desmoplasia with variable extracellular matrix (ECM) architecture and a complex microenvironment with spatially defined tumor, stromal, and immune populations. Nevertheless, the role of desmoplastic spatial organization in patient/tumor variability remains underexplored, which we elucidate using two technologies. First, we quantify ECM patterning in 437 patients, revealing architectures associated with disease-free and overall survival. Second, we spatially profile the cellular milieu of 78 specimens using codetection by indexing, identifying an axis of pro-inflammatory cell interactions predictive of poorer outcomes. We discover that clinical characteristics, including neoadjuvant chemotherapy status, tumor stage, and ECM architecture, correlate with differential stromal-immune organization, including fibroblast subtypes with distinct niches. Lastly, we define unified signatures that predict survival with areas under the receiver operating characteristic curve (AUCs) of 0.872-0.903, differentiating survivorship by 655 days. Overall, our findings establish matrix ultrastructural and cellular organizations of fibrosis linked to poorer outcomes.

Keywords: architecture; cancer; cell interactions; cell networks; codex; desmoplasia; fibrosis; machine learning; pancreatic ductal adenocarcinoma; spatial biology.


Conflict of interest statement

Declaration of interests The authors declare no competing interests.

Figures

None
Graphical abstract
Figure 1
Figure 1
Matrix ultrastructural analysis of PDAC desmoplasia (A) CONSORT diagram of imaging and ultrastructural analysis for patients with PDAC. (B) Ultrastructural quantification from histological images, including pseudotime modeling of ultrastructural states and integration with CODEX. (C) Manifold of PDAC desmoplastic architecture with higher pseudotime representing increasingly disrupted, heterogeneous desmoplastic architecture. Boxed images show representative tiles along the pseudotime trajectory. Scale bars represent 100 μm. (D) Visualization of healthy pancreas samples, which localize near the root point of the pseudotime trajectory. (E and F) Integration of overall survival (E) and disease-free survival (F) with clinical metadata. (G–I) Correlation of overall survival with patient-level pseudotime (G), stained quantity of fibrosis (H), and ultrastructural variance (I). Pearson coefficients and associated p values are shown. (J–L) Correlation of disease-free survival with patient-level pseudotime (J), stained quantity of fibrosis (K), and ultrastructural variance (L). Pearson coefficients and associated p values are shown.
Figure 2
Figure 2
Spatial phenotyping and cell spatial analysis of PDAC tumors (A) CODEX spatial phenotyping and identification of cell phenotypes (e.g., more and less activated tumor cells, fibroblast subpopulations, macrophages, B and T lymphocytes, endothelial cells) by protein expression. (B) Signatures of cell phenotypic representation for overall survival and disease-free survival. (C) Representative patient specimens with spatially indexed cell phenotypes. (D and E) Prognostic patient-level interactions for overall survival (D) and disease-free survival (E). Blue and red lines indicate outcome-positive and outcome-negative correlations, respectively. Width of line represents magnitude of the Pearson coefficient. (F) Differential interactions in patients who did and did not receive neoadjuvant chemotherapy before pancreaticoduodenectomy. Blue and red lines represent interactions that are enriched and weakened, respectively, in patients who received neoadjuvant chemotherapy. Width of line represents the average difference in interaction score. (G–I) Association of tumor grade (G), stage (H), and size (I) with cell interactions. Blue lines represent interactions that are associated with decreased (i.e., outcome-positive) clinical values, while red lines represent increased (i.e., outcome-negative) clinical values. Width of line represents magnitude of the Spearman coefficient for grade and stage and Pearson coefficient for size.
Figure 3
Figure 3
Correlation between cell-cell spatial interactions and patient outcomes (A) Pearson coefficients for overall survival (OS), ordered to highlight cell phenotypes driving OS-positive and OS-negative interactions. (B and C) Representative patient specimens highlighting survival-negative (B) and survival-positive (C) interactions. Spatial plots are shown for both the overall cell phenotypic distribution (left) and areas of highest interaction score indicated in red (right). Boxes indicate an area of interest for each cell interaction, with raw CODEX staining shown, in addition to a magnified view (far right) of the area of interest. (D) Pearson coefficients for disease-free survival (DFS).
Figure 4
Figure 4
Distance-based analysis of top outcome-differentiating CODEX cell interactions (A) Definition of short- and long-range correlations. (B) Illustration of characteristic short-range (orange) and long-range (green) behavior for outcome-positive and outcome-negative interactions. (C and D) Distance-based analysis of top survival-positive (C) and survival-negative (D) interactions. p values are indicated for linear regression models. (E and F) Distance-based analysis of top recurrence-positive (E) and recurrence-negative (F) interactions. p values are indicated for linear regression models.
Figure 5
Figure 5
Differential cell spatial organization associated with neoadjuvant chemotherapy and clinically relevant tumor metrics (A) Top 5 positively (top) and negatively (bottom) associated cell-cell interactions with neoadjuvant chemotherapy. p values are indicated for Student's t test. (B and C) Spearman coefficients for ordinal categories of tumor grade (B) and AJCC stage (C). (D) Pearson coefficients for continuous data on tumor size.
Figure 6
Figure 6
Interactomes of cancer-associated fibroblasts and B lymphocytes, as well as their variation with protein phenotype (A) Principal-component analysis (PCA) of fibroblast interaction space up to 5 PCs, as determined by vertex of scree plot. Fibroblasts appear to exhibit distinct interaction patterns that are defined by differences in inflammatory vs. mechanically activated protein expression. (B) Heatmaps of PCA coefficients and centroids for each fibroblast subtype. (C) PCA of B lymphocyte interaction space up to 4 principal components, as determined by vertex of scree plot. B lymphocytes appear to exhibit distinct interaction patterns based on maturity of protein phenotype. (D) Heatmaps of PCA coefficients and centroids for each B lymphocyte subtype.
Figure 7
Figure 7
Spatial signatures of PDAC patient prognosis using ML (A) ML model training using cell interactions, matrix ultrastructure, and clinical metadata. Areas under the receiver operating characteristic curve (AUCs) ranged from 0.884–0.953 for six representative models: an artificial neural network (ANN), a generalized additive model (GAM), a k-nearest neighbors (KNN) model, a linear discriminant analysis (LDA), a random forest (RF), and a support vector machine (SVM). (B) Blinded testing of prognostic ML models using an independent dataset of 40 patients with PDAC. AUCs ranged from 0.872–0.903, with the highest performance achieved by the ANN model. (C and D) Kaplan-Meier analysis of ML spatial signature for blinded testing dataset (C) and entire set of patients (D). For the blinded testing dataset, the spatial signature successfully differentiated patient survival by a difference of 655 days (hazard ratio [HR] = 4.29; p = 0.00183). For the overall patient dataset, the survival curve for patients with spatial signature A did not cross 50%. (E and F) Explanatory analysis of top-performing prognostic model using Shapley additive explanations (SHAP), including SHAP values (E) and average feature importance (F). Tumor grade and overall ECM architecture played the largest roles in explaining poor predicted survival, with additional support by individual ultrastructural parameters and cell interactions.

References

    1. Rahib L., Smith B.D., Aizenberg R., Rosenzweig A.B., Fleshman J.M., Matrisian L.M. Projecting cancer incidence and deaths to 2030: the unexpected burden of thyroid, liver, and pancreas cancers in the United States. Cancer Res. 2014;74:2913–2921. - PubMed
    1. da Costa W.L., Jr., Oluyomi A.O., Thrift A.P. Trends in the incidence of pancreatic adenocarcinoma in all 50 United States examined through an age-period-cohort analysis. JNCI Cancer Spectr. 2020;4:pkaa033. - PMC - PubMed
    1. Takikawa T., Kikuta K., Hamada S., Kume K., Miura S., Yoshida N., Tanaka Y., Matsumoto R., Ikeda M., Kataoka F., et al. Clinical features and prognostic impact of asymptomatic pancreatic cancer. Sci. Rep. 2022;12:4262–4311. - PMC - PubMed
    1. Cannon A., Thompson C., Hall B.R., Jain M., Kumar S., Batra S.K. Desmoplasia in pancreatic ductal adenocarcinoma: insight into pathological function and therapeutic potential. Genes Cancer. 2018;9:78–86. - PMC - PubMed
    1. Whatcott C.J., Diep C.H., Jiang P., Watanabe A., LoBello J., Sima C., Hostetter G., Shepard H.M., Von Hoff D.D., Han H. Desmoplasia in primary tumors and metastatic lesions of pancreatic cancer. Clin. Cancer Res. 2015;21:3561–3568. - PMC - PubMed

Publication types

MeSH terms