. 2023 Nov;29(11):2737-2741.
doi: 10.1038/s41591-023-02605-z. Epub 2023 Oct 21.

Liquid biopsy epigenomic profiling for cancer subtyping

Affiliations

Liquid biopsy epigenomic profiling for cancer subtyping

Sylvan C Baca et al. Nat Med. 2023 Nov.

Erratum in

  • Author Correction: Liquid biopsy epigenomic profiling for cancer subtyping.
    Baca SC, Seo JH, Davidsohn MP, Fortunato B, Semaan K, Sotudian S, Lakshminarayanan G, Diossy M, Qiu X, El Zarif T, Savignano H, Canniff J, Madueke I, Saliby RM, Zhang Z, Li R, Jiang Y, Taing L, Awad M, Chau CH, DeCaprio JA, Figg WD, Greten TF, Hata AN, Hodi FS, Hughes ME, Ligon KL, Lin N, Ng K, Oser MG, Meador C, Parsons HA, Pomerantz MM, Rajan A, Ritz J, Thakuria M, Tolaney SM, Wen PY, Long H, Berchuck JE, Szallasi Z, Choueiri TK, Freedman ML. Baca SC, et al. Nat Med. 2024 Mar;30(3):907. doi: 10.1038/s41591-023-02735-4. Nat Med. 2024. PMID: 38049623 Free PMC article. No abstract available.

Abstract

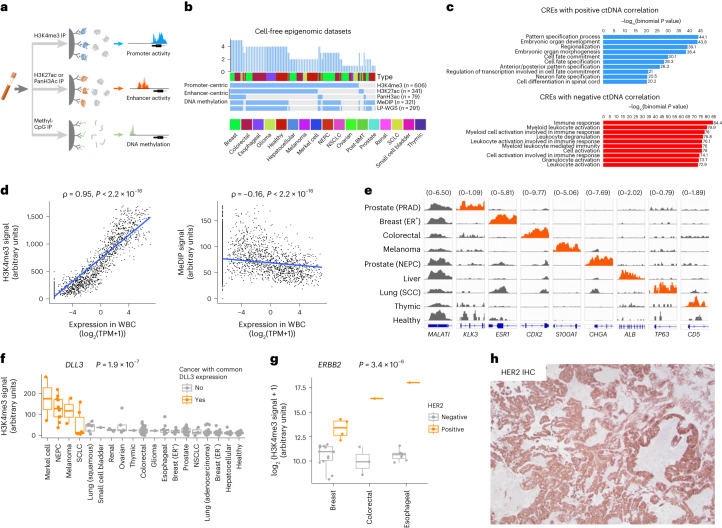
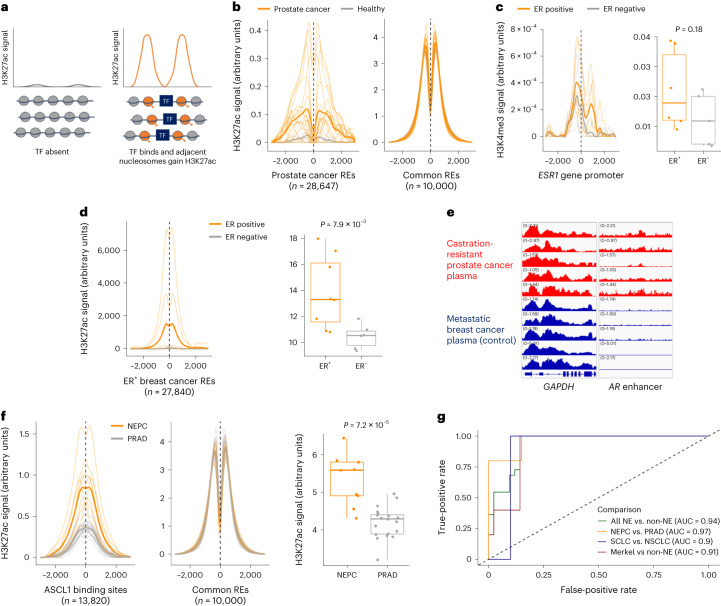
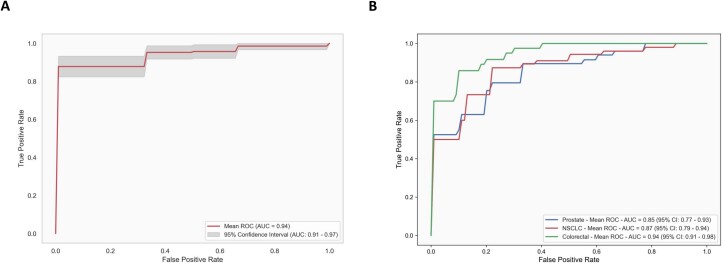
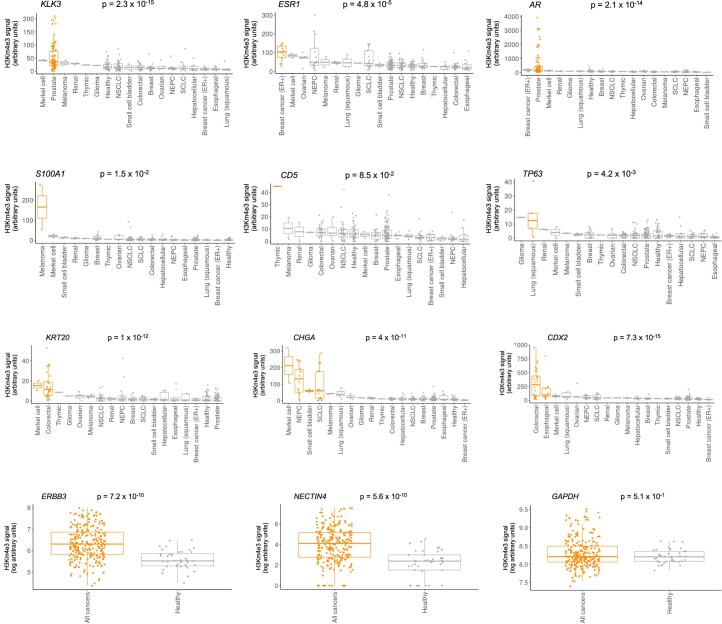
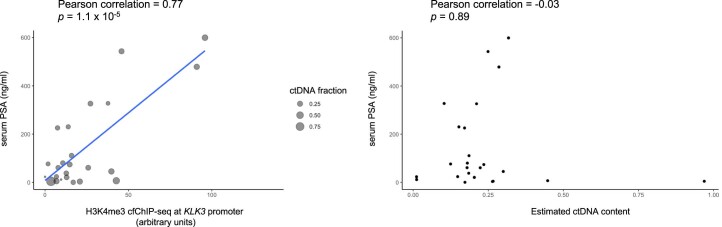
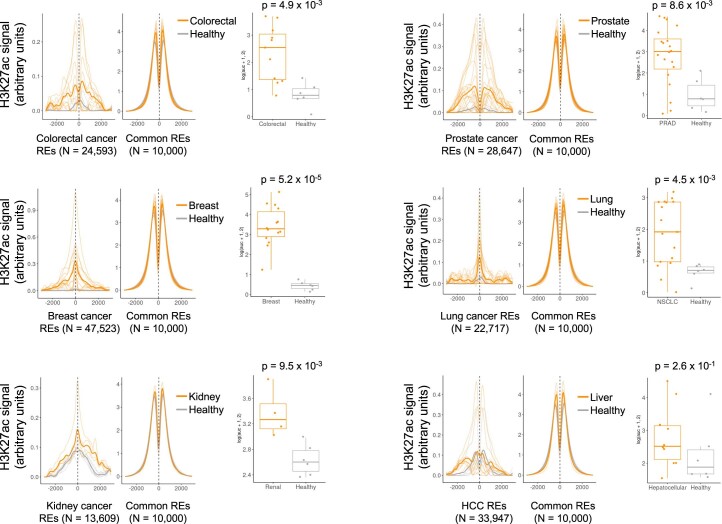
Although circulating tumor DNA (ctDNA) assays are increasingly used to inform clinical decisions in cancer care, they have limited ability to identify the transcriptional programs that govern cancer phenotypes and their dynamic changes during the course of disease. To address these limitations, we developed a method for comprehensive epigenomic profiling of cancer from 1 ml of patient plasma. Using an immunoprecipitation-based approach targeting histone modifications and DNA methylation, we measured 1,268 epigenomic profiles in plasma from 433 individuals with one of 15 cancers. Our assay provided a robust proxy for transcriptional activity, allowing us to infer the expression levels of diagnostic markers and drug targets, measure the activity of therapeutically targetable transcription factors and detect epigenetic mechanisms of resistance. This proof-of-concept study in advanced cancers shows how plasma epigenomic profiling has the potential to unlock clinically actionable information that is currently accessible only via direct tissue sampling.


Conflict of interest statement

S.C.B., T.K.C. and M.L.F. are co-founders and shareholders of Precede Biosciences. J.D. is a consultant for Kymera Therapeutics and has a sponsored research agreement with Kymera Therapeutics. M.T. served on an advisory board for Incyte. A.N.H. reports research support from Amgen, Blueprint Medicines, BridgeBio, Bristol-Myers Squibb, C4 Therapeutics, Eli Lilly, Novartis, Nuvalent, Pfizer, Roche/Genentech and Scorpion Therapeutics and paid consulting for Engine Biosciences, Nuvalent, Oncovalent, TigaTx and Tolremo Therapeutics. J.R. receives research funding from Equillium, Kite/Gilead, Novartis and Oncternal and consults or is on advisory boards for AvroBio, Akron Biotech, Clade Therapeutics, Garuda Therapeutics, LifeVault Bio, Novartis, Smart Immune and TScan Therapeutics. The remaining authors report no competing interests.

Figures

Fig. 1
Fig. 1. Epigenomic profiling of plasma identifies clinically actionable cancer phenotypes.
a, Overview of the method. The indicated epigenetic marks are isolated from plasma via immunoprecipitation (IP). DNA fragments from genomic regions bearing these marks are enriched and quantified via high-throughput sequencing, providing a genome-wide assessment of promoter activity, enhancer activity and DNA methylation. b, Epigenomic datasets generated from plasma. post-BMT, post-bone marrow transplant. c, GO term enrichment for genes near REs that correlate with ctDNA content (CREs). The top 1,000 peaks by significance of correlation with ctDNA were combined for each data type (H3K4me3, H3K27ac, panH3ac and MeDIP) and jointly analyzed. d, Plasma signal from H3K4me3 (left) and DNA methylation (right) at gene promoters (y axis) in healthy donor plasma versus gene expression levels in white blood cells (WBCs; x axis). Each dot represents ~10 aggregated genes with similar WBC expression levels. e, Normalized H3K4me3 cfChIP-seq signal of diagnostic marker genes. Each row represents plasma from a patient with the indicated cancer or a healthy volunteer. Signal at each gene is scaled uniformly across plasma samples to allow for comparison. Promoter signal is shown in orange where gene expression is expected in the corresponding cancer type. f, Normalized H3K4me3 cfChIP-seq signal at the DLL3 promoter stratified by cancer type for n = 202 biologically independent samples. Orange indicates cancer types in which the indicated gene is commonly expressed. P value corresponds to Wilcoxon test between cancer types with and without common expression of DLL3. g, Normalized H3K4me3 cfChIP-seq signal at the ERBB2 promoter for n = 30 biologically independent samples. Samples are stratified by HER2 expression per IHC staining of tumor tissue. P value corresponds to Wilcoxon test between HER2+ and HER2 cancers. h, IHC staining of HER2 from a brain metastasis from a patient with CRC (AMP-PL-0020-002). Scale bar, 100 μm. For f and g, only plasma samples with estimated ctDNA content >0.05 are included. For box plots, lower, middle and upper hinges indicate 25th, 50th and 75th percentiles; whiskers extend to 1.5× the interquartile ranges. All P values indicate two-sided tests.
Fig. 2
Fig. 2. Plasma enhancer profiling enables detection of NE-diff across multiple cancers.
a, Schematic demonstrating the measurement of enhancer activity at REs or TFBSs based on H3K27ac cfChIP-seq signal. b, Aggregate H3K27ac cfChIP-seq signal at REs identified by ATAC-seq in prostate tumor tissue. Signal in prostate cancer plasma and healthy plasma are colored orange and gray, respectively. Dark lines show the mean signal across all samples in the indicated class. For comparison, signal at ‘common’ REs is shown, which include 10,000 REs with DNAse hypersensitivity across most or all cell types (Methods). See also Extended Data Fig. 6. c, Normalized H3K4me3 cfChIP-seq signal in breast cancer patient plasma at the ESR1 gene promoter (n = 19 biologically independent samples). Dark lines indicate the mean signal across all samples in a class (ER+ or ER). Box plots show AUC for cfChIP profiles. Wilcoxon test P values are indicated for comparison of ER+ versus ER breast cancer. d, H3K27ac cfChIP-seq signal in breast cancer patient plasma (n = 17 biologically independent samples) at REs with preferentially accessible chromatin in ER+ breast cancer. Signal is aggregated across 27,840 REs for each sample. Dark lines indicate the mean signal across all samples in a class (ER+ or ER). Box plots show AUC for the aggregate H3K27ac cfChIP profile for each sample. Wilcoxon test P values are indicated for comparison of ER+ versus ER breast cancer. e, H3K27ac cfChIP-seq signal at the AR gene enhancer in patients with castration-resistant prostate cancer. Plasma from patients with metastatic breast cancer is included as a control. f, Aggregated H3K27ac cfChIP-seq signal at ASCL1 binding sites for prostate cancer with and without NE-diff (NEPC and PRAD, respectively; n = 33 biologically independent samples). Box plots indicate AUC for the aggregate H3K27ac profile for each sample. Wilcoxon test P values are indicated for comparison of NEPC versus PRAD. g, ROC curves for distinguishing samples with NE-diff using H3K27ac cfChIP-seq signal at neuroendocrine REs. ‘AUC’ indicates area under the ROC curve for each comparison. For ac, only plasma samples with estimated ctDNA content >0.03 are included. For all box plots, lower, middle and upper hinges indicate 25th, 50th, and 75th percentiles; whiskers extend to 1.5× the interquartile ranges. All P values indicate two-sided tests. NE, neuroendocrine; PRAD, prostate adenocarcinoma.
Extended Data Fig. 1
Extended Data Fig. 1. Genomic features overlapping cfChIP-seq and cfMeDIP-seq peaks.
(a) Overlaps for the top 1,000 ctDNA-correlated regulatory elements (CREs) by significance are plotted for each assay type. (b) Overlap of the top 1,000 cfMeDIP-seq CREs with CpG islands, shores, and shelves. Random regions matched for chromosome and size are shown for comparison.
Extended Data Fig. 2
Extended Data Fig. 2. Examples of positive and negative ctDNA-correlated regulatory elements (CREs).
Normalized read counts from epigenomic features correlate with ctDNA fraction at CREs. Spearman correlation coefficients and two-sided p-values are indicated.
Extended Data Fig. 3
Extended Data Fig. 3. Classification of cancer plasma based on H3K4me3 cfChIP-seq profiles.
(a) Receiver operating characteristic (ROC) curves for logistic regression-based classification of cancer plasma vs. healthy plasma, using as features the promoter H3K4me3 signal at a set of tissue-specific genes defined in the Human Protein Atlas (HPA) database (Methods). The classifier considered genes that were annotated as ‘tissue enriched’ or ‘tissue enhanced’ as well as ‘Not detected in immune cells’ in the HPA database. AUC, area under the curve. (b) ROC curves for classification of three cancer types with the most examples in the cohort.
Extended Data Fig. 4
Extended Data Fig. 4. H3K4me3 cfChIP-seq signal at promoters of selected genes of interest.
Promoter H3K4me3 signal is shown at selected genes across N = 202 biologically independent plasma samples stratified by cancer type. Orange indicates cancer types in which the indicated gene is expected to be expressed. Wilcoxon two-sided p-values are indicated for comparison of samples in which expression is expected versus all other samples. For NECTIN4 and ERBB3, signal is compared between healthy volunteer plasma and cancer patient plasma because these genes are expressed across various cancer types. Signal at GAPDH is shown as a control. Lower, middle, and upper hinges indicate 25th, 50th, and 75th percentiles; whiskers extend to 1.5 x the inter-quartile ranges (IQR).
Extended Data Fig. 5
Extended Data Fig. 5. Correlation of serum PSA with H3K4me3 cfChIP-seq signal at KLK3.
Correlation of serum PSA with ctDNA content is shown as a comparison. Pearson two-sided p-values are indicated.
Extended Data Fig. 6
Extended Data Fig. 6. Aggregate H3K27ac cfChIP signal at regulatory elements identified by ATAC-seq in tumor tissue.
Signal in cancer plasma (orange) and healthy plasma (gray) is compared at regulatory elements in the corresponding cancer type defined by ATAC-seq in TCGA tumors. Dark lines show the mean signal across all samples in the indicated class. For comparison, signal at ‘common’ REs is shown, which include 10,000 regulatory elements with DNAse hypersensitivity across most or all cell types (Methods). Boxplots indicate area under the curve for the aggregate H3K27ac profile for each sample. Lower, middle, and upper hinges indicate 25th, 50th, and 75th percentiles; whiskers extend to 1.5 x the inter-quartile ranges (IQR). Wilcoxon test two-sided p-values are indicated for comparison of healthy vs cancer samples.
Extended Data Fig. 7
Extended Data Fig. 7. Transcription factor binding sites overlapping H3K27ac CREs.
Overlap of the top 1,000 H3K27ac ctDNA correlated regions (CREs) with TF binding sites (TFBS) in cistromedb. Giggle scores quantify the degree of overlap between CREs and TFBS as described,.
Extended Data Fig. 8
Extended Data Fig. 8. Aggregate H3K27ac cfChIP-seq signal at HIF2α binding sites in renal cell carcinoma (RCC) and at AR binding sites in prostate cancer.
Healthy volunteer samples are shown for comparison. Boxplots indicate area under the curve for the aggregate H3K27ac profile for each sample. Lower, middle, and upper hinges indicate 25th, 50th, and 75th percentiles; whiskers extend to 1.5 x the inter-quartile ranges (IQR). Wilcoxon test two-sided p-values are indicated for comparison of healthy vs cancer samples.
Extended Data Fig. 9
Extended Data Fig. 9. H3K27ac cfChIP-seq distinguishes prostate cancer subtype-specific FOXA1 binding sites.
(a) H3K4me3 cfChIP-seq signal at the FOXA1 promoter in prostate adenocarcinoma (PRAD) vs. neuroendocrine prostate cancer (NEPC) for N = 25 biologically independent samples. (b) Aggregate H3K27ac cfChIP signal at Boxplots indicate aggregate signal at the indicated sites for the indicated epigenetic features for N = 29 biologically independent samples. NEPC-FOXA1 and PRAD-FOXA1 indicate FOXA1 binding sites that are preferentially bound in neuroendocrine prostate cancer (NEPC) compared to prostate adenocarcinoma (PRAD), as described previously. Aggregate signal at differential FOXA1 binding sites for each sample is normalized to signal at shared FOXA1 binding sites that are common to NEPC and PRAD. Wilcoxon test two-sided p-values are indicated. Boxplots indicate area under the curve for the aggregate cfChIP-seq profile for each sample. Lower, middle, and upper hinges indicate 25th, 50th, and 75th percentiles; whiskers extend to 1.5 x the inter-quartile ranges (IQR).
Extended Data Fig. 10
Extended Data Fig. 10. Aggregate H3K27ac cfChIP signal at neuroendocrine-enriched regulatory elements.
Dark lines show the mean signal across all samples in the indicated class. ‘NE’ indicates samples with neuroendocrine differentiation (SCLC, NEPC, or Merkel cell carcinoma). Wilcoxon test two-sided p-value is indicated. Boxplots indicate area under the curve for the aggregate cfChIP-seq profile for each sample. Lower, middle, and upper hinges indicate 25th, 50th, and 75th percentiles; whiskers extend to 1.5 x the inter-quartile ranges (IQR).

Similar articles

Cited by

References

    1. Nuzzo PV, et al. Detection of renal cell carcinoma using plasma and urine cell-free DNA methylomes. Nat. Med. 2020;26:1041–1043. doi: 10.1038/s41591-020-0933-1. - DOI - PMC - PubMed
    1. Berchuck JE, et al. Detecting neuroendocrine prostate cancer through tissue-informed cell-free DNA methylation analysis. Clin. Cancer Res. 2022;28:928–938. doi: 10.1158/1078-0432.CCR-21-3762. - DOI - PMC - PubMed
    1. Snyder MW, Kircher M, Hill AJ, Daza RM, Shendure J. Cell-free DNA comprises an in vivo nucleosome footprint that informs its tissues-of-origin. Cell. 2016;164:57–68. doi: 10.1016/j.cell.2015.11.050. - DOI - PMC - PubMed
    1. Doebley A-L, et al. A framework for clinical cancer subtyping from nucleosome profiling of cell-free DNA. Nat. Commun. 2022;13:7475. doi: 10.1038/s41467-022-35076-w. - DOI - PMC - PubMed
    1. De Sarkar, N. et al. Nucleosome patterns in circulating tumor DNA reveal transcriptional regulation of advanced prostate cancer phenotypes. Cancer Discov. 13, 632–653 (2022). - PMC - PubMed