

Analytical reference framework to analyze non-COVID-19 events
- PMID: 37865751
- PMCID: PMC10590025
- DOI: 10.1186/s12963-023-00316-8
Analytical reference framework to analyze non-COVID-19 events
Abstract
Background: The COVID-19 pandemic has disrupted the healthcare system, leading to delays in detection of other non-COVID-19 diseases. This paper presents ANE Framework (Analytics for Non-COVID-19 Events), a reliable and user-friendly analytical forecasting framework designed to predict the number of patients with non-COVID-19 diseases. Prior to 2020, there were analytical models focused on specific illnesses and contexts. Then, most models have focused on understanding COVID-19 behavior. There is a lack of analytical frameworks that enable disease forecasting for non-COVID-19 diseases.
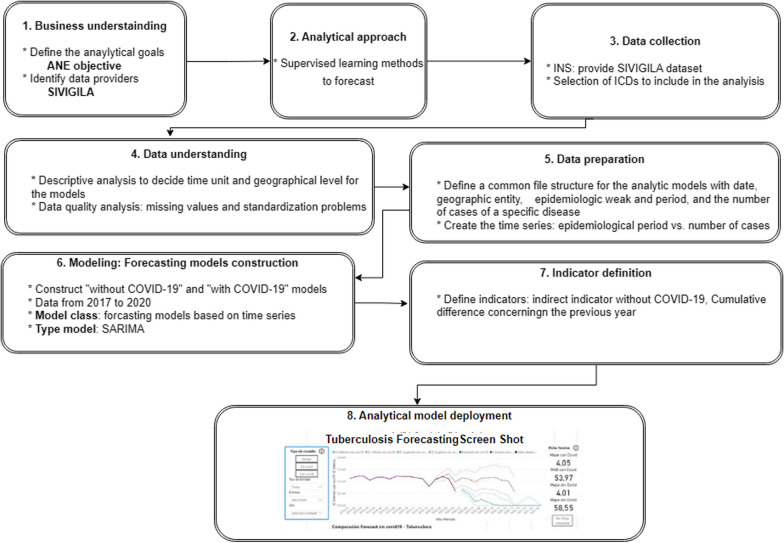
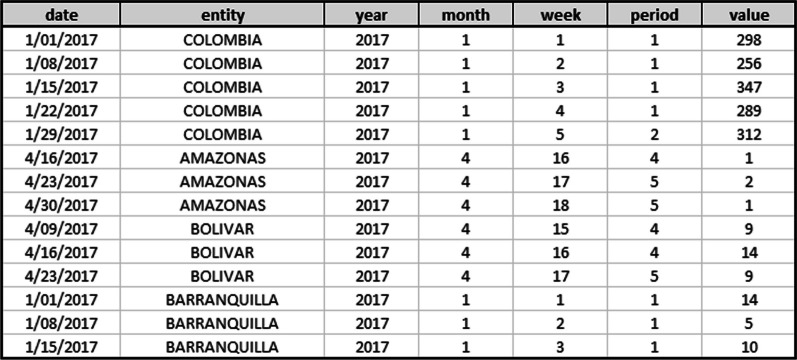
Methods: The ANE Framework utilizes time series analysis to generate forecasting models. The framework leverages daily data from official government sources and employs SARIMA models to forecast the number of non-COVID-19 cases, such as tuberculosis and suicide attempts.
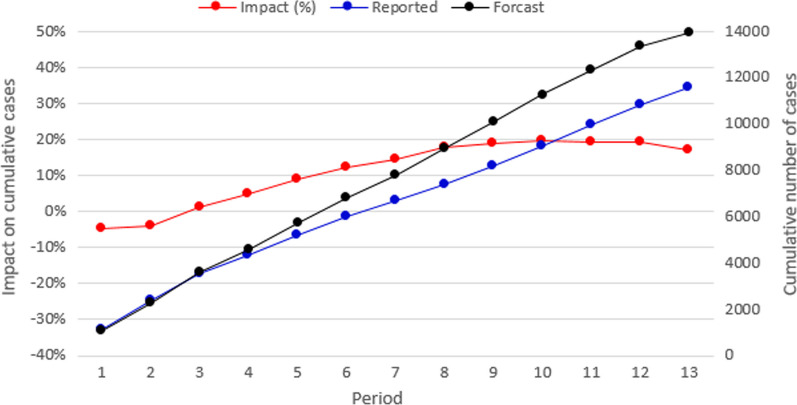
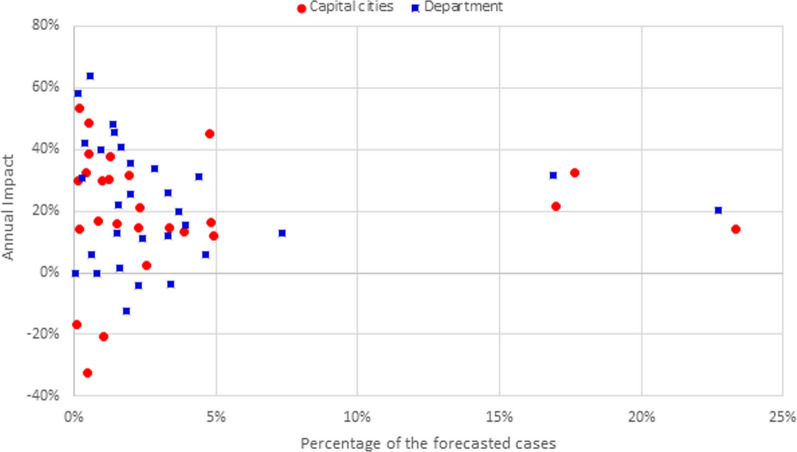
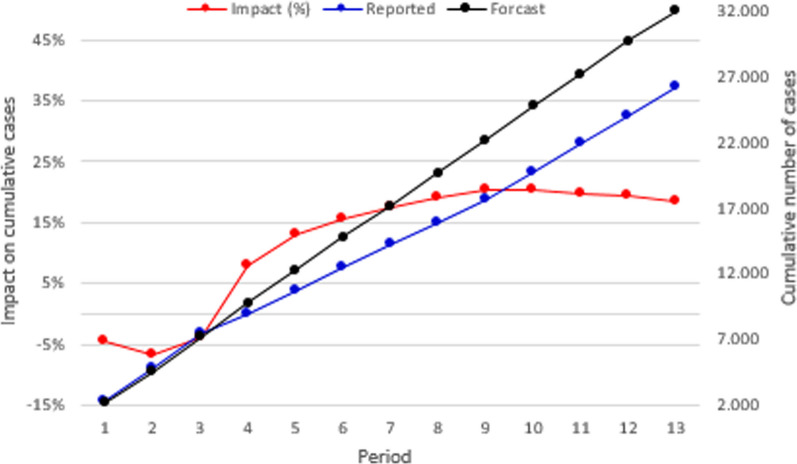
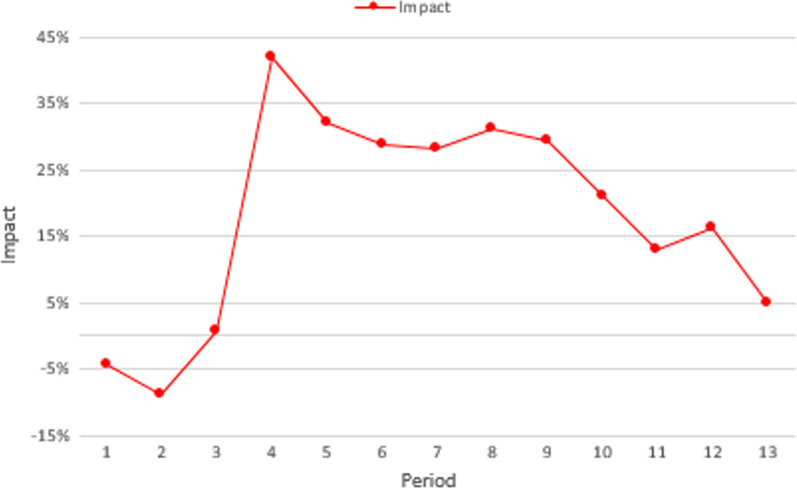
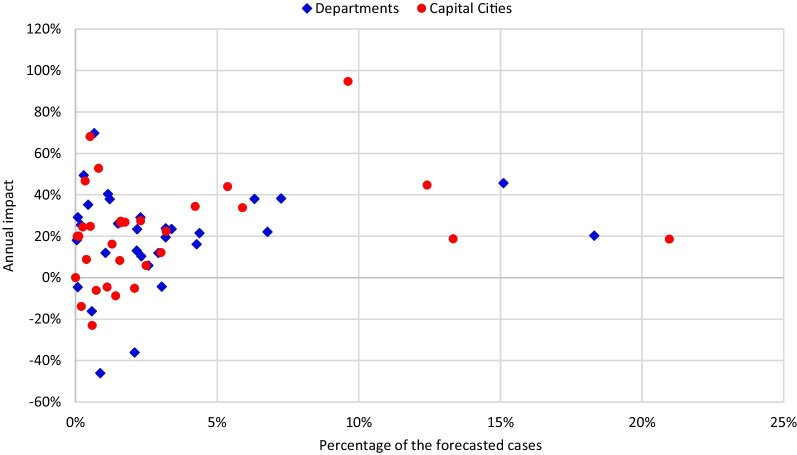
Results: The framework was tested on five different non-COVID-19 events. The framework performs well across all events, including tuberculosis and suicide attempts, with a Mean Absolute Percentage Error (MAPE) of up to 20% and the consistency remains independent of the behavior of each event. Moreover, a pairwise comparison of averages can lead to over or underestimation of the impact. The disruption caused by the pandemic resulted in a 17% gap (2383 cases) between expected and reported tuberculosis cases, and a 19% gap (2464 cases) for suicide attempts. These gaps varied between 20 and 64% across different cities and regions. The ANE Framework has proven to be reliable for analyzing several diseases and exhibits the flexibility to incorporate new data from various sources. Regular updates and the inclusion of new associated data enhance the framework's effectiveness.
Conclusions: Current pandemic shows the necessity of developing flexible models to be adapted to different illness data. The framework developed proved to be reliable for the different diseases analyzed, presenting enough flexibility to update with new data or even include new data from different databases. To keep updated on the result of the project allows the inclusion of new data associated with it. Similarly, the proposed strategy in the ANE framework allows for improving the quality of the obtained results with news events.
Keywords: Forecasting models; No COVID-19 events; SARIMA; Suicide attempt; Tuberculosis.
© 2023. BioMed Central Ltd., part of Springer Nature.
Conflict of interest statement
The authors declare that they have no competing interests.
Figures
References
-
- Abdullah S, Sapii N, Dir S, Jalal TM. Application of Univariate Forecasting Models of Tuberculosis Cases in Kelantan. In: 2012 international conference on statistics in science, business and engineering (ICSSBE), 2012; p. 1–7.
-
- Chaurasia V, Pal S. Application of machine learning time series analysis for prediction COVID-19 pandemic. Res Biomed Eng. 2020 doi: 10.1007/s42600-020-00105-4. - DOI
-
- Coutin Marie, G. Utilización de modelos ARIMA Para La Vigilancia de enfermedades transmisibles. Revista Cubana de Salud Pública 33(2); 2007.
-
- DANE. Boletín Técnico de Defunciones Covid-19. 1–33; 2020. https://www.dane.gov.co/files/investigaciones/poblacion/defunciones-covi... (June 17, 2022).
Publication types
MeSH terms
Grants and funding
- contract No. FP44842-anexo46-2015/Ministry of Information Technologies and Telecommunications of the Republic of Colombia (MinTIC) through the Colombian Administrative Department of Science, Technology, and Innovation (MINCIENCIAS)
- contract No. FP44842-anexo46-2015/Ministry of Information Technologies and Telecommunications of the Republic of Colombia (MinTIC) through the Colombian Administrative Department of Science, Technology, and Innovation (MINCIENCIAS)
LinkOut - more resources
Full Text Sources
Medical
Miscellaneous
