

Global diversity and biogeography of DNA viral communities in activated sludge systems
- PMID: 37865788
- PMCID: PMC10589946
- DOI: 10.1186/s40168-023-01672-1
Global diversity and biogeography of DNA viral communities in activated sludge systems
Abstract
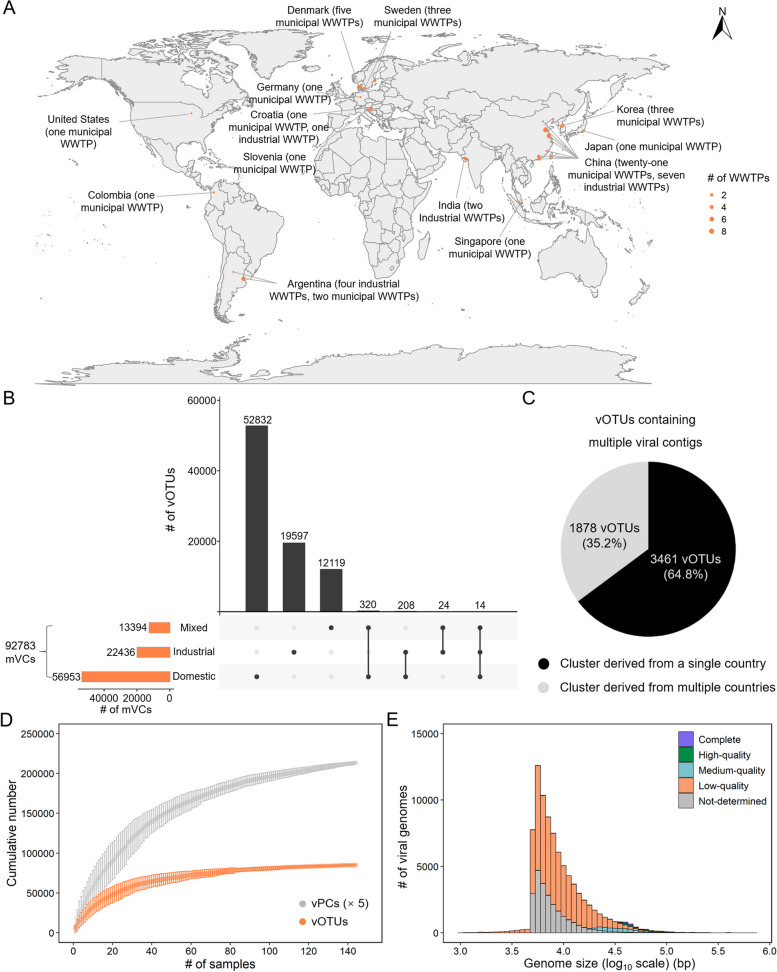
Background: Activated sludge (AS) systems in wastewater treatment plants (WWTPs) harbor enormous viruses that regulate microbial metabolism and nutrient cycling, significantly influencing the stability of AS systems. However, our knowledge about the diversity of viral taxonomic groups and functional traits in global AS systems is still limited. To address this gap, we investigated the global diversity and biogeography of DNA viral communities in AS systems using 85,114 viral operational taxonomic units (vOTUs) recovered from 144 AS samples collected across 54 WWTPs from 13 different countries.
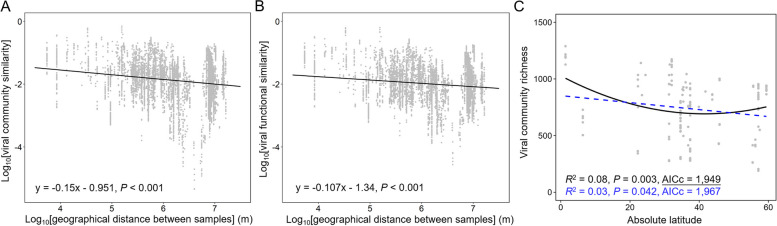
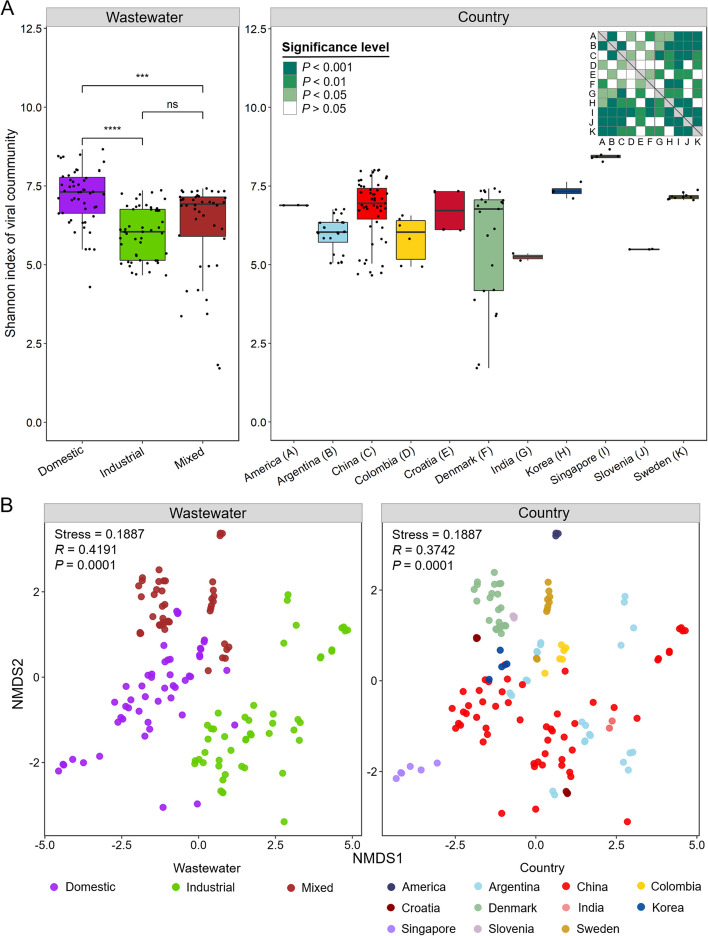
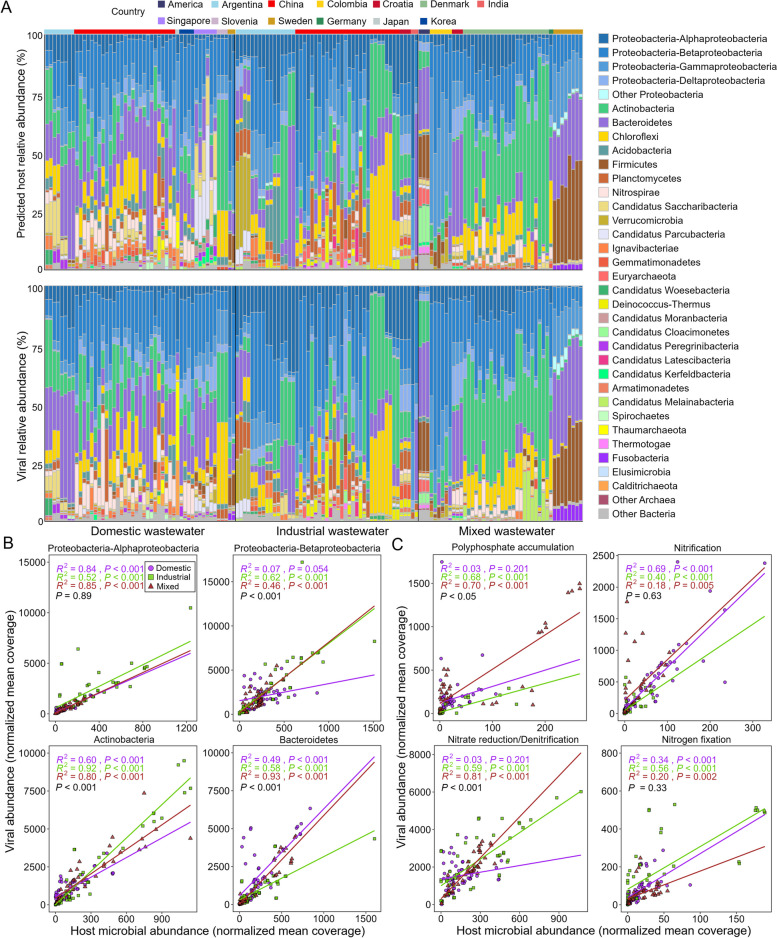
Results: AS viral communities and their functional traits exhibited distance-decay relationship (DDR) at the global scale and latitudinal diversity gradient (LDG) from equator to mid-latitude. Furthermore, it was observed that AS viral community and functional gene structures were largely driven by the geographic factors and wastewater types, of which the geographic factors were more important. Carrying and disseminating auxiliary metabolic genes (AMGs) associated with the degradation of polysaccharides, sulfate reduction, denitrification, and organic phosphoester hydrolysis, as well as the lysis of crucial functional microbes that govern biogeochemical cycles were two major ways by which viruses could regulate AS functions. It was worth noting that our study revealed a high abundance of antibiotic resistance genes (ARGs) in viral genomes, suggesting that viruses were key reservoirs of ARGs in AS systems.
Conclusions: Our results demonstrated the highly diverse taxonomic groups and functional traits of viruses in AS systems. Viral lysis of host microbes and virus-mediated HGT can regulate the biogeochemical and nutrient cycles, thus affecting the performance of AS systems. These findings provide important insights into the viral diversity, function, and ecology in AS systems on a global scale. Video Abstract.
Keywords: Activated sludge; Auxiliary metabolic genes; Biogeography; Viral community; Virus-microbe interaction.
© 2023. BioMed Central Ltd., part of Springer Nature.
Conflict of interest statement
The authors declare no competing interests.
Figures


Similar articles
-
Unravelling DNA viral communities involved in the anaerobic digestion of waste activated sludge enhanced by hydrochar.J Environ Manage. 2025 Sep;392:126761. doi: 10.1016/j.jenvman.2025.126761. Epub 2025 Jul 31. J Environ Manage. 2025. PMID: 40749557
-
Global diversity and biogeography of bacterial communities in wastewater treatment plants.Nat Microbiol. 2019 Jul;4(7):1183-1195. doi: 10.1038/s41564-019-0426-5. Epub 2019 May 13. Nat Microbiol. 2019. PMID: 31086312
-
Soil Viruses Are Underexplored Players in Ecosystem Carbon Processing.mSystems. 2018 Oct 2;3(5):e00076-18. doi: 10.1128/mSystems.00076-18. eCollection 2018 Sep-Oct. mSystems. 2018. PMID: 30320215 Free PMC article.
-
A mixed blessing of viruses in wastewater treatment plants.Water Res. 2022 May 15;215:118237. doi: 10.1016/j.watres.2022.118237. Epub 2022 Feb 26. Water Res. 2022. PMID: 35245718
-
Promising bioprocesses for the efficient removal of antibiotics and antibiotic-resistance genes from urban and hospital wastewaters: Potentialities of aerobic granular systems.Environ Pollut. 2024 Feb 1;342:123115. doi: 10.1016/j.envpol.2023.123115. Epub 2023 Dec 10. Environ Pollut. 2024. PMID: 38086508 Review.
Cited by
-
Temporal turnover of viral biodiversity and functional potential in intertidal wetlands.NPJ Biofilms Microbiomes. 2024 Jun 19;10(1):48. doi: 10.1038/s41522-024-00522-8. NPJ Biofilms Microbiomes. 2024. PMID: 38898104 Free PMC article.
-
The multi-kingdom microbiome catalog of the chicken gastrointestinal tract.Biosaf Health. 2024 Mar 2;6(2):101-115. doi: 10.1016/j.bsheal.2024.02.006. eCollection 2024 Apr. Biosaf Health. 2024. PMID: 40078943 Free PMC article.
-
Characterization, diversity, and biogeochemical potential of soil viruses inhabiting in Yuncheng Salt Lake.Front Microbiol. 2025 May 7;16:1597514. doi: 10.3389/fmicb.2025.1597514. eCollection 2025. Front Microbiol. 2025. PMID: 40400689 Free PMC article.
-
Distributions, interactions, and dynamics of prokaryotes and phages in a hybrid biological wastewater treatment system.Microbiome. 2024 Jul 22;12(1):134. doi: 10.1186/s40168-024-01853-6. Microbiome. 2024. PMID: 39039555 Free PMC article.
-
Harnessing Engineered Microbial Consortia for Xenobiotic Bioremediation: Integrating Multi-Omics and AI for Next-Generation Wastewater Treatment.J Xenobiot. 2025 Aug 19;15(4):133. doi: 10.3390/jox15040133. J Xenobiot. 2025. PMID: 40863340 Free PMC article. Review.
References
Publication types
MeSH terms
Substances
LinkOut - more resources
Full Text Sources
Research Materials
Miscellaneous
