. 2023 Dec;10(35):e2305527.
doi: 10.1002/advs.202305527. Epub 2023 Oct 22.

Transcription Factor Id1 Plays an Essential Role in Th9 Cell Differentiation by Inhibiting Tcf3 and Tcf4

Affiliations

Transcription Factor Id1 Plays an Essential Role in Th9 Cell Differentiation by Inhibiting Tcf3 and Tcf4

Woo Ho Lee et al. Adv Sci (Weinh). 2023 Dec.

Abstract

T helper type 9 (Th9) cells play important roles in immune responses by producing interleukin-9 (IL-9). Several transcription factors are responsible for Th9 cell differentiation; however, transcriptional regulation of Th9 cells is not fully understood. Here, it is shown that Id1 is an essential transcriptional regulator of Th9 cell differentiation. Id1 is induced by IL-4 and TGF-β. Id1-deficient naïve CD4 T cells fail to differentiate into Th9 cells, and overexpression of Id1 induce expression of IL-9. Mass spectrometry analysis reveals that Id1 interacts with Tcf3 and Tcf4 in Th9 cells. In addition, RNA-sequencing, chromatin immunoprecipitation, and transient reporter assay reveal that Tcf3 and Tcf4 bind to the promoter region of the Il9 gene to suppress its expression, and that Id1 inhibits their function, leading to Th9 differentiation. Finally, Id1-deficient Th9 cells ameliorate airway inflammation in an animal model of asthma. Thus, Id1 is a transcription factor that plays an essential role in Th9 cell differentiation by inhibiting Tcf3 and Tcf4.

Keywords: Id1; Tcf3; Tcf4; Th9 cell; differentiation; transcriptional regulation.


Conflict of interest statement

The authors declare no conflict of interest.

Figures
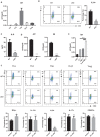
Figure 1
Figure 1
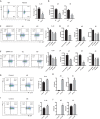
Id1 deficiency inhibits differentiation of Th9 cells. A) Naïve CD4 T cells were isolated from the spleen of WT mice and cultured for 3 days under subset‐polarizing conditions. Expression of Id1 mRNA was measured by RT‐qPCR. B) WT and Id1‐deficient naïve CD4 T cells were isolated from the spleen and cultured for 3 days under Th9‐polarizing conditions. IL‐9 was measured by flow cytometry. C) The amount of IL‐9 protein was measured by ELISA. D) Id1 and Il9 mRNA levels were measured by RT‐qPCR. E) Naïve CD4 T cells were isolated from the spleen and stimulated for 24 h with anti‐CD3 and anti‐CD28 antibodies in the presence of the indicated cytokines. Id1 mRNA levels were measured by RT‐qPCR. F) Naïve CD4 T cells were isolated from the spleen of WT or Id1 cKO mice and cultured for 3 days under subset‐polarizing conditions. Subset‐specific markers were measured by flow cytometry. B,F) Flow cytometry and A,D,E) RT‐qPCR data are representative of three independent experiments. C) ELISA data were pooled from three independent experiments. The data in the bar graph next to the flow cytometry data were pooled from three independent experiments. The error bars represent the standard deviation. B,C,D,F) p‐values were determined by Student's t test. E) p‐values were analyzed by one‐way ANOVA/Tukey's test. ns: not significant, * p < 0.05, *** p < 0.001, **** p < 0.0001.
Figure 2
Figure 2
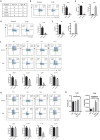
Th9 cell differentiation is dependent on the level of Id1 expression. A,B) Naïve CD4 T cells were isolated from the spleen of Id1fl/fl or Id1fl/+‐CD4Cre mice and cultured for 3 days under Th9‐polarizing conditions. A) IL‐9 was measured by flow cytometry. B) Id1 and Il9 mRNA levels were measured by RT‐qPCR. C) Naïve CD4 T cells were isolated from the spleen of WT mice and cultured for 1 day under Th0 conditions prior to transduction with control, Id1, or Id3 shRNA vectors. Cells were cultured under Th9‐polarizing conditions for 2 days. D) Expression of each gene was measured by RT‐qPCR. E) Naïve CD4 T cells were isolated from Cas9 mice and cultured for 1 day under Th0 conditions prior to transduction with control, Id1, or Id3 sgRNA vectors. Cells were then cultured under Th9‐polarizing conditions for 2 days. F) Expression of each gene was measured by RT‐qPCR. G–J) Cells were cultured as described in C and transduced with control, Id1, or Id3 expressing vectors. Expression of Id1 and Il9 was measured by RT‐qPCR. A,C,E,G,I) Flow cytometry and B,D,F,H,J) RT‐qPCR data are representative of three independent experiments. The data in the bar graph next to the flow cytometry data were pooled from three independent experiments. The error bars represent the standard deviation. A–D,G–J) p‐values were determined by Student's t test. C–F) p‐values were analyzed by one‐way ANOVA/Tukey's test. ns: not significant, * p < 0.05, ** p < 0.01, ***p < 0.001, **** p < 0.0001.
Figure 3
Figure 3
Tcf3 and Tcf4 act as negative regulators of Th9 cell differentiation. A) Id1 binding partners in Th9 cells were analyzed by mass spectrometry. The numbers indicate the number of peptides detected in the assay. B–E) Naïve CD4 T cells were transduced with Tcf3‐ or Tcf4‐expressing vectors and cultured under Th9‐polarizing conditions. Next, mRNA levels were measured by RT‐qPCR. F,G) Naïve CD4 T cells were transduced with Tcf3‐ or Tcf4‐expressing vectors and cultured under subset‐polarizing conditions. H) Naïve CD4 T cells were stimulated for 24 h with anti‐CD3 and anti‐CD28 antibodies in the presence of the indicated cytokines. mRNA levels were measured by RT‐qPCR. Flow cytometry and RT‐qPCR data are representative of three independent experiments. B,D,F,G) Flow cytometry and C,E,H) RT‐qPCR data are representative of three independent experiments. The data in the bar graph next to the flow cytometry data were pooled from three independent experiments. The error bars represent the standard deviation. p‐values were determined using Student's t‐test. ns: not significant, * p < 0.05, ** p < 0.01, *** p < 0.001, **** p < 0.0001.
Figure 4
Figure 4
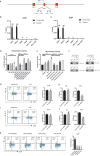
Both Tcf3 and Tcf4 are important for blockade of Th9 cell differentiation. A) Schematic diagram of the Il9 locus. B,C) Binding of FLAG‐Tcf3 or FLAG‐Tcf4 to various regions of the Il9 gene was measured in a chromatin immunoprecipitation (ChIP) assay of Flag‐Tcf3‐ or Flag‐Tcf3‐overexpressing Th9 cells. The following regions were examined: CNS1(−375 to −270), CNS1a (−38 to −125), CNS0 (−6287 to −6093), CNS2 (+4888 to +4983), Ebox site1 (+14 to +129), and Ebox site 2 (+37 to +136). nd: not detected. (D‐E) Il9 promoter activity was measured in EL4 cells transduced with various factors and then stimulated with PMA and ionomycin for 4 h. F) HEK293T cells were transfected with pCMV‐Flag‐Tcf3 or pCMV‐Flag‐Tcf4. Cell lysates were immunoprecipitated with an anti‐Id1 or an anti‐FLAG antibody, and protein signals were measured by immunoblotting with an anti‐Id1 or an anti‐FLAG antibody. ChIP and Co‐IP data are representative of three independent experiments. G–J) Naïve CD4 T cells were transduced with the shRNA‐Tcf3 or shRNA‐Tcf4 vector and cultured under Th9‐polarizing conditions. mRNA levels were measured by RT‐qPCR. K) Naïve CD4 T cells were isolated from WT or Id1 cKO mice and transduced with control, Tcf3‐shRNA, or Tcf4‐ shRNA vectors prior to culture under Th9‐polarizing conditions. G,I) Flow cytometry and B,C,H,J) RT‐qPCR, F) Immunoblot data are representative of three independent experiments. D,E) Transient reporter assay data were pooled from three independent experiments. The data in the bar graph next to the flow cytometry data were pooled from three independent experiments. The error bars represent the standard deviation. B,C,G–J) p‐values were determined by Student's t‐test. D,E,K) p‐values were analyzed by one‐way ANOVA/Tukey's test. ns: not significant, *** p < 0.001, **** p < 0.0001.
Figure 5
Figure 5
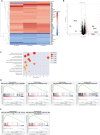
Global gene expression analyses. A) RNA‐seq was performed using RNA isolated from WT or Id1 cKO Th9 cells. Clustering heat map derived from RNA‐seq data. B) Volcano plot of RNA‐seq data. C) DAVID graphic results for the RNA‐seq data. Gene categories enriched in KO were shown. D,E) Gene set enrichment analysis (GSEA).
Figure 6
Figure 6
Id1 cKO mice show ameliorated airway inflammation. A) Total cells were isolated from lung BAL fluids and counted using a hemocytometer; n = 3–4. B) Isolated BAL cells were stained with Diff Quik to identify different cell types and then counted. C) mRNA was isolated from lung tissue, and expression levels were measured by RT‐qPCR. D) Lung tissue was fixed in 4% formaldehyde and stained with H&E or PAS before histological analysis. Original magnification, × 100 and × 200. E) dLN cells were isolated and stimulated in the presence of OVA for 24 h. CD4 T cells were sorted and then Id1 and Il9 mRNA expression was measured by RT‐qPCR. Error bars represent the standard deviation. p‐values were analyzed by A–C) one‐way ANOVA/Tukey's test or E) by Student's t‐test. * p < 0.05, ** p < 0.01, *** p < 0.001, **** p < 0.0001.
Figure 7
Figure 7
Id1‐deficient Th9 cells ameliorate airway inflammation in a cell‐intrinsic manner. A) Schematic diagram showing the adoptive transfer model of airway inflammation. B) Total BAL cells were isolated from the lung and counted using a hemocytometer; n = 3. C) Isolated BAL cells were stained with Diff Quik to identify different cell types and then counted. D) mRNA was isolated from lung tissue, and expression levels were measured by RT‐qPCR. E) Lung tissue was fixed in 4% formaldehyde and stained with H&E or PAS before histological analysis. Original magnification, × 400. Error bars represent the standard deviation. p‐values were determined by Student's t‐test. ** p < 0.01, *** p < 0.001.

References

    1. Lee G. R., Immune Netw 2023, 23, e4. - PMC - PubMed
    1. a) Licona‐Limón P., Henao‐Mejia J., Temann A. U., Gagliani N., Licona‐Limón I., Ishigame H., Hao L., Herbert D. R., Flavell R. A., Immunity 2013, 39, 744 ; - PMC - PubMed
    2. b) Kaplan M. H., Hufford M. M., Olson M. R., Nat. Rev. Immunol. 2015, 15, 295 ; - PMC - PubMed
    3. c) Schmitt E., Bopp T., Semin Immunopathol 2017, 39, 5. - PubMed
    1. a) Staudt V., Bothur E., Klein M., Lingnau K., Reuter S., Grebe N., Gerlitzki B., Hoffmann M., Ulges A., Taube C., Dehzad N., Becker M., Stassen M., Steinborn A., Lohoff M., Schild H., Schmitt E., Bopp T., Immunity 2010, 33, 192 ; - PubMed
    2. b) Jones C. P., Gregory L. G., Causton B., Campbell G. A., Lloyd C. M., J. Allergy Clin. Immunol. 2012, 129, 1000. - PMC - PubMed
    1. a) Lu Y., Hong S., Li H., Park J., Hong B., Wang L., Zheng Y., Liu Z., Xu J., He J., Yang J., Qian J., Yi Q., J. Clin. Invest. 2012, 122, 4160; - PMC - PubMed
    2. b) Purwar R., Schlapbach C., Xiao S., Kang H. S., Elyaman W., Jiang X., Jetten A. M., Khoury S. J., Fuhlbrigge R. C., Kuchroo V. K., Clark R. A., Kupper T. S., Nat. Med. 2012, 18, 1248. - PMC - PubMed
    1. Kaplan M. H., Immunol. Rev. 2013, 252, 104. - PMC - PubMed

Publication types

MeSH terms

LinkOut - more resources