. 2023 Sep 25;5(1):obad036.
doi: 10.1093/iob/obad036. eCollection 2023.

Understanding Organisms Using Ecological Observatory Networks

Affiliations

Understanding Organisms Using Ecological Observatory Networks

B Dantzer et al. Integr Org Biol. .

Abstract

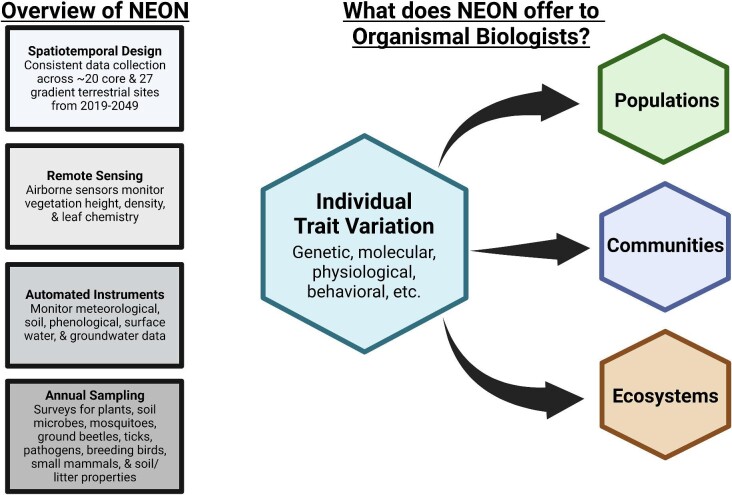
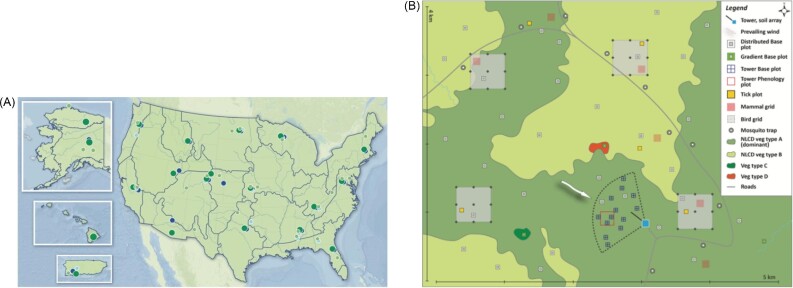
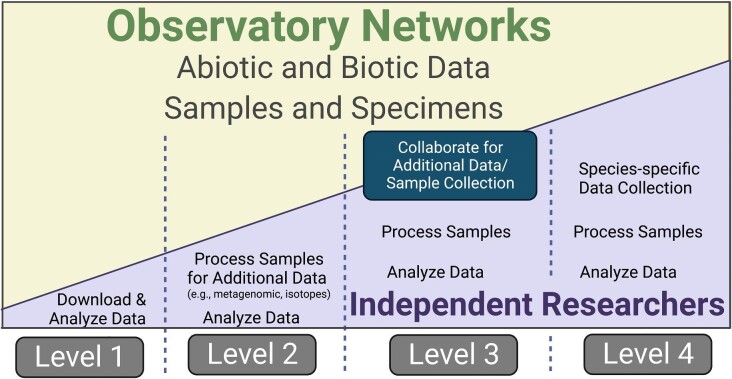
Human activities are rapidly changing ecosystems around the world. These changes have widespread implications for the preservation of biodiversity, agricultural productivity, prevalence of zoonotic diseases, and sociopolitical conflict. To understand and improve the predictive capacity for these and other biological phenomena, some scientists are now relying on observatory networks, which are often composed of systems of sensors, teams of field researchers, and databases of abiotic and biotic measurements across multiple temporal and spatial scales. One well-known example is NEON, the US-based National Ecological Observatory Network. Although NEON and similar networks have informed studies of population, community, and ecosystem ecology for years, they have been minimally used by organismal biologists. NEON provides organismal biologists, in particular those interested in NEON's focal taxa, with an unprecedented opportunity to study phenomena such as range expansions, disease epidemics, invasive species colonization, macrophysiology, and other biological processes that fundamentally involve organismal variation. Here, we use NEON as an exemplar of the promise of observatory networks for understanding the causes and consequences of morphological, behavioral, molecular, and physiological variation among individual organisms.


Conflict of interest statement

All authors declare that they have no conflict of interest, although one coauthor (Dr. S.H. Paull) is employed by Battelle Ecology, which manages NEON.

Figures

Fig. 1.
Fig. 1.
Observatory networks such as NEON provide organismal biologists with an opportunity to quantify the drivers of variation in many different organismal traits (genetic, molecular, physiological, behavioral, morphological, life history, etc.) and also how this variation may or may not scale up to influence populations, communities, or ecosystems. In the case of NEON (and many of the other observatory networks), this is possible through spatiotemporal replication, remote sensing data or those collected through automated instruments at the specific field sites, and annual sampling by observers. These data combined with archived samples collected during the annual sampling (such as at the NEON Biorepository) provide organismal biologists with many opportunities to address outstanding questions in the field centered around the causes and consequences of individual trait variation.
Box 1, Fig. 1.
Box 1, Fig. 1.
Spatial scales of NEON sampling. (A) The distribution of NEON sites across ecoregion boundaries in the United States (insets show Alaska, Hawaii, and Puerto Rico). Terrestrial sites are in green, while aquatic sites are in blue; larger, darker circles show NEON Core Sites (which are natural and undisturbed), while smaller, lighter circles show NEON Gradient Sites (which are impacted by human activities). Each site consists of an array of embedded plots at which sampling or automated data collection occur. See interactive map here: https://www.neonscience.org/field-sites/explore-field-sites. (B) An expanded view of a typical NEON Core terrestrial site containing multiple types of data collection.
Fig. 2.
Fig. 2.
The relative contributions of resources by NEON or other observatory networks (yellow shaded area) and independent researchers (purple shaded area) to specific types of projects vary. At Level 1, researchers largely use existing data collected by NEON to address outstanding questions in their field. At Level 2, researchers may use samples housed at the NEON Biorepository to address their specific research questions. At Levels 3 and 4, researchers may need to either collaborate with NEON or work independently at or near NEON sites to collect additional data. For instance, independent researchers could collect additional data at NEON sites (Level 3) or focus on a species of interest by setting up their own study site adjacent to NEON sites (Level 4). Although these collaborations hold much potential, it will require NEON to work with independent researchers to collect additional data to address their specific research questions (e.g., through the Assignable Assets Program offered by NEON).

References

    1. Alonso-Blanco C, Aarts MG, Bentsink L, Keurenties JJ, Reymond M, Vreugdenhil D, Koorneef M. 2009. What has natural variation taught us about plant development, physiology, and adaptation? Plant Cell 21:1877–96. - PMC - PubMed
    1. Barnett DT, Duffy PA, Schimel DS, Krauss RE, Irvine KM, Davis FW, Gross JE, Azuaje EL, Thorpe AS, Gudex-Cross Det al. 2019. The terrestrial organism and biogeochemistry spatial sampling design for the National Ecological Observatory Network. Ecosphere 10:pe02540.
    1. Bartholomew GA. 1964. The roles of physiology and behaviour in the maintenance of homeostasis in the desert environment. Symp Soc Exp Biol 18:7–29. - PubMed
    1. Botero CA, Weissing FJ, Wright J, Rubenstein DR. 2015. Evolutionary tipping points in the capacity to adapt to environmental change. Proc Natl Acad Sci 112:184–89. - PMC - PubMed
    1. Bradfer-Lawrence T, Gardner N, Bunnefeld L, Bunnefeld N, Willis SG, Dent DH. 2019. Guidelines for the use of acoustic indices in environmental research. Methods Ecol Evol 10:1796–1807.