. 2023 Oct 5;26(11):108133.
doi: 10.1016/j.isci.2023.108133. eCollection 2023 Nov 17.

An interleukin 6 responsive plasma cell signature is associated with disease progression in systemic sclerosis interstitial lung disease

Affiliations

An interleukin 6 responsive plasma cell signature is associated with disease progression in systemic sclerosis interstitial lung disease

Guiquan Jia et al. iScience. .

Abstract

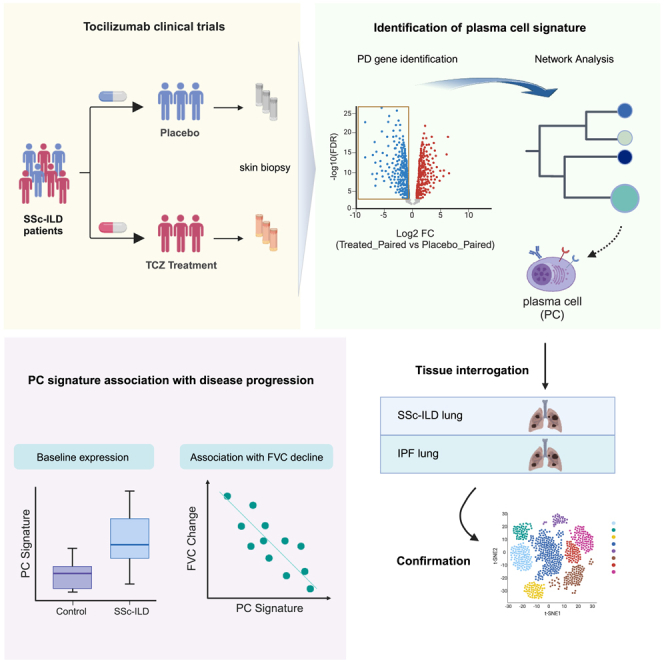
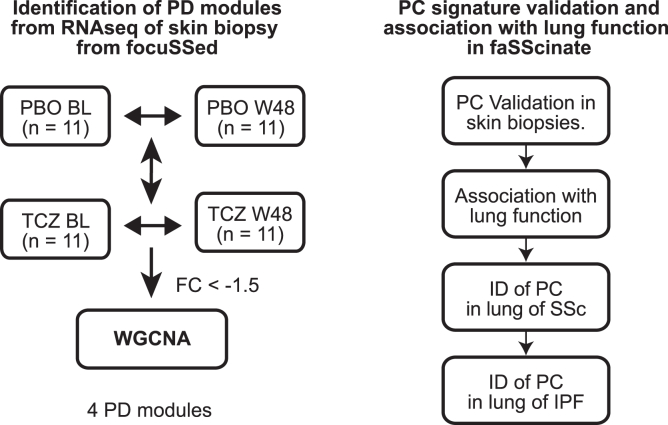
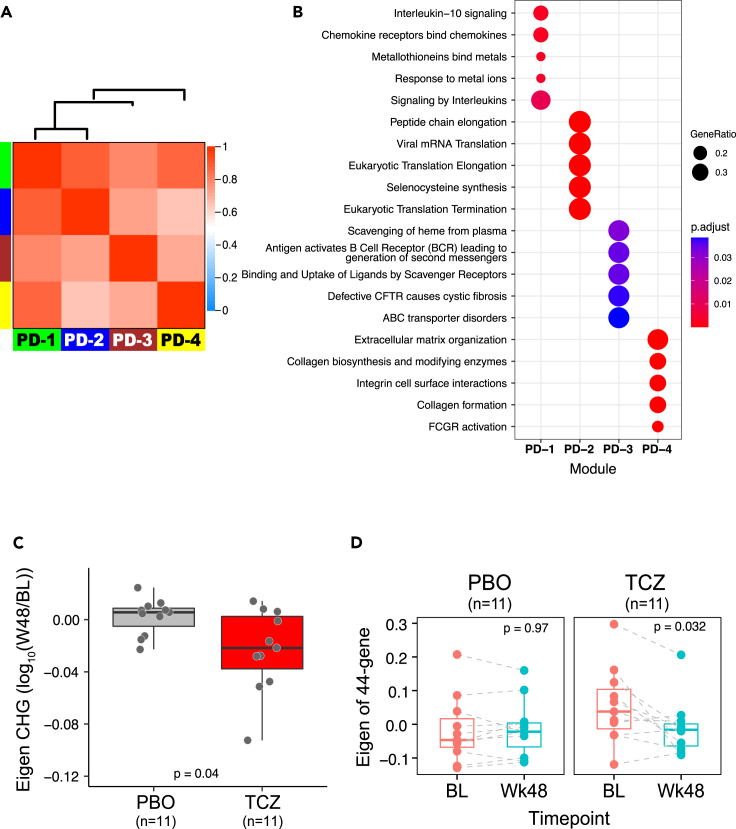
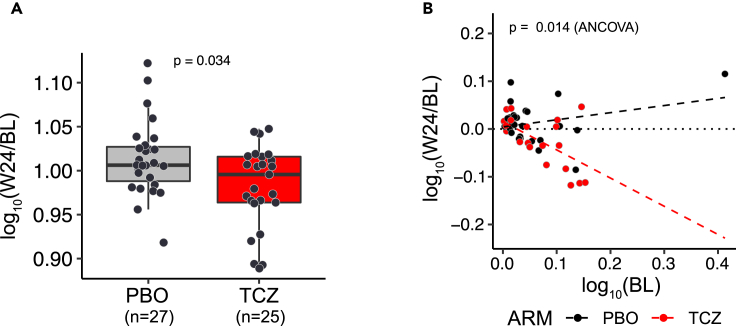
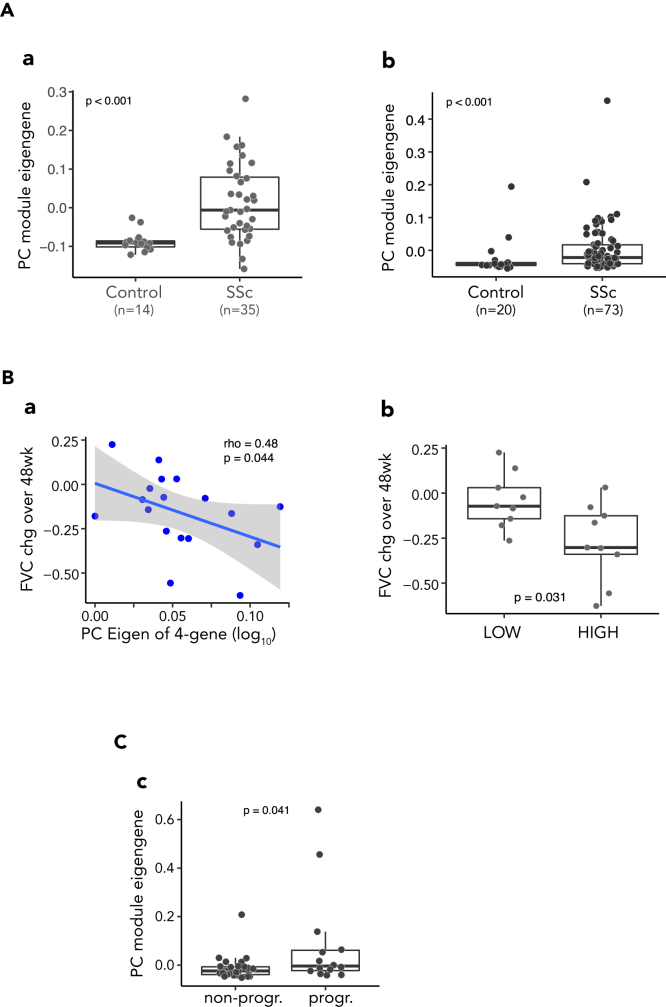
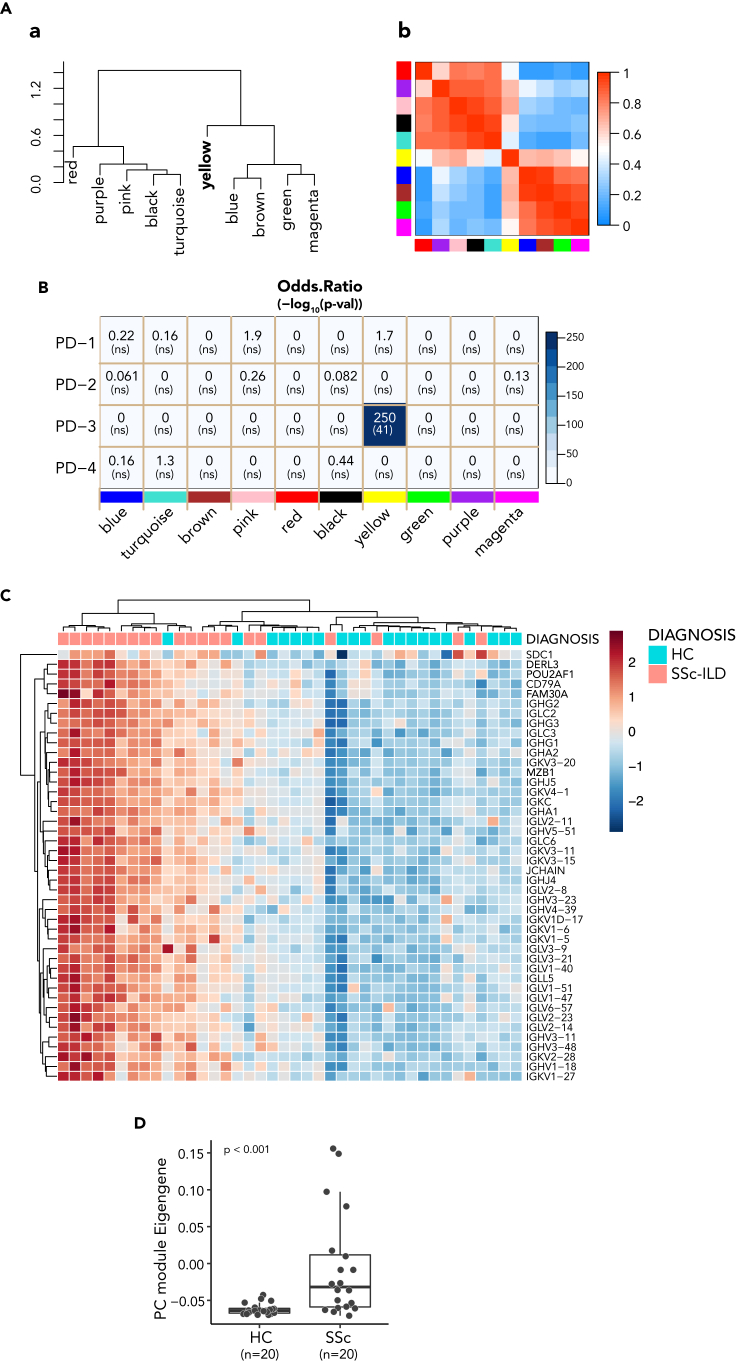
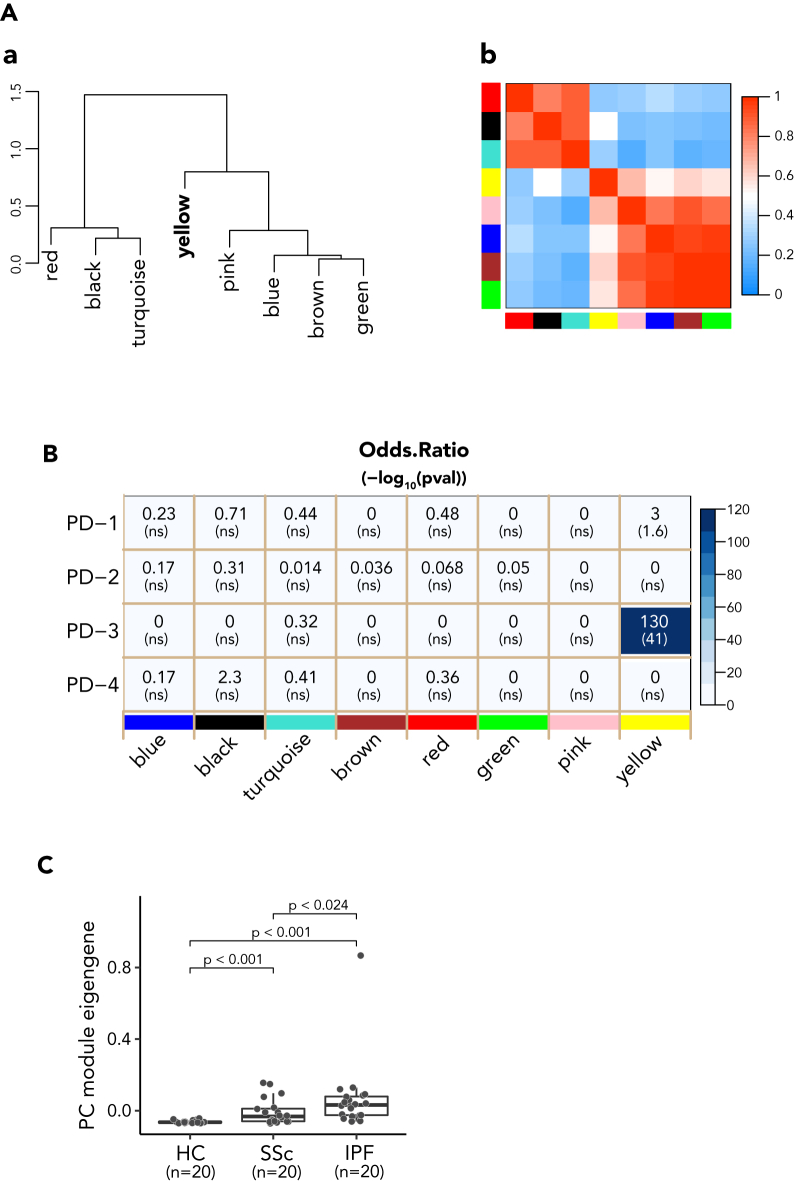
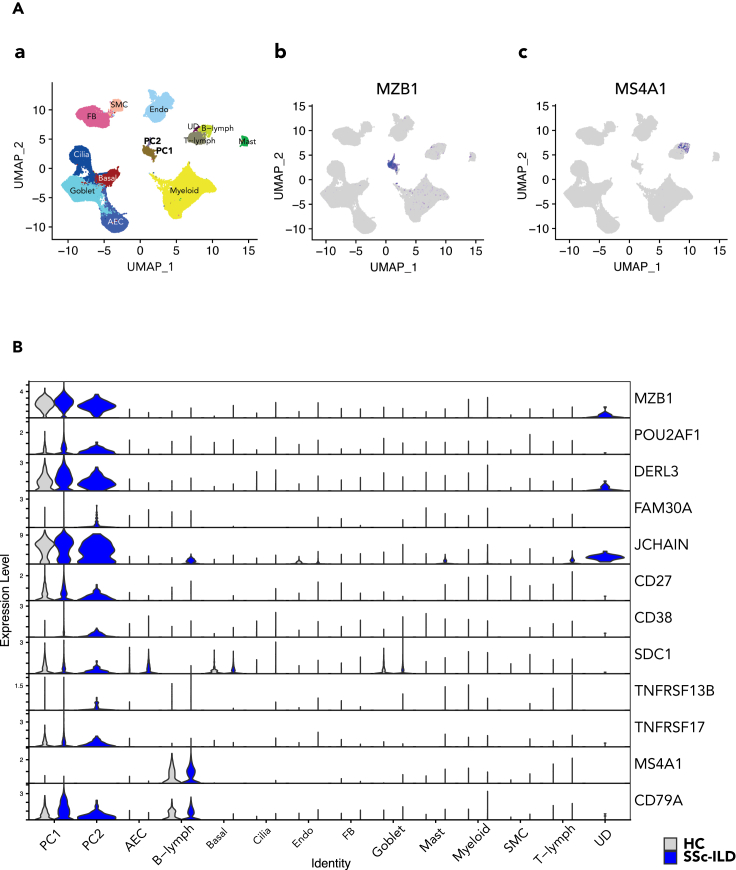
Systemic sclerosis (SSc) interstitial lung disease (ILD) is among the leading causes of SSc-related morbidity and mortality. Tocilizumab (TCZ, anti-IL6RA) has demonstrated a reduced rate of pulmonary function decline in two phase 2/3 trials (faSScinate and focuSSced) in SSc-ILD patients. We performed transcriptome analysis of skin biopsy samples collected in the studies to decipher gene networks that were potentially associated with clinical responses to TCZ treatment. One module correlated with disease progression showed pharmacodynamic changes with TCZ treatment, and was characterized by plasma cell (PC) genes. PC signature gene expression levels were also significantly increased in both fibrotic SSc and IPF lungs compared to controls. scRNAseq analyses confirmed that PC signature genes were co-expressed in CD38 and CD138 expressing PC subsets in SSc lungs. These data provide insights into the potential role of PC in disease progression and mechanisms of action of TCZ in fibrotic interstitial lung diseases.

Keywords: Biological sciences; Fibrosis; Immunology; Molecular biology.


Conflict of interest statement

The authors declare no competing interests.

Figures

None
Graphical abstract
Figure 1
Figure 1
Flow chart of the data analysis The figure summarizes the main procedures and steps in the entire data analysis; the left panel illustrates the analytical steps for the identification (ID) of pharmacodynamic (PD) modules, while the right panel shows the validation of plasma cell (PC) as PD module associated with the disease. BL: baseline; W48: week 48; FaSS: FaSScinate; PC: plasma cells; PD: pharmacodynamic; PBO: placebo group; TCZ: the group of treatment with tocilizumab; WGCNA: weighted gene co-expression network analysis.
Figure 2
Figure 2
Identified PD modules from RNAseq of skin biopsy (A) The Module eigengene adjacency dendrogram (top) and heatmap with red and blue indicating highly related and unrelated modules, respectively, depicting the relationship of the modules of PD genes identified by WGCNA. The color row below the heatmap indicates PD module assignment: PD-1 (n = 33 genes), PD-2 (n = 211 genes), PD-3 (n = 44 genes), and PD-4 (n = 44 genes). (B) Reactome pathway enrichment of each module gene set. Pathways were determined for each module gene using the compareCluster function with Reactome database. The top 5 of the most over-represented the classification of pathways are illustrated as dot plots, with the gene ratio denoted by size and the significance denoted by color. The p values were adjusted by the Benjamini-Hochberg method. (C) PC module eigengene (ME) was down-regulated in TCZ treatment group compared with placebo group in the FocuSSced cohort. The eigengene change of PC module 48 weeks post treatment from pretreatment is expressed as log10 on y axis; the p value (Wilcoxon test) is indicated at the bottom of graph. (D) Paired comparison of module eigengene at baseline and 48 weeks following-up. Intra-patient comparison showed a significant reduction of ME in patients with TCZ treatment but not with placebo (PBO).
Figure 3
Figure 3
PC signature is down-regulated by TCZ treatment in FaSScinate cohort (A) PC signature is down-regulated in TCZ treatment arm compared with placebo arm. The eigengene change of 3-gene PC signature 24 weeks post treatment from pretreatment is expressed on y axis and p value labeled on the top of graph is from Wilcoxon test. (B) Additional test with ANCOVA model confirmed the significant down-regulation of PC signature by TCZ treatment and the greater PD effects on the subjects with higher PC expression level. Scatterplot shows the function of change (follow-up/baseline measurements) against baseline measurements, both in log10. The dotted line represents perfect agreement (no change) and the dashed lines are fitted regression lines for TCZ treatment and placebo groups. P value was from ANCOVA test.
Figure 4
Figure 4
Elevated PC signature was associated with FVC decline in SSc-ILD (A) Baseline PC module is highly elevated in SSc skin compared with healthy controls. (a) PC module eigengene in FocuSSced; (b) 3-gene eigengene in FaSScinate. (B) Baseline PC module expression associated with FVC decline over 48 weeks. (a) PC module eigengene (ME) in skin biopsies was correlated inversely with FVC change (percent predicted) in placebo group of the FocuSSced study. The Spearman correlation coefficient and p value are listed on the top of the plot. (b) Subjects dichotomized according to median baseline ME showed significant differences in FVC change. P value was from Wilcoxon test. LOW: the group with baseline ME less than the median; HIGH: the group with baseline ME greater than the median. (C) The progressors in lung function decline showed higher PC gene expression in the placebo arm of FaSScinate cohort. Progressors (progr.) were defined as subjects with FVC decline over 48 weeks ≥ 10% or DLCO decline >15%. P value was from Wilcoxon test.
Figure 5
Figure 5
Skin PC signature enriched in SSc-ILD lung (A) Relationship between WGCNA derived module eigengenes from RNAseq of SSc-ILD lung. (a) The eigengene dendrogram of DEG genes on hierarchical clustering of adjacency-based dissimilarity, and (b) relationship of modules on eigengene adjacency heatmap. The modules assigned in WGCNA were either text labeled in (a) or color labeled on both axes of the heatmap in (b), respectively. Colors in heatmap are from low adjacency (blue) to high adjacency (red). (B) Heatmap showing the overall results from overlap analysis between the module genes from SSc-ILD lung and PD modules from SSc skin. Blue color gradient represents the odds ratio score. The number on the top in each square box of heatmap represents the odds ratio value from the analysis, while the number in the parentheses at the bottom represents the p value in -log10. The color labeled modules derived from the RNAseq of SSc-ILD lung are on the x axis and 4 PD modules from skin RNAseq are on y axis. ns represents no statistical significance with a cutoff of p < 0.05. (C) Heatmap of elevated PC gene expression in RNAseq of SSc-IL lungs compared with control lungs. PC module genes (n = 44) in rows and subjects in columns were hierarchically clustered and the gene expression was transformed and standardized to Z score. The conventional PC marker CD138 (encoded by SDC1) was included as a reference displayed on the top of row in the heatmap. The four PC signature genes are highlighted in bold in the label. (D) Elevated PC ME in lung of SSc-ILD. PC ME of SSc-ILD lung was compared with controls. p value shown on the top of plot was derived from Wilcoxon test.
Figure 6
Figure 6
Skin PC signature enriched in IPF ILD lungs (A) Relationship between WGCNA derived module eigengenes from RNAseq of IPF lung. (a) The eigengene dendrogram of DEG genes on hierarchical clustering of adjacency-based dissimilarity, and (b) relationship of modules on eigengene adjacency heatmap depicted tight clusters of correlated eigengenes of modules. The modules assigned in WGCNA, were either text labeled in (a) or color labeled on both axes of the heatmap in (b), respectively. Colors in heatmap are from low adjacency (blue) to high adjacency (red). (B) Heatmap showing the overall results from overlap analysis between the module genes from IPF lung and PD modules from SSc skin. Blue color gradient represents the score of odds ratios. The number on the top in each square box of heatmap represents the odds ratio of overlapping from the analysis, while the number in parentheses at the bottom represents the p value in -log10. The color labeled modules derived from the RNAseq of IPF lung are present on x axis and 4 PD modules from skin RNAseq are on y axis. ns represents no statistical significance with a cutoff of p < 0.05. (C) PC ME in control and ILD lungs. PC MEs of SSc and IPF lungs were compared to each other and to controls (n = 20 in each category as shown). P value shown on the top of plot was derived from Wilcoxon test.
Figure 7
Figure 7
Confirmation of plasma cells in ILD lungs by scRNAseq (A) UMAP atlas of scRNAseq from explanted lung cells depicted an MZB1 expressing subset. The annotated subsets of SSc-ILD lung cells are shown on the left (a) as the reference for cell type position on the UMAP atlas and MZB1 positive (b) and MS4A1 (encoding CD20) (c) cell subsets are depicted with a color spectrum. AEC: alveolar epithelial cells; FB: fibroblasts; SMC: smooth muscle cells; Endo: endothelium; UD: undetermined cells; PC1/PC2, plasma cells. (B) Skin PC signature genes are distinctly expressed in plasma cells in SSc-ILD lung tissue. The gene expression of interest and relevant to B cell development stages are presented in a stacked violin plot in comparison between the control and SSc, where genes related to specific B cell sub-types are listed on the right of y axis and the annotated clusters on x axis. The colors represent the sources of RNAseq, blue from SSc-ILD lung (SSc-ILD), whereas gray from the healthy control (HC). TNFRSF17: encoding BCMA; TNFRSF13B: encoding TACI.

References

    1. Allanore Y., Simms R., Distler O., Trojanowska M., Pope J., Denton C.P., Varga J. Systemic sclerosis. Nat. Rev. Dis. Primers. 2015;1:15002. doi: 10.1038/nrdp.2015.2. - DOI - PubMed
    1. Khanna D., Lescoat A., Roofeh D., Bernstein E.J., Kazerooni E.A., Roth M.D., Martinez F., Flaherty K.R., Denton C.P. Systemic Sclerosis–Associated Interstitial Lung Disease: How to Incorporate Two Food and Drug Administration–Approved Therapies in Clinical Practice. Arthritis Rheumatol. 2022;74:13–27. doi: 10.1002/art.41933. - DOI - PMC - PubMed
    1. Nikpour M., Baron M. Mortality in systemic sclerosis. Curr. Opin. Rheumatol. 2014;26:131–137. doi: 10.1097/bor.0000000000000027. - DOI - PubMed
    1. Giuggioli D., Lumetti F., Colaci M., Fallahi P., Antonelli A., Ferri C. Rituximab in the treatment of patients with systemic sclerosis. Our experience and review of the literature. Autoimmun. Rev. 2015;14:1072–1078. doi: 10.1016/j.autrev.2015.07.008. - DOI - PubMed
    1. Bosello S.L., Basile U., Lorenzis E.D., Canestrari G., Parisi F., Rucco M., Birra D., Gulli F., Napodano C., Pocino K., et al. FRI0238 Increased Serum Free Light Chains of Immunoglobulins in Systemic Sclerosis Patients: Correlation with Lung Involvement and Inflammatory Milieu. Ann. Rheum. Dis. 2016;75:520. doi: 10.1136/annrheumdis-2016-eular.5735. - DOI