. 2023 Sep 14;3(10):100409.
doi: 10.1016/j.xgen.2023.100409. eCollection 2023 Oct 11.

Molecular signature incorporating the immune microenvironment enhances thyroid cancer outcome prediction

Affiliations

Molecular signature incorporating the immune microenvironment enhances thyroid cancer outcome prediction

George J Xu et al. Cell Genom. .

Abstract

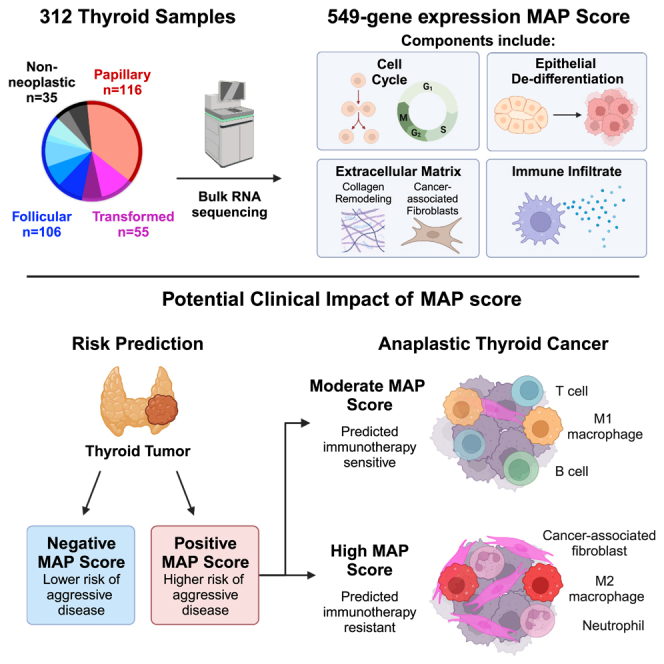
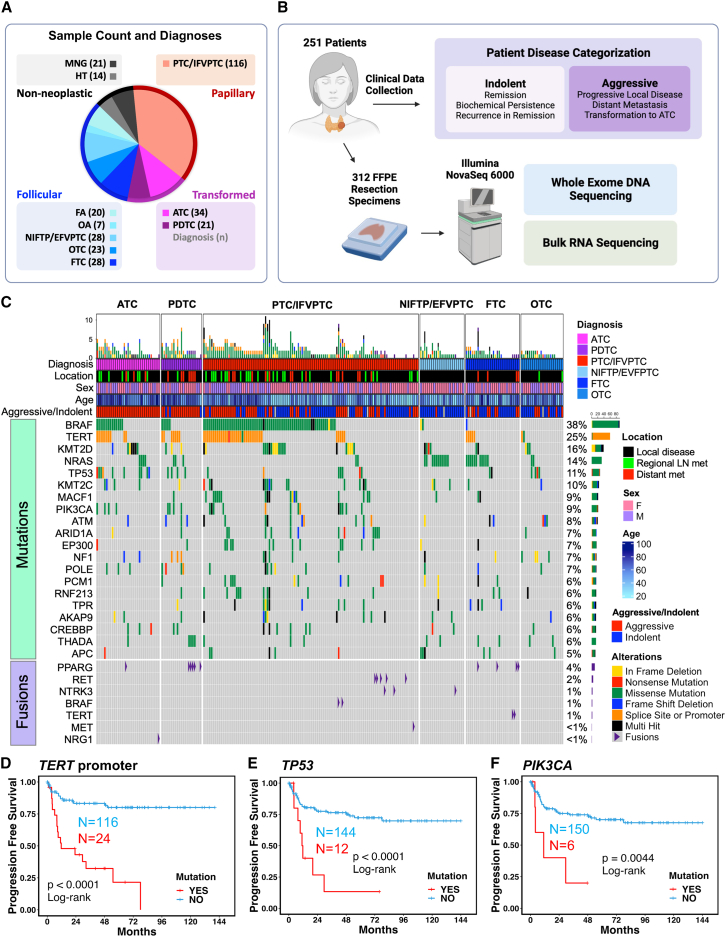
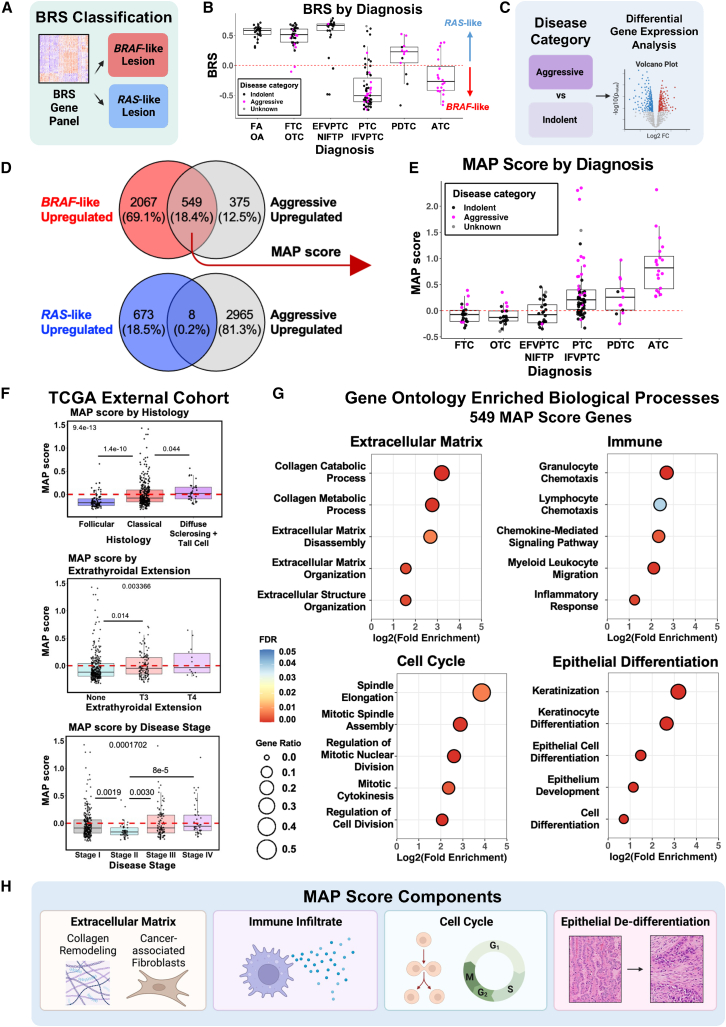
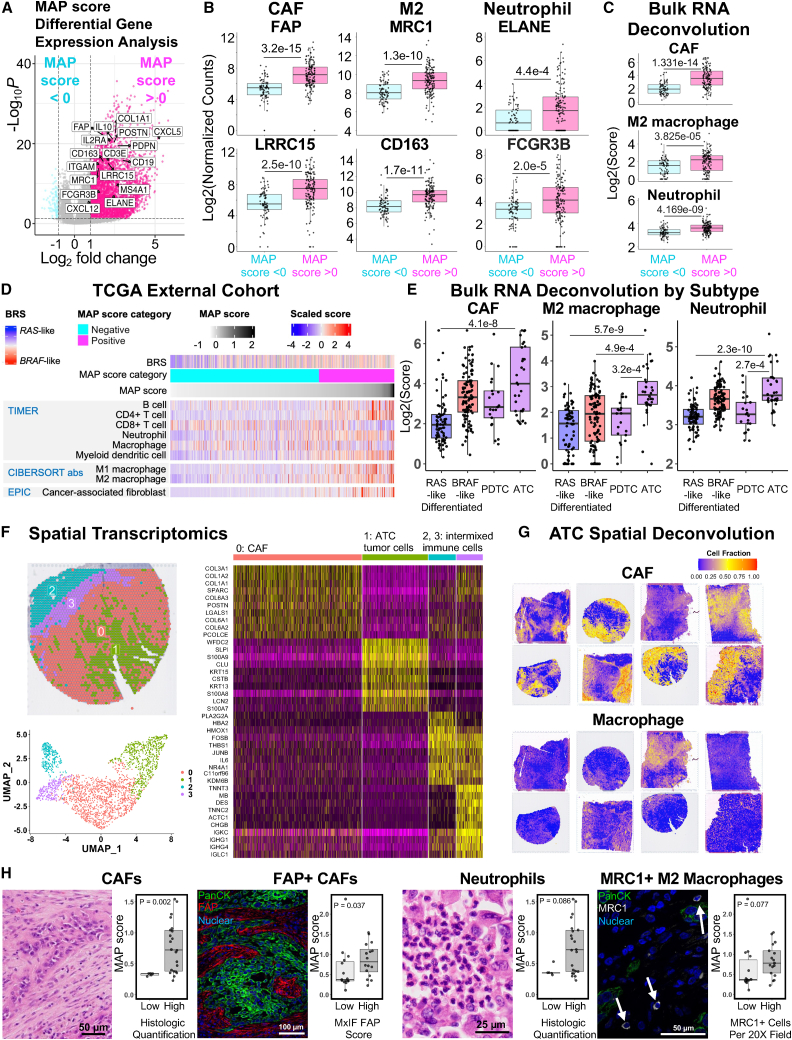
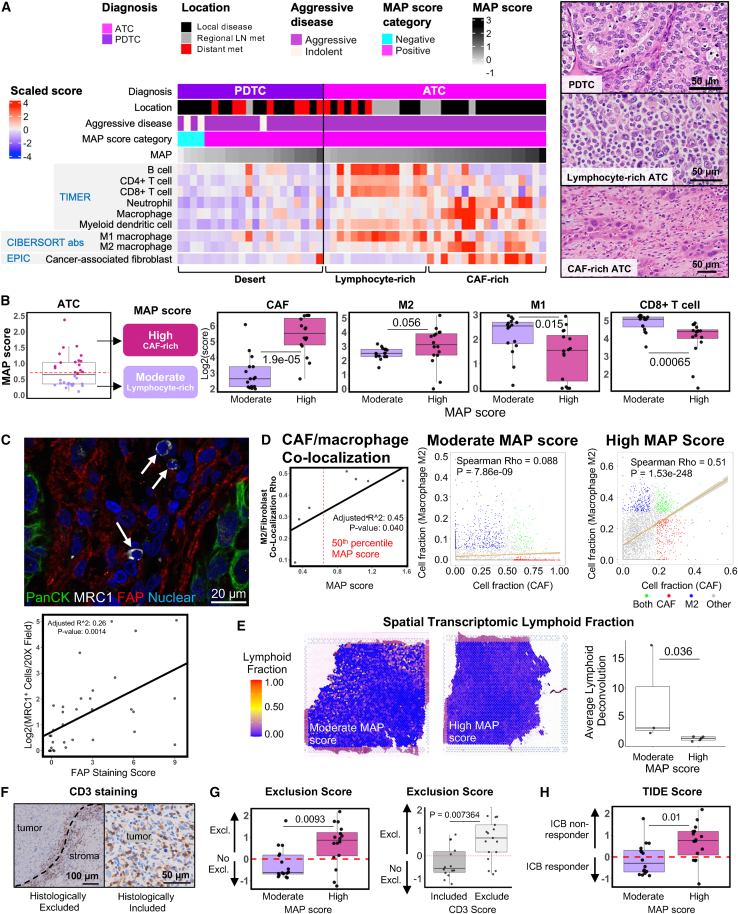
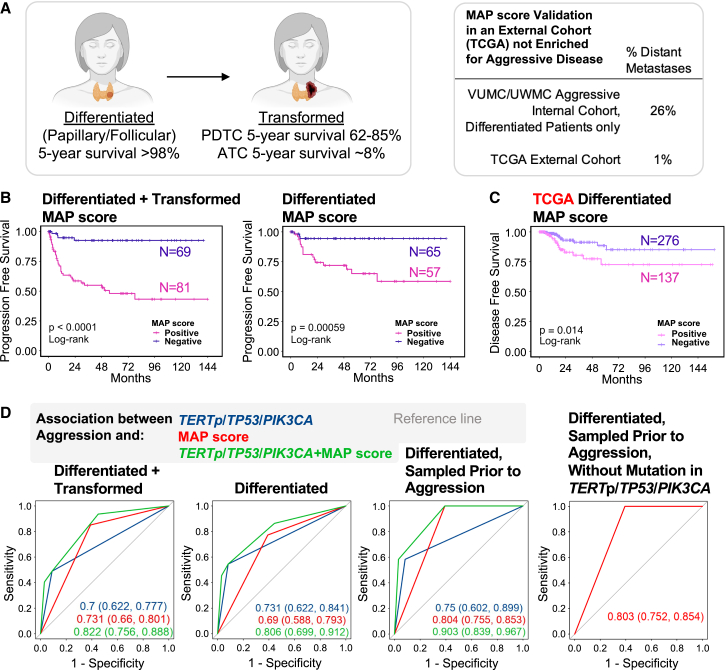
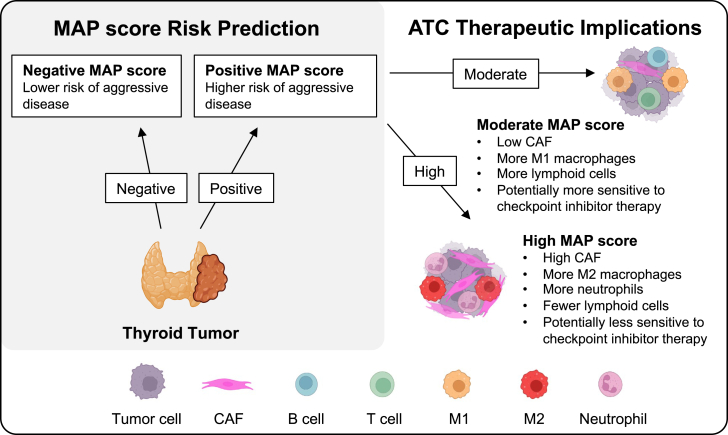
Genomic and transcriptomic analysis has furthered our understanding of many tumors. Yet, thyroid cancer management is largely guided by staging and histology, with few molecular prognostic and treatment biomarkers. Here, we utilize a large cohort of 251 patients with 312 samples from two tertiary medical centers and perform DNA/RNA sequencing, spatial transcriptomics, and multiplex immunofluorescence to identify biomarkers of aggressive thyroid malignancy. We identify high-risk mutations and discover a unique molecular signature of aggressive disease, the Molecular Aggression and Prediction (MAP) score, which provides improved prognostication over high-risk mutations alone. The MAP score is enriched for genes involved in epithelial de-differentiation, cellular division, and the tumor microenvironment. The MAP score also identifies aggressive tumors with lymphocyte-rich stroma that may benefit from immunotherapy. Future clinical profiling of the stromal microenvironment of thyroid cancer could improve prognostication, inform immunotherapy, and support development of novel therapeutics for thyroid cancer and other stroma-rich tumors.

Keywords: aggressive thyroid cancer; anaplastic thyroid carcinoma; cancer-associated fibroblasts; molecular biomarkers; next-generation sequencing; tumor immune microenvironment.


Conflict of interest statement

E.L. is a co-founder of StemSynergy Therapeutics, a company that seeks to develop inhibitors of major signaling pathways (including the Wnt pathway) for the treatment of cancer. E.M.J. reports other support from Abmeta, other support from Adventris, personal fees from Achilles, personal fees from DragonFly, personal fees from Parker Institute, personal fees from Surge, grants from Lustgarten, grants from Genentech, personal fees from Mestag, personal fees from Medical Home Group, grants from BMS, and grants from Break Through Cancer outside the submitted work.

Figures

None
Graphical abstract
Figure 1
Figure 1
Mutations associated with aggressive thyroid cancer (A) Cohort summary quantifying number of samples within each diagnosis. Abbreviations: MNG, multinodular goiter; HT, Hashimoto thyroiditis; FA, follicular adenoma; OA, oncocytic adenoma; NIFTP, noninvasive follicular thyroid neoplasm with papillary-like nuclear features; EFVPTC, encapsulated follicular variant papillary thyroid carcinoma, OTC, oncocytic thyroid carcinoma; FTC, follicular thyroid carcinoma; PTC, papillary thyroid carcinoma; IFVPTC, infiltrative follicular variant papillary thyroid carcinoma, PDTC, poorly differentiated thyroid carcinoma; ATC, anaplastic thyroid carcinoma. (B) Schematic representation showing patient disease categorization as well as pipeline used for sequencing data collection. 312 formalin-fixed, paraffin-embedded (FFPE) resection samples underwent high-throughput sequencing. (C) Oncoplot showing mutational landscape of malignant thyroid lesions. The 20 most frequently mutated genes after filtering are displayed. Annotation bars above show diagnosis, tissue location of the lesion sequenced, sex of the patient, age of the patient at surgery, and patient disease categorization. Detected thyroid cancer fusions are also shown. (D–F) Progression-free survival (PFS) plots for patients with malignant thyroid lesions with and without TERT promoter mutation (D), TP53 mutation (E), and PIK3CA mutation (F). p values were calculated with log rank test.
Figure 2
Figure 2
Molecular Aggression and Prediction (MAP) score (A) Diagram outlining BRAF-RAS score (BRS) classification method. Positive BRS lesions were categorized as RAS-like, and negative BRS lesions were classified as BRAF-like. (B) Boxplots showing BRS from local disease samples. Color indicates clinical behavior (pink, aggressive; black, indolent; gray, no clinical follow-up after sample collection). Abbreviations: FA, follicular adenoma; OA, oncocytic adenoma; FTC, follicular thyroid carcinoma; OTC, oncocytic thyroid carcinoma; EFVPTC, encapsulated follicular variant papillary thyroid carcinoma, NIFTP, noninvasive follicular thyroid neoplasm with papillary-like nuclear features; PTC, papillary thyroid carcinoma; IFVPTC, infiltrative follicular variant papillary thyroid carcinoma, PDTC, poorly differentiated thyroid carcinoma; ATC, anaplastic thyroid carcinoma. (C) Diagram outlining method for identifying genes enriched in samples from patients with aggressive vs. indolent disease. (D) Venn diagrams showing the overlap of genes that are upregulated in BRAF-like lesions (red), RAS-like lesions (blue), and aggressive disease lesions (gray). Thresholds for upregulation was an adjusted p value <0.05 and fold change of ≥4 (aggressive disease upregulated for BRAF-like Venn diagram) or ≥2 (BRAF-like upregulated, RAS-like upregulated, and aggressive disease upregulated for RAS-like Venn diagram). (E) Boxplots of MAP score calculated from the 549 genes that overlap between BRAF-like and aggressive lesions in (C) (FTC, follicular thyroid carcinoma; OTC, oncocytic thyroid carcinoma; EFVPTC, encapsulated follicular variant papillary thyroid carcinoma, NIFTP, noninvasive follicular thyroid neoplasm with papillary-like nuclear features; PTC, papillary thyroid carcinoma; IFVPTC, infiltrative follicular variant papillary thyroid carcinoma, PDTC, poorly differentiated thyroid carcinoma; ATC, anaplastic thyroid carcinoma). Pink dots indicate lesions from patients with aggressive disease. (F) Boxplots of MAP score in TCGA samples plotted by histology, extrathyroidal extension, and disease stage. Three outliers for MAP score were omitted for improved visualization of plots. p values calculated with Kruskal-Wallis test with pairwise Wilcoxon rank-sum test and Bonferroni’s correction. (G) Gene ontology results for the 549 genes comprising MAP score, showing enrichment of extracellular matrix, immune, cell cycle, and epithelial differentiation processes. Statistical analysis of fold enrichment was performed with Fisher’s exact with false discovery rate correction. (H) Summary diagram of MAP score components predicted to be enriched in gene ontology analysis.
Figure 3
Figure 3
MAP score is associated with CAF, neutrophil, and M2 macrophage infiltrate in thyroid tumors (A) Volcano plot showing differentially expressed genes (fold change >2, adjusted p value <0.05) between malignant localized thyroid lesions with positive (pink) and negative (blue) MAP score. Samples with Hashimoto thyroiditis were excluded. Select markers of extracellular matrix, cancer-associated fibroblasts, and key immune cell populations are labeled. (B and C) Boxplots of all malignant thyroid lesions, excluding samples with Hashimoto thyroiditis, showing log-transformed CAF markers FAP and LRRC15, M2 macrophage polarization markers MRC1 and CD163, and neutrophil markers ELANE and FCGR3B from bulk RNA sequencing data (B) or log-transformed EPIC CAF score, CIBERSORT absolute value M2 macrophage score, and TIMER neutrophils score (C). Samples are categorized as negative MAP score (light blue) and positive MAP score (dark pink). p values were calculated with Wilcoxon rank-sum test. (D) Heatmap of select deconvolution results from TCGA, an external well-differentiated thyroid cancer cohort. BRS, MAP score category, and MAP score annotations displayed on the top of the heatmap, followed by TIMER scores, CIBERSORT absolute value M1/M2 macrophage scores, and EPIC CAF scores. Samples are sorted by increasing MAP score from left to right. (E) Boxplots of EPIC CAF score, CIBERSORT absolute value M2 macrophage score, and TIMER neutrophil score, with samples organized into the following thyroid lesion subtype groups: RAS-like (FTC, OTC, EFVPTC, and NIFTP), BRAF-like (PTC and IFVPTC), PDTC, and ATC. All scores are on a log2 scale. p values were calculated with Kruskal-Wallis test with pairwise Wilcoxon rank-sum test and Bonferroni’s correction. (F) Clustering of transcriptomic data from a representative ATC spatial transcriptomics sample with spatial mapping of clusters (upper left), UMAP (lower left), and differential gene expression heatmap showing the top 10 markers for each of the clusters (right). Clusters are labeled as CAF, ATC tumor cells, and intermixed immune cells based on marker genes in the heatmap. (G) SpaCET spatial deconvolution showing estimated spatial capture area cell fractions for CAF and macrophage for eight ATC samples. (H) Boxplots of MAP scores in ATCs, split into groups with either low or high histologic quantification of CAFs, FAP+ CAFs, neutrophils, and MRC1+ macrophages. Representative histology of specific cell types is shown to the left of quantification. p values were calculated with Wilcoxon rank-sum test.
Figure 4
Figure 4
MAP score is associated with tumor microenvironment composition in ATCs (A) Heatmap of select deconvolution results for PDTCs and ATCs. Diagnosis, tissue location, aggressive disease, MAP score category, and MAP score annotations displayed on the top of the heatmap, followed by TIMER scores, M1/M2 absolute value CIBERSORT immune deconvolution scores, and EPIC CAF scores. Samples are arranged by increasing MAP score from left to right within each diagnosis. Representative histology shown for PDTC, lymphocyte-rich ATC, and CAF-rich ATC. (B) Moderate and high MAP score ATC tumor categorization diagram (tumors split by 50th percentile MAP score), and boxplots of EPIC CAF score, CIBERSORT absolute M2 macrophage score, CIBERSORT absolute M1 macrophage score, and TIMER CD8+ T cell score, comparing moderate and high MAP score ATCs. All scores are on a log2 scale. p values were calculated with Wilcoxon rank-sum test. (C) Representative multiplex IF image of ATC with MRC1+ macrophages and adjacent FAP+ fibroblasts. White arrows indicate MRC1+ cells. Green, pan-cytokeratin, white, MRC1, red, FAP, blue, nuclear. Quantification of staining below showing the relationship between FAP staining and MRC1 staining. R2 and p value generated from a linear model with FAP staining score as the independent variable. (D) Linear model of M2 macrophage and fibroblast co-localization from SpaCET deconvolution of eight ATCs as a dependent variable of MAP score (left), with representative spatial capture area M2 macrophage and fibroblast non-parametric rho correlation plots of moderate and high MAP score ATCs (right). (E) Representative images of lymphocyte deconvolution from spatial transcriptomics data of moderate and high MAP score tumors (left) and comparison of average lymphoid spatial capture fraction between moderate and high MAP score tumors for all eight spatial transcriptomic samples (right). p value was calculated with Wilcoxon rank-sum test. (F) Representative CD3 stained samples showing histologically excluded or included T cells. (G) TIDE exclusion score in moderate and high MAP score ATCs and association with CD3 staining. p values were calculated with Wilcoxon rank-sum test. (H) TIDE score in moderate and high MAP score tumors. p value was calculated with Wilcoxon rank-sum test.
Figure 5
Figure 5
MAP score is associated with disease progression and predicted response to immune checkpoint blockade therapy (A) Diagram showing 5-year survival of patients with well-differentiated thyroid cancer and patients with transformed thyroid cancer. Table showing percent of samples that are metastatic in the internal cohort from Vanderbilt University Medical Center and University of Washington Medical Center and the external cohort from TCGA. (B) PFS in patients with well-differentiated and transformed thyroid cancer (left), as well as patients with only well-differentiated thyroid cancer (right), with positive (pink) or negative (purple) MAP score. p values were calculated with log rank test. (C) Disease-free survival in TCGA patients with well-differentiated thyroid cancer with positive (pink) or negative (purple) MAP score. p values were calculated with log rank test. (D) Receiver operating characteristic curve showing association between aggression and TERTp/TP53/PIK3CA mutation (blue), MAP score (red), and TERTp/TP53/PIK3CA mutation + MAP score (green), for patients with well-differentiated and transformed thyroid cancer (left), well-differentiated thyroid cancer (center-left), well-differentiated thyroid cancer sampled prior to aggression (center-right), and well-differentiated thyroid cancer sampled prior to aggression excluding any samples with a mutation in TERTp, TP53, and PIK3CA (right). Area under the curve values with 95% confidence intervals are shown. Metastatic tumors were excluded.
Figure 6
Figure 6
Outcome and therapy prediction using MAP score Summary diagram showing the potential role of MAP score for risk stratifying thyroid tumors.

Similar articles

Cited by

References

    1. Lim H., Devesa S.S., Sosa J.A., Check D., Kitahara C.M. Trends in Thyroid Cancer Incidence and Mortality in the United States, 1974-2013. JAMA. 2017;317:1338–1348. doi: 10.1001/jama.2017.2719. - DOI - PMC - PubMed
    1. Rahib L., Smith B.D., Aizenberg R., Rosenzweig A.B., Fleshman J.M., Matrisian L.M. Projecting cancer incidence and deaths to 2030: the unexpected burden of thyroid, liver, and pancreas cancers in the United States. Cancer Res. 2014;74:2913–2921. doi: 10.1158/0008-5472.CAN-14-0155. - DOI - PubMed
    1. Haugen B.R., Alexander E.K., Bible K.C., Doherty G.M., Mandel S.J., Nikiforov Y.E., Pacini F., Randolph G.W., Sawka A.M., Schlumberger M., et al. American Thyroid Association Management Guidelines for Adult Patients with Thyroid Nodules and Differentiated Thyroid Cancer: The American Thyroid Association Guidelines Task Force on Thyroid Nodules and Differentiated Thyroid Cancer. Thyroid. 2015;26:1–133. doi: 10.1089/thy.2015.0020. - DOI - PMC - PubMed
    1. Filetti S., Durante C., Hartl D., Leboulleux S., Locati L.D., Newbold K., Papotti M.G., Berruti A., ESMO Guidelines Committee Electronic address clinicalguidelines@esmoorg Thyroid cancer: ESMO Clinical Practice Guidelines for diagnosis, treatment and follow-up. Ann. Oncol. 2019;30:1856–1883. doi: 10.1093/annonc/mdz400. - DOI - PubMed
    1. Hwangbo Y., Kim J.M., Park Y.J., Lee E.K., Lee Y.J., Park D.J., Choi Y.S., Lee K.D., Sohn S.Y., Kim S.W., et al. Long-Term Recurrence of Small Papillary Thyroid Cancer and Its Risk Factors in a Korean Multicenter Study. J. Clin. Endocrinol. Metab. 2017;102:625–633. doi: 10.1210/jc.2016-2287. - DOI - PubMed