
Assessment of the probability of introduction of Thaumatotibia leucotreta into the European Union with import of cut roses

EFSA Panel on Plant Health (PLH) et al. EFSA J. .

Abstract

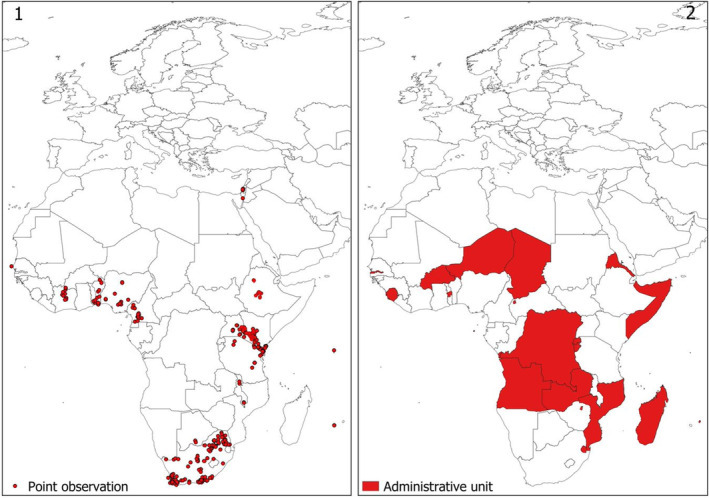
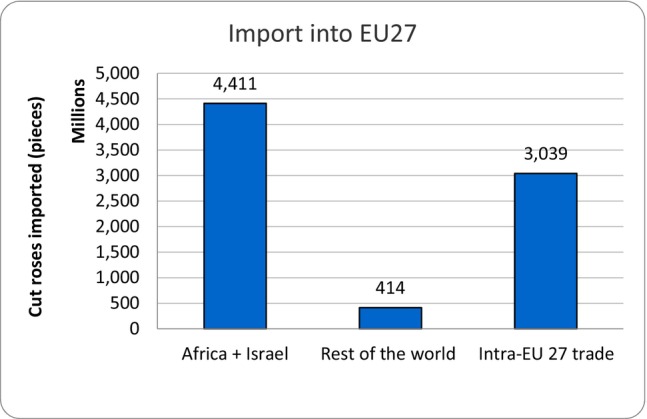
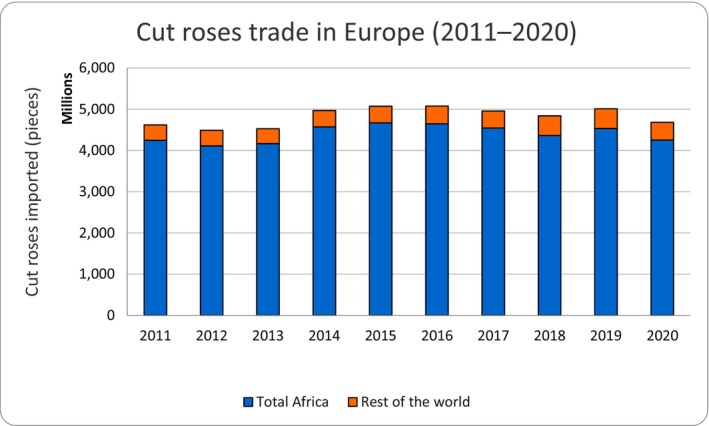
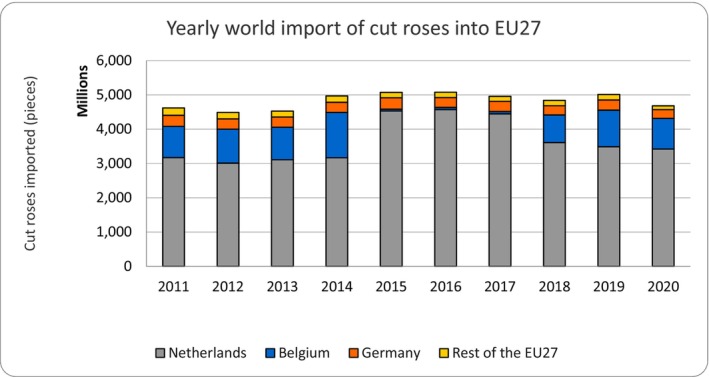
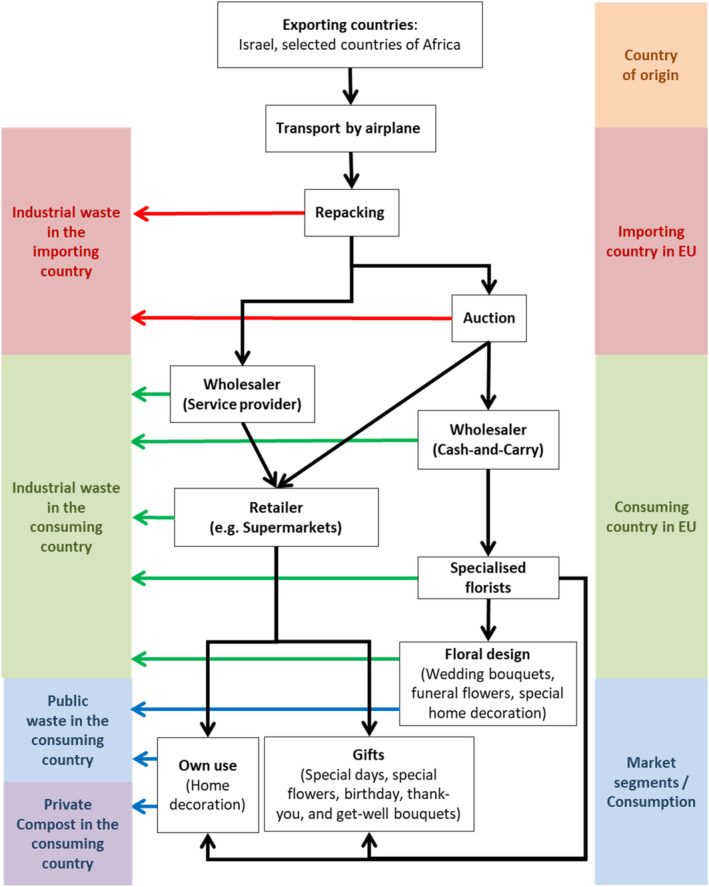
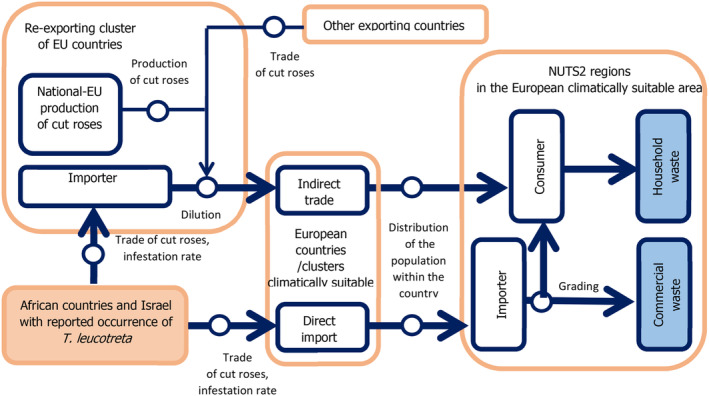
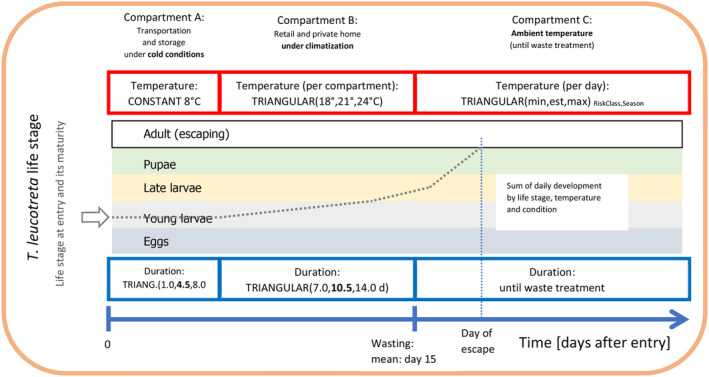
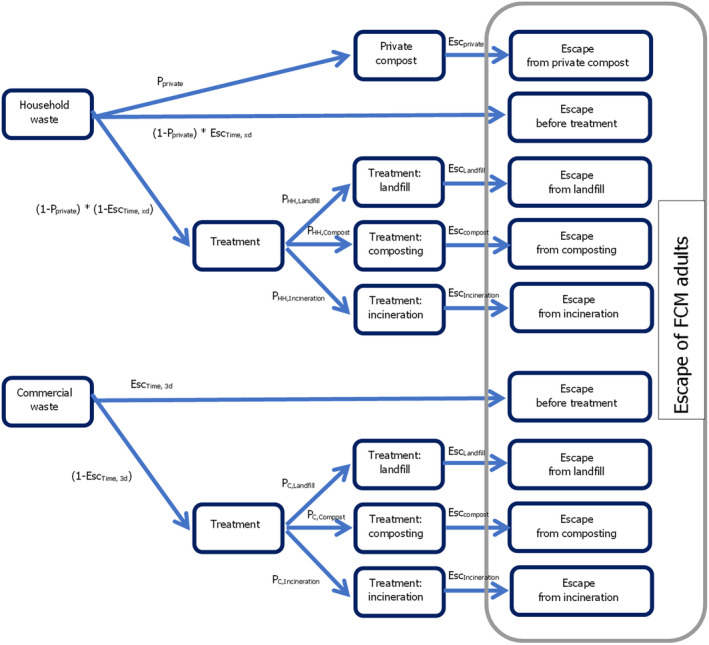
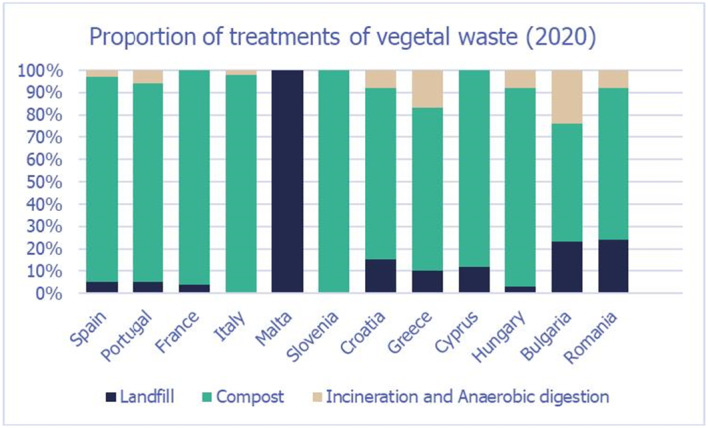
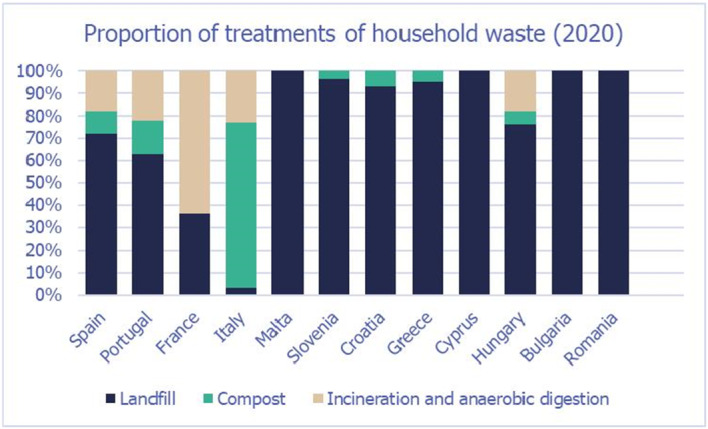
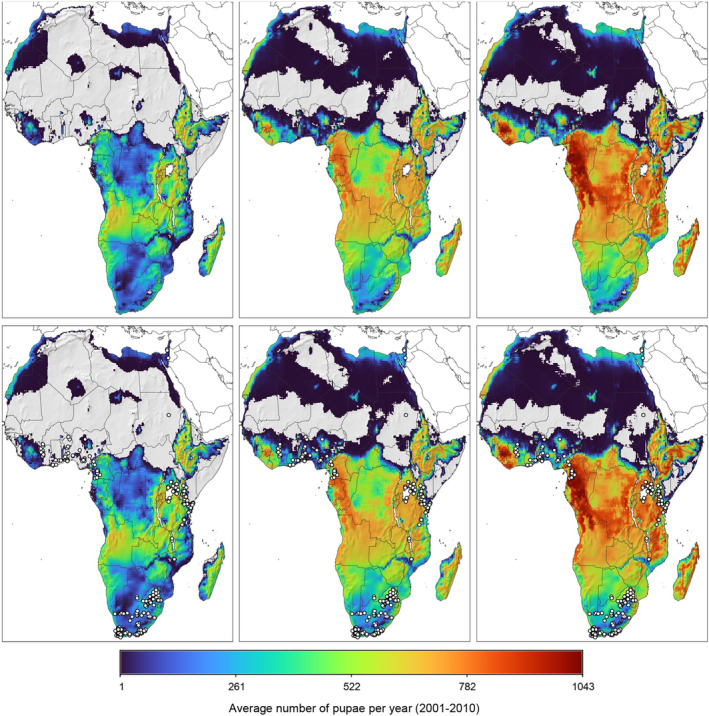
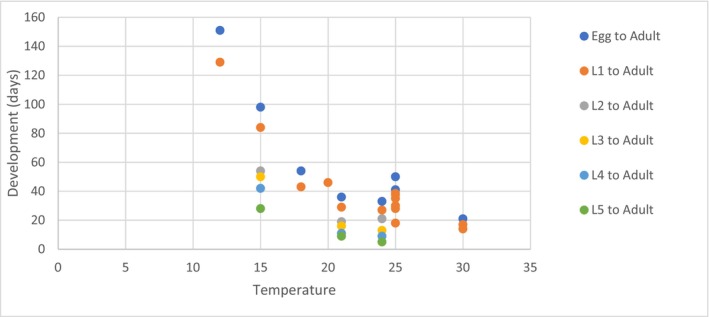
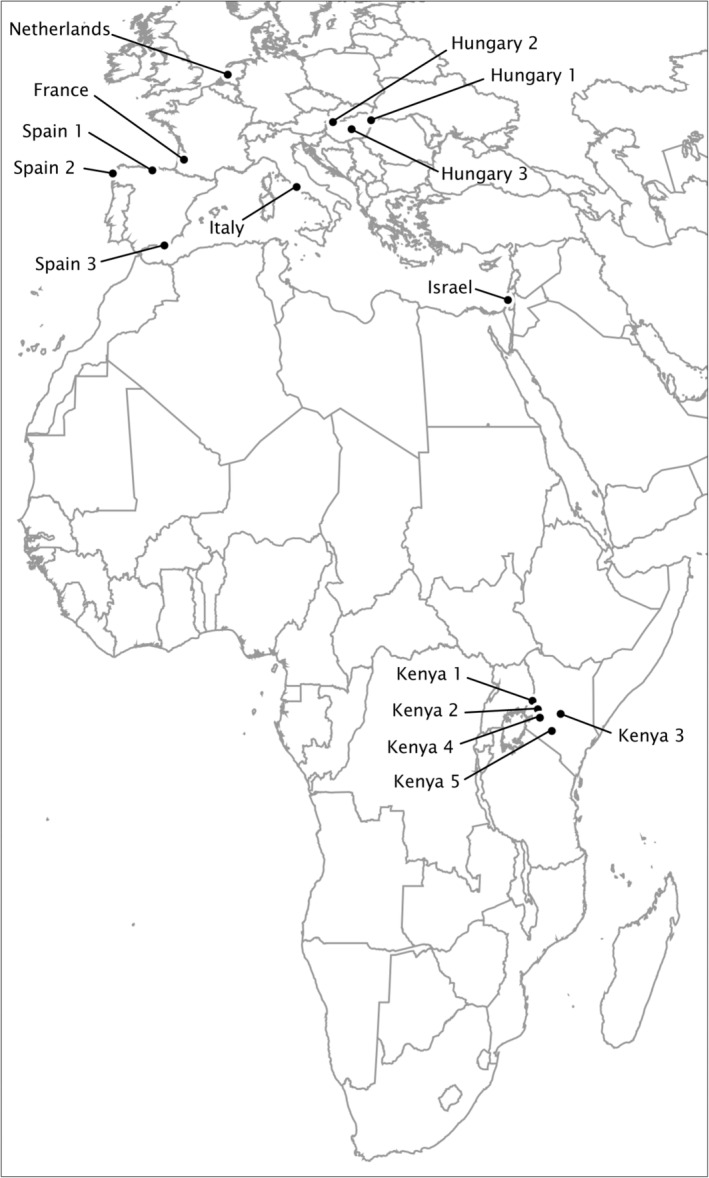
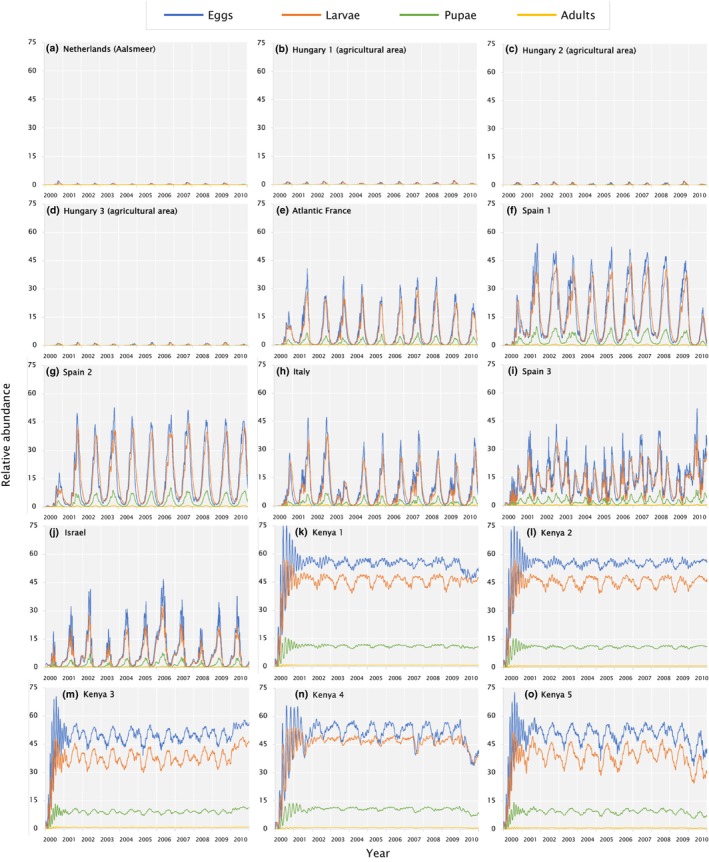
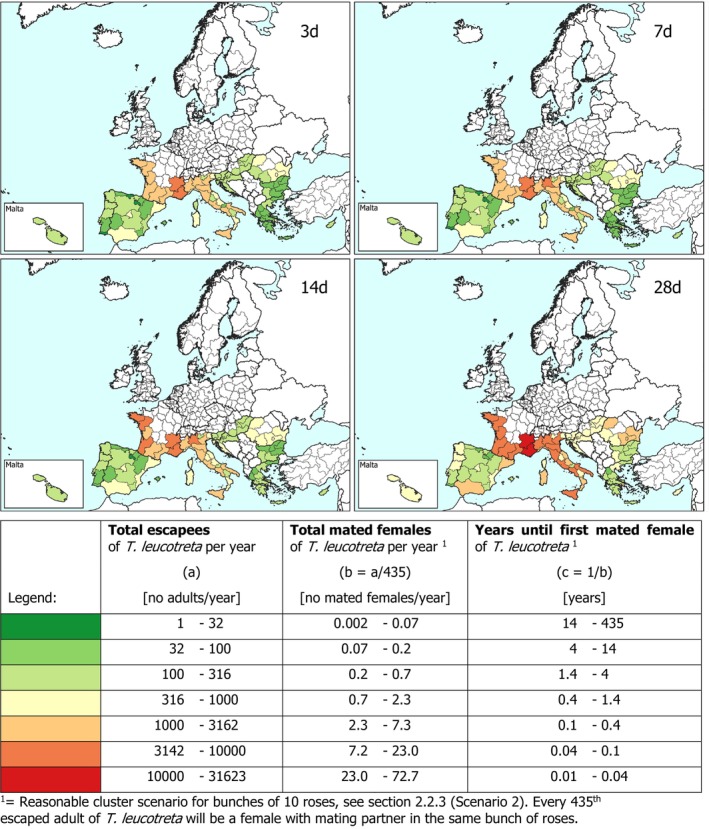
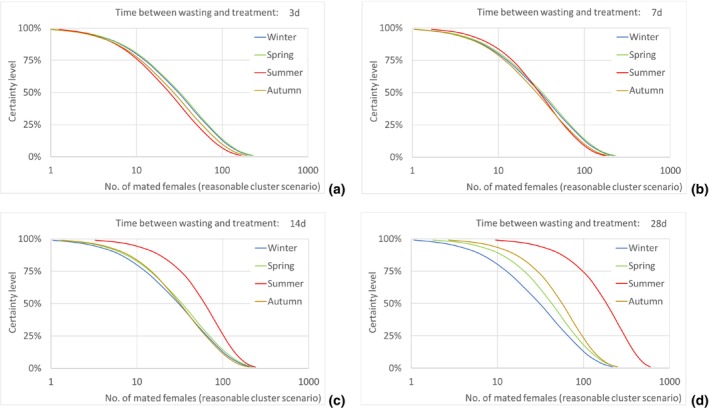
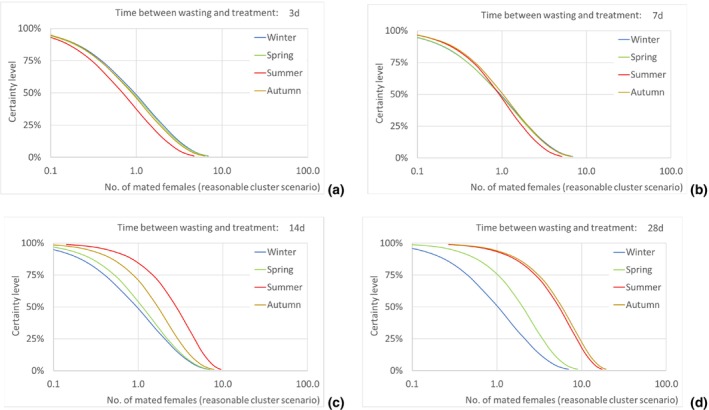
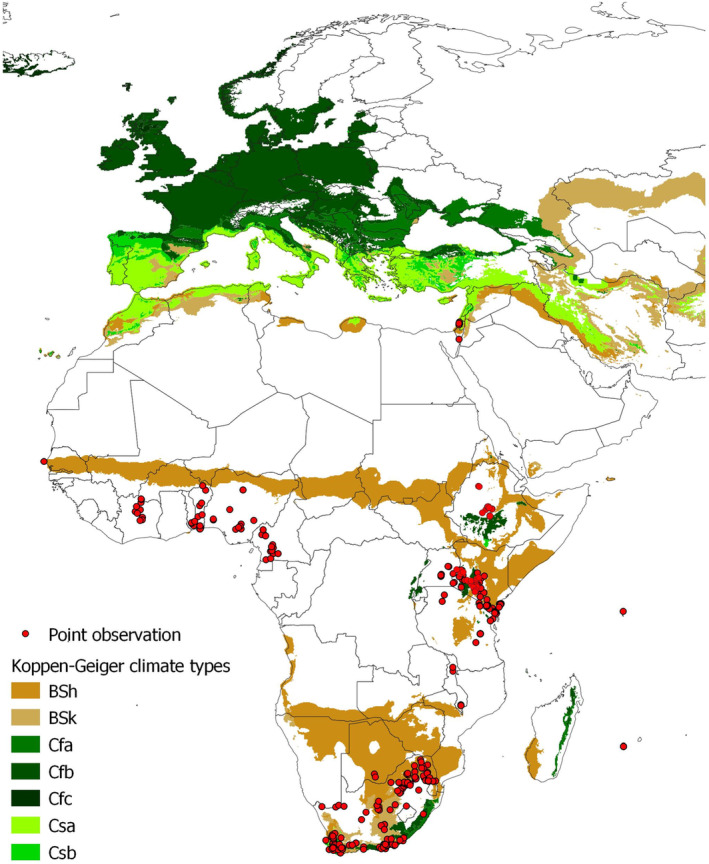
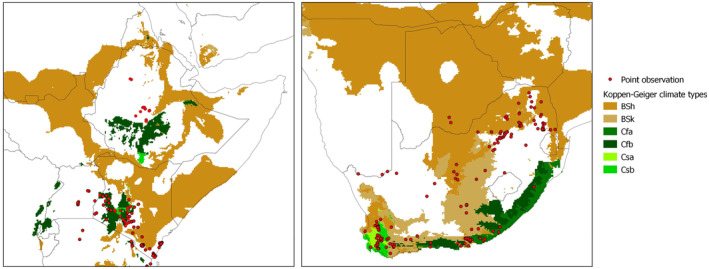
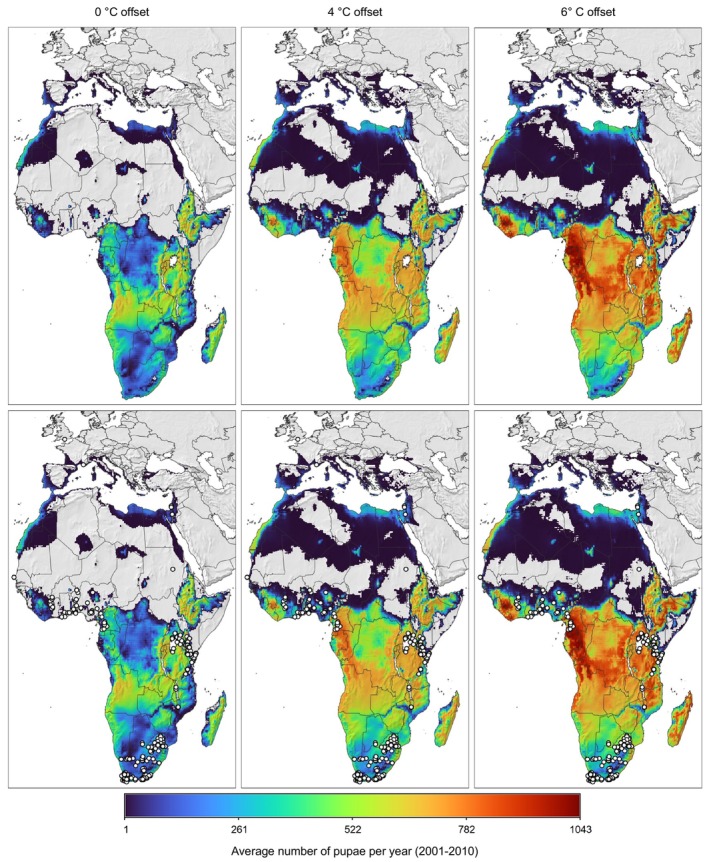
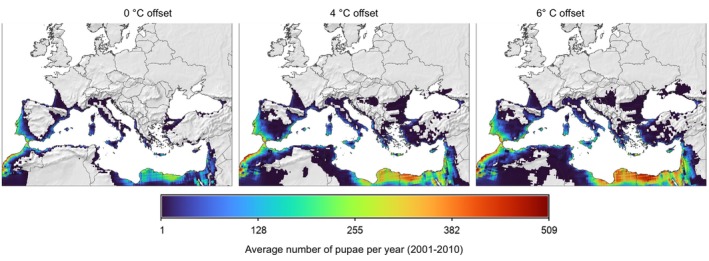
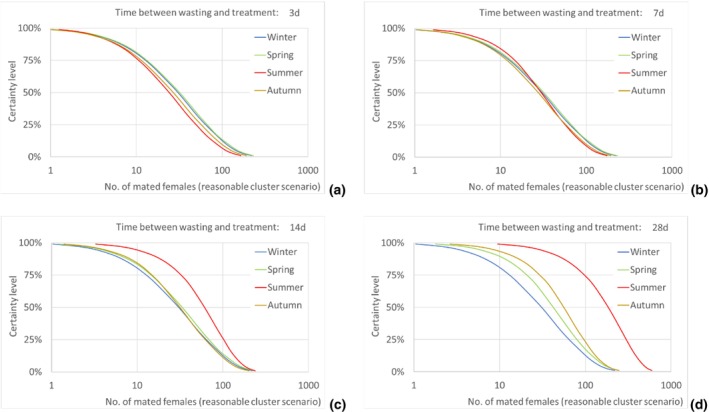
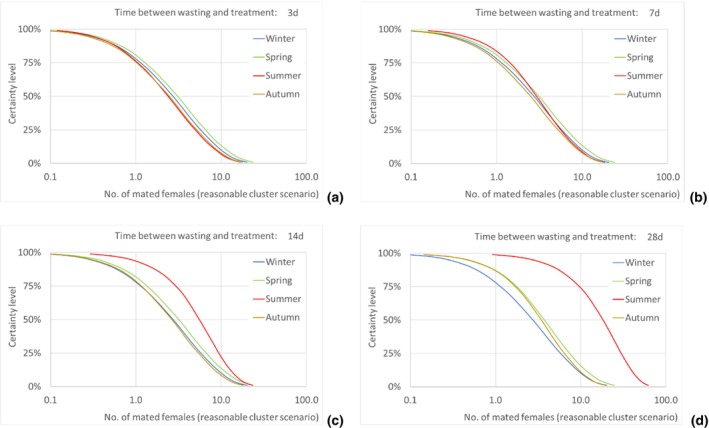
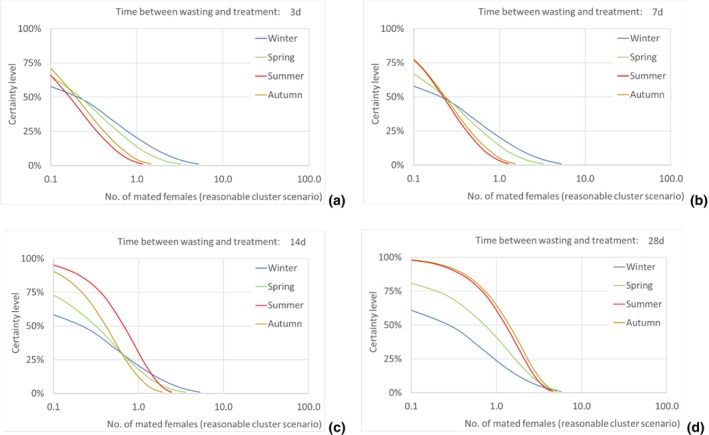
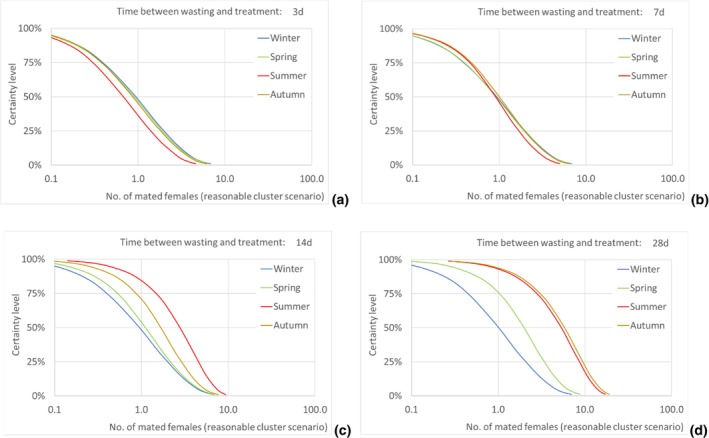
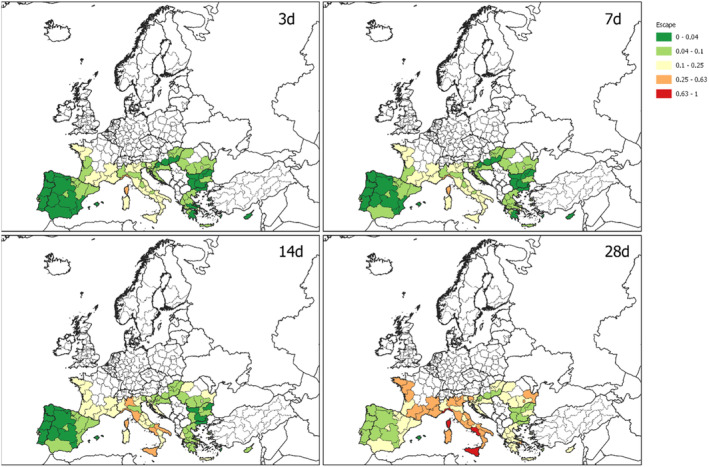
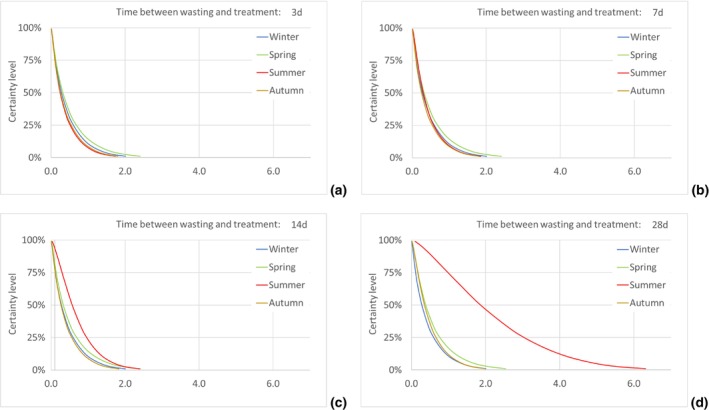
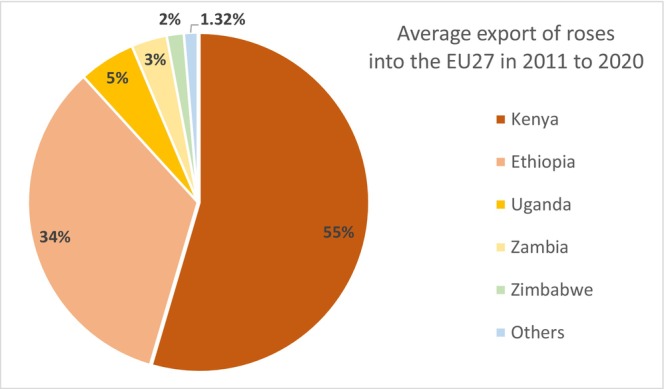
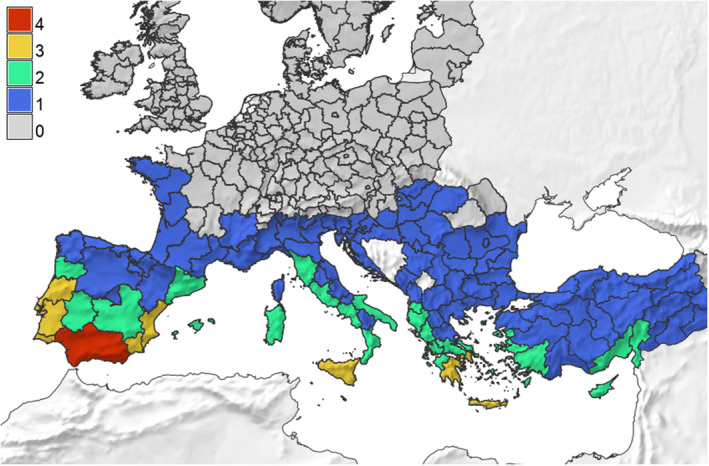
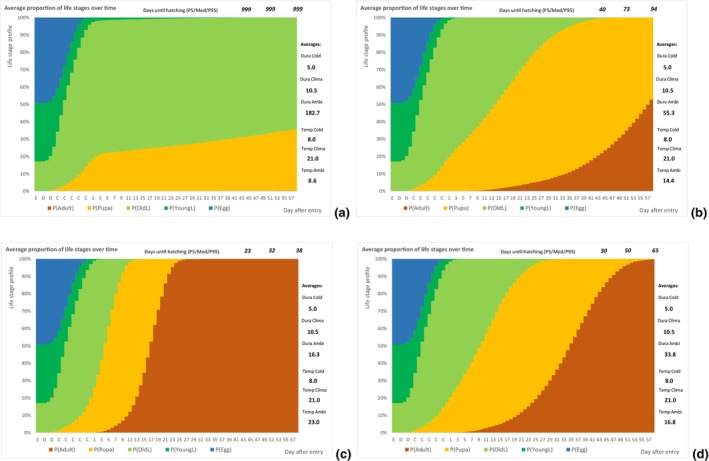
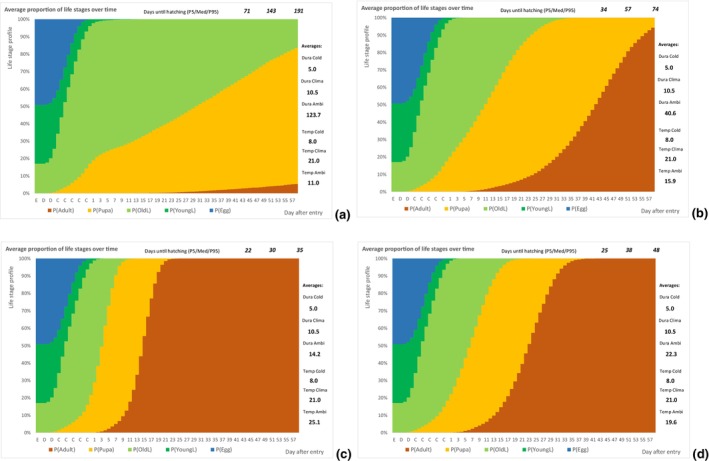
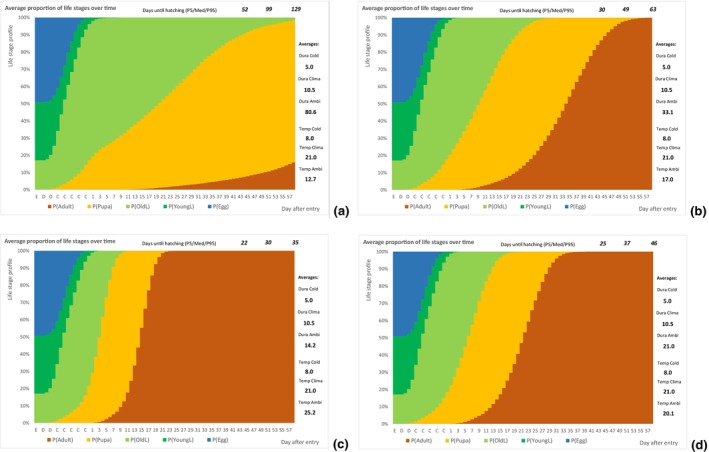
Following a request from the European Commission, the EFSA Panel on Plant Health performed a quantitative pest risk assessment to assess whether the import of cut roses provides a pathway for the introduction of Thaumatotibia leucotreta (Lepidoptera: Tortricidae) into the EU. The assessment was limited to the entry and establishment steps. A pathway model was used to assess how many T. leucotreta individuals would survive and emerge as adults from commercial or household wastes in an EU NUTS2 region climatically suitable in a specific season. This pathway model for entry consisted of three components: a cut roses distribution model, a T. leucotreta developmental model and a waste model. Four scenarios of timing from initial disposal of the cut roses until waste treatment (3, 7, 14 and 28 days) were considered. The estimated median number of adults escaping per year from imported cut roses in all the climatically suitable NUTS2 regions of the EU varied from 49,867 (90% uncertainty between 5,298 and 234,393) up to 143,689 (90% uncertainty between 21,126 and 401,458) for the 3- and 28-day scenarios. Assuming that, on average, a successful mating will happen for every 435 escaping moths, the estimated median number of T. leucotreta mated females per year from imported cut roses in all the climatically suitable NUTS2 regions of the EU would vary from 115 (90% uncertainty between 12 and 538) up to 330 (90% uncertainty between 49 and 923) for the 3- and 28-day scenarios. Due to the extreme polyphagia of T. leucotreta, host availability will not be a limiting factor for establishment. Climatic suitability assessment, using a physiologically based demographic modelling approach, identified the coastline extending from the northwest of the Iberian Peninsula through the Mediterranean as area suitable for establishment of T. leucotreta. This assessment indicates that cut roses provide a pathway for the introduction of T. leucotreta into the EU.

Keywords: Africa; Israel; climate suitability; false codling moth; pathway model; quantitative assessment; waste management.


Figures

Figure 1
Figure 1
Observed distribution of T. leucotreta. The map on the left (1) shows point observations. The map on the right (2) shows observations at the administrative unit level, for the areas where point observations were not found (Rossi et al., ; Appendix D)
Figure 2
Figure 2
Trade in cut roses in the EU (average of 2011–2020)
Figure 3
Figure 3
Trends in the EU of import of cut roses (2011–2020)
Figure 4
Figure 4
Distribution of cut roses imported by the EU (2011–2020)
Figure 5
Figure 5
Pathway of cut roses from import to waste (adapted from CBI, 2017)
Figure 6
Figure 6
Pathway of cut roses from import to waste as conceptualised for the rose distribution model
Figure 7
Figure 7
Visualisation of three phases of development after entry of cut roses. The blue axis at the bottom represents the time axis and three phases: (1) transport, (2) vase life, (3) post‐waste disposal. The red boxes on top represent the assumed temperature during each phase, while the blue boxes at the bottom represent the duration. The dotted line in the middle of the graph indicates how larvae on the roses progress through their life stages during the three stages of the cut roses pathway, from production to waste.
Figure 8
Figure 8
Pathway model for the waste management component (see text below, Table 8 and Appendix A for details)
Figure 9
Figure 9
Proportion vegetal waste treated as landfill, compost and incineration/anaerobic digestion in the European countries considered in the assessment
Figure 10
Figure 10
Proportion household waste treated as landfill, compost and incineration/anaerobic digestion in the European countries considered in the assessment
Figure 11
Figure 11
Maps of Africa with geographic distribution and relative abundance of T. leucotreta (average number of pupae during 2001–2010) as projected by the PBDM model shown for three scenarios of larval temperature‐dependent mortality displacement by 0°C (left), 4°C (middle) and 6°C (right). The maps in the bottom row additionally show T. leucotreta occurrence records (white circles with black outline). In scenario 0°C, the predicted abundance is in the range of [1, 696] (left), with 4°C according to Terblanche et al. (2017) the range is [1, 828] (middle), and with 6°C according to Uys (2014) a range of [1, 1,043] average pupae per year (right) was predicted for the whole continent. The colour legend uses the turbo colour palette (Mikhailov, 2020) to maximise graphical inference (Reda and Szafir, 2021). The absolute minimum and maximum values of the colour scaling are equal for the three maps (i.e. 1–1043) to ease comparisons. PBDM simulations are mapped and analysed using GRASS (GRASS Development Team, 2022), a multipurpose open‐source GIS (Neteler et al., 2012)
Figure 12
Figure 12
Total development time from egg to adult, L1 to adult and L2 to adult at different constant temperatures
Figure 13
Figure 13
Total development time from egg to adult and from L1 to adult at different constant temperatures
Figure 14
Figure 14
Development data applied in the model: (a) egg, (b) larval, (c) pupal and (d) adult stage. Experimental data on temperature dependence of development of the four life stages of T. leucotreta. Note that the data for adults are for adult longevity (i.e. the rate to final death) (Daiber 1979a,b,c, 1980)
Figure 15
Figure 15
Fecundity functions used in the model. The left panel is the age specific per capita oviposition profile at 24°C. The effects of temperature on oviposition (right panel) showing a thermal threshold of 10.3°C with a maximum of 24°C and rapidly declining at higher temperatures with threshold about 33°C (Daiber (1980), see also Section 3.1 on biology)
Figure 16
Figure 16
The biodemographic functions for larval and adult temperature‐dependent mortality (source: Myburgh, ; Daiber, ; Boardman et al., , ; Moore et al., 2016, 2022) with the 4°C displacement of larval mortality rates (see Terblanche et al., 2017) indicated as a solid line. Same mortality function was assumed for eggs and pupae (see, e.g. for other Tortricidae species: Milonas and Savopoulou‐Soultani, , Gutierrez et al., 2012)
Figure 17
Figure 17
Map of selected geographic locations for which T. leucotreta stage‐structured population dynamics are presented
Figure 18
Figure 18
Population dynamics of T. leucotreta eggs (blue), larvae (orange), pupae (green) and adults (yellow) at selected locations for years 2000–2010. Plots in subfigures (a) to (o) are ordered so that the associated locations fall on a North to South gradient (see map of locations in Figure 17)
Figure 19
Figure 19
NUTS 2 regions in EU and some neighbouring countries, and their climate suitability classes according to the potential establishment of T. leucotreta based on the average number of pupae/year as estimated by the PBDM model. 0 = less than 1 pupae/year, 1 = between 1 and 128 pupae/year, 2 = between 128 and 255 pupae/year, 3 = between 255 and 382 pupae/year and 4 = between 382 and 509 pupae/year. Note: Kosovo and Bosnia and Herzegovina are not covered in the layer of NUTS 2 boundaries by Eurostat (year 2021; https://ec.europa.eu/eurostat/web/gisco/geodata/reference-data/administrative-units-statistical-units/nuts)
Figure 20
Figure 20
Maps of the European NUTS2 regions that are climatically suitable for T. leucotreta establishment showing the results of the pathway model for T. leucotreta in cut roses expressed in total number (log‐scale) of T. leucotreta adults predicted to escape from the cut roses disposed per year and each NUTS2 region, under four different scenarios of timing from the initial disposal until the waste treatment of 3, 7, 14 and 28 days
Figure 21
Figure 21
Escape of T. leucotreta females with possible mating partner in a bunch of 10 cut roses (realistic clustering scenario) during an average season over 10 years (blue line = winter, green = spring, red = summer and yellow = autumn) in the climatically suitable NUTS2 regions in the EU with certainty curves for different scenarios between initial wasting and waste treatment: (a) 3 days, (b) 7 days, (c) 14 days and (d) 28 days
Figure 22
Figure 22
Escape of T. leucotreta females with possible mating partner in a bunch of 10 cut roses (realistic clustering scenario) during an average season over 10 years (blue line = winter, green = spring, red = summer and yellow = autumn) in Sicily (Italy) with certainty curves for different scenarios between initial wasting and waste treatment: (a) 3 days, (b) 7 days, (c) 14 days and (d) 28 days
Figure 23
Figure 23
Climate suitability map of T. leucotreta for Europe and Africa, based on the Köppen–Geiger climate classification. Red dots indicate point observations of the pest (coordinates). Climates that are not present in the EU are not mapped. The legend shows the list of Köppen–Geiger climates occurring in the locations of observation
Figure 24
Figure 24
Climate suitability map of T. leucotreta for Eastern Africa, and South Africa, based on the Köppen–Geiger climate classification. Red dots indicate point observations of the pest (with coordinates). Climates not present in EU are not mapped. The legend shows the list of Köppen–Geiger climates occurring in the locations of observation
Figure 25
Figure 25
Maps showing average T. leucotreta pupal density in Europe, the Middle East and Africa for the period 2000–2010 (average number of pupae per year, as projected by the PBDM). Columns of maps show the effect of larval heat tolerance assuming displaced heat‐stress mortality: left column without [data range (1, 696]), middle column with 4°C (Terblanche et al., 2017) [data range (1, 828)] and right column with 6°C (Uys, 2014) [data range (1, 1043)] displacement of larvae mortality relative to adults (heat tolerance of larvae increases left to right). The top versus bottom rows of maps differ only in that the bottom maps have T. leucotreta occurrence records superimposed (white circles with black outline). Note the model predicts infested areas from Gabon south to Angola with no records of T. leucotreta. The colour legend uses the turbo colour palette (Mikhailov, 2020) to maximise graphical inference (Reda and Szafir, 2021) and extends to the absolute minimum and maximum values across the three maps (i.e. 1–1043) to facilitate comparison between maps.
Figure 26
Figure 26
The predicted level of T. leucotreta establishment following entry into EU MS and the Mediterranean Basin (average number of pupae per year in the period 2001–2010, as projected by the PBDM model). The three columns of maps show the effect of different levels of heat tolerance. Left without [data range (1, 362)], middle with 4°C [data range (1, 467)] and right with 6°C [data range (1, 509)] displacement of larvae mortality relative to adults (cf. Figure 16). The colour legend uses the turbo colour rule (Mikhailov, 2020) to maximise graphical inference (Reda and Szafir, 2021) and extends to the absolute minimum and maximum values for Europe and the Mediterranean Basin across the three maps (i.e. 1–509)
Figure 27
Figure 27
Climatic suitability map (with continued data) for the potential establishment of T. leucotreta in Europe, according to the species distribution model developed for Australia by Li et al. (2022). Personal communication by courtesy of Xingyu Li and Simon McKirdy, received by email on 13 January 2023
Figure A.1
Figure A.1
Average seasonal number of female T. leucotreta with possible mating partner in a bunch of 10 roses (Reasonable clustering scenario) per season (blue line = winter, green = spring, red = summer and yellow = autumn) in the EU climatically suitable area with certainty curves for different scenarios between initial wasting and waste treatment: (a) 3 days, (b) 7 days, (c) 14 days and (d) 28 days
Figure A.2
Figure A.2
Average seasonal number of female T. leucotreta with possible mating partner in a bunch of 10 roses (Reasonable clustering scenario) per season (blue line = winter, green = spring, red = summer and yellow = autumn) in Rhône‐Alpes (France) with certainty curves for different scenarios between initial wasting and waste treatment: (a) 3 days, (b) 7 days, (c) 14 days and (d) 28 days
Figure A.3
Figure A.3
Average seasonal number of female T. leucotreta with possible mating partner in a bunch of 10 roses (Reasonable clustering scenario) per season (blue line = winter, green = spring, red = summer and yellow = autumn) in Andalusia (Spain) with certainty curves for different scenarios between initial wasting and waste treatment: (a) 3 days, (b) 7 days, (c) 14 days and (d) 28 days
Figure A.4
Figure A.4
Average seasonal number of female T. leucotreta with possible mating partner in a bunch of 10 roses (Reasonable clustering scenario) per season (blue line = winter, green = spring, red = summer and yellow = autumn) in Sicily (Italy) with certainty curves for different scenarios between initial wasting and waste treatment: (a) 3 days, (b) 7 days, (c) 14 days and (d) 28 days
Figure A.5
Figure A.5
Maps of the European NUTS2 regions that are climatically suitable for T. leucotreta establishment showing the estimated average numbers of T. leucotreta adult escapes standardised to an area of 3.14 km2 over 10 days in the residential area of each NUTS2 region (log‐scale). Results are presented for the four different scenarios of timing from the initial disposal until the waste treatment of 3, 7, 14 and 28 days
Figure A.6
Figure A.6
Estimated number of T. leucotreta adults escaping from disposed infested cut roses in a 3.14‐km2 circle per 10 days in the residential areas of Corsica (France) with distribution functions for different scenarios between initial wasting and waste treatment: (a) 3 days, (b) 7 days, (c) 14 days and (d) 28 days
Figure A.7
Figure A.7
Average relative export of cut roses from African countries with reported presence of Thaumatotibia leucotreta and from Israel to EU (Eurostat, EU trade since 1988 by HS2‐4‐6 and CN8 [DS‐645593], CN 06031100, online, accessed on 4 October 2022)
Figure A.8
Figure A.8
NUTS 2 regions in EU and some neighbouring countries, and their climate suitability classes according to the potential establishment of T. leucotreta based on the average number of pupae/year as estimated by the physiologically based demographic model (PBDM, see Appendix B). 0 = less than 1 pupae/year, 1 = between 1 and 128 pupae/year, 2 = between 128 and 255 pupae/year, 3 = between 255 and 382 pupae/year and 4 = between 382 and 509 pupae/year. Note: Kosovo and Bosnia and Herzegovina are not covered in the layer of NUTS 2 boundaries by Eurostat (year 2021; https://ec.europa.eu/eurostat/web/gisco/geodata/reference-data/administrative-units-statistical-units/nuts)
Figure A.9
Figure A.9
Density function showing the uncertainty distribution of the proportion of cut roses rejected in grading step directly after import into the EU
Figure A.10
Figure A.10
Simulation of the profile of infestation of cut roses at the EU border with immature life stages of FCM (in a triangular diagram: Each corner represents a pure infestation with only one life stage)
Figure A.11
Figure A.11
Average proportion of different life stages (blue = eggs, dark green = L1–L2, light green = L3–L5, yellow = pupae, red = adults) of Thaumatotibia leucotreta by day (horizontal axis) starting with entering the EU (E), distribution in cooled conditions (D), consumption in climatised environment (C) and days after wasting by the consumer. Results by the developmental model are given for NUTS2 regions in climate suitability class 1 for winter (a), spring (b), summer (c) and autumn (d)
Figure A.12
Figure A.12
Average proportion of different life stages (blue = eggs, dark green = L1–L2, light green = L3–L5, yellow = pupae, red = adults) of Thaumatotibia leucotreta by day (horizontal axis) starting with entering the EU (E), distribution in cooled conditions (D), consumption in climatised environment (C) and days after wasting by the consumer. Results by the developmental model are given for NUTS2 regions in climate suitability class 2 for winter (a), spring (b), summer (c) and autumn (d)
Figure A.13
Figure A.13
Average proportion of different life stages (blue = eggs, dark green = L1–L2, light green = L3–L5, yellow = pupae, red = adults) of Thaumatotibia leucotreta by day (horizontal axis) starting with entering the EU (E), distribution in cooled conditions (D), consumption in climatised environment (C) and days after wasting by the consumer. Results by the developmental model are given for NUTS2 regions in climate suitability class 3 for winter (a), spring (b), summer (c) and autumn (d)
Figure A.14
Figure A.14
Average proportion of different life stages (blue = eggs, dark green = L1–L2, light green = L3–L5, yellow = pupae, red = adults) of Thaumatotibia leucotreta by day (horizontal axis) starting with entering the EU (E), distribution in cooled conditions (D), consumption in climatised environment (C) and days after wasting by the consumer. Results by the developmental model are given for NUTS2 regions in climate suitability class 4 for winter (a), spring (b), summer (c) and autumn (d)
Figure A.15
Figure A.15
Density function showing the uncertainty distribution of the mortality during natural development of Thaumatotibia leucotreta

References

    1. Abkin MH and Wolf C, 1976. Computer library for agricultural systems simulation. Distributed delay routines: DEL, DELS, DELF, DELLF, DELVF, DELLVF. Department of Agricultural Economics, Michigan State University. Available online: https://pdf.usaid.gov/pdf_docs/pnaae013.pdf
    1. Adom M and Fening K, 2021. Pest status, bio‐ecology and management of the false codling moth, Thaumatotibia leucotreta (Meyrick) (Lepidoptera: Tortricidae) and its implication for international trade. Bulletin of Entomological Research, 111, 17–30. - PubMed
    1. Ali‐Ahmed D, Soltani N, Kellouche A and Mazouzi F, 2007. Effects of the soil texture and the burying depth of the larvae on some biological parameters of Ceratitis capitata (Diptera: Trypetidae). African Journal of Agricultural Research, 2, 105–111.
    1. Baker RHA, 2002. Predicting the limits to the potential distribution of alien crop pests. In: Hallman GJ and Schwalbe CP (eds.), Invasive Arthropods in Agriculture. Problems and solutions, pp. 207–241. Enfield, USA, Science Publishers Inc. 450 pp.
    1. Barker B and Coop C, 2019. False Codling Moth ‐ Thaumatotibia leucotreta (Lepidoptera: Tortricidae) ‐Phenology/Degree‐Day and Climate Suitability Model Analysis for USPEST.ORG. ‐ Prepared for USDA APHIS PPQ Version 1.0. 2 December 2019, 13 pp. Available online: https://uspest.org/CAPS/Thaumatotibia_leucotreta_white_paper.pdf