. 2023 Nov;10(33):e2302134.
doi: 10.1002/advs.202302134. Epub 2023 Oct 23.

Anchoring Microbubbles on Cerebrovascular Endothelium as a New Strategy Enabling Low-Energy Ultrasound-Assisted Delivery of Varisized Agents Across Blood-Brain Barrier

Affiliations

Anchoring Microbubbles on Cerebrovascular Endothelium as a New Strategy Enabling Low-Energy Ultrasound-Assisted Delivery of Varisized Agents Across Blood-Brain Barrier

Bo Li et al. Adv Sci (Weinh). 2023 Nov.

Abstract

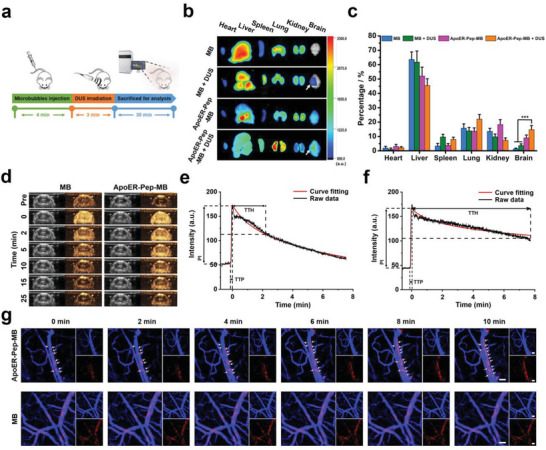
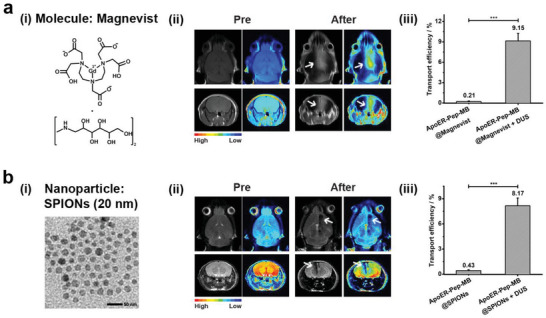
The protective blood-brain barrier (BBB) prevents most therapeutic agents from entering the brain. Currently, focused ultrasound (FUS) is mostly employed to create microbubbles that induce a cavitation effect to open the BBB. However, microbubbles pass quickly through brain microvessels, substantially limiting the cavitation effect. Here, we constructed a novel perfluoropropane-loaded microbubble, termed ApoER-Pep-MB, which possessed a siloxane bonds-crosslinked surface to increase the microbubble stability against turbulence in blood circulation and was decorated with binding peptide for apolipoprotein E receptor (ApoER-Pep). The microbubble with tailor-made micron size (2 µm) and negative surface charge (-30 mV) performed ApoER-mediated binding rather than internalization into brain capillary endothelial cells. Consequently, the microbubble accumulated on the brain microvessels, based on which even a low-energy ultrasound with less safety risk than FUS, herein diagnostic ultrasound (DUS), could create a strong cavitation effect to open the BBB. Evans Blue and immunofluorescence staining studies demonstrated that the DUS-triggered cavitation effect not only temporarily opened the BBB for 2 h but also caused negligible damage to the brain tissue. Therefore, various agents, ranging from small molecules to nanoscale objects, can be efficiently delivered to target regions of the brain, offering tremendous opportunities for the treatment of brain diseases.

Keywords: binding microbubbles; blood-brain barrier; brain-targeted delivery; cavitation effect; diagnostic ultrasound.


Conflict of interest statement

The authors declare no conflict of interest.

Figures

Scheme 1
Scheme 1
Schematic illustration of opening the BBB with ApoER‐Pep‐MB under DUS irradiation to transport varisized agents into the brain tissue.
Figure 1
Figure 1
Characterization of bindable ApoER‐Pep‐MB and non‐bindable MB. a) TEM images of ApoER‐Pep‐MB and MB, bright‐field and fluorescence images of DOX‐loaded ApoER‐Pep‐MB using CLSM. b) FTIR spectrum of the ApoER‐Pep‐MB powder. Si‐O‐Si stretching band was observed at 1100 cm−1. c) Photographs showing gas‐free (left) and C3H8 gas‐filled (right) states of ApoER‐Pep‐MB. d) Particle sizes and e) zeta potentials for ApoER‐Pep‐MB and MB, data are expressed as mean ± SD (n = 3). f) CEUS images of ApoER‐Pep‐MB and MB solutions acquired at different times at room temperature. g) Quantitative analysis of ultrasonic signal intensities in f) over time using Image J software.
Figure 2
Figure 2
In vivo brain microvessel binding of microbubbles. a) Schematic of the study design for in vivo fluorescence imaging in mice. b) Ex vivo fluorescence imaging of major organs from mice tail vein injected with ICG‐loaded microbubbles (ApoER‐Pep‐MB or MB) with or without head‐localized DUS irradiation (3 MHz, 22.5 cycles, 3 min). White arrows indicate DUS‐irradiated areas. c) Relative fluorescence intensities of major organs from (b), data are expressed as mean ± SD (n = 3), ***P < 0.001 versus the MB group or the MB + DUS group. d) Brain CEUS images of mice at different time points after i.v. injection of MB or ApoER‐Pep‐MB. Left: gray scale; right: harmonic in each pair of images. e,f) Plotting of signal intensities from CEUS imaging against time after tail vein injection of (e) MB and (f) ApoER‐Pep‐MB, where TTP, PI, and TTH stand for time to peak, peak intensity, and time from peak to half, respectively. g) Images showing gradual binding of ApoER‐Pep‐MB or MB to microvessels of mouse brain (scale bar: 40 µm; blue: FluoSpheres carboxylate‐modified microspheres to mark the blood vessel; red: microbubbles labeled by DiI). Arrows indicate enhanced signals from ApoER‐Pep‐MB.
Figure 3
Figure 3
BBB opening and recovery. a) Schematic of study design for opening the BBB. b) Distribution of EB dye extravasation in the convex and concave side views of mouse brains after tail vein injection of ApoER‐Pep‐MB, MB, SonoVue,or PBS, followed by head‐localized DUS exposure. c) EB extravasation in the mouse brain at different time points after ApoER‐Pep‐MB + DUS treatment. d) Quantitative analysis of EB extravasation in mouse brains based on (b), data are expressed as mean ± SD (n = 3), ***P < 0.001 versus the MB + DUS group or the SonoVue + DUS group. e) Quantitative analysis of EB extravasation in mouse brains based on (c), data are expressed as mean ± SD (n = 3). f) EB extravasation‐indicated BBB opening directed by the DUS transducer from the surface (top) and coronal section (bottom) views of mouse brains. g) Expression levels of Occludin and ZO‐1 determined by western blotting in the presence or absence of DUS irradiation after ApoER‐Pep‐MB injection. h) Co‐immunoprecipitation (Co‐IP) of Occludin and ZO‐1 in the irradiated (DUS+) and non‐irradiated (DUS‐) brain regions of mice after injection of ApoER‐Pep‐MB. i) TEM images of brain capillaries in irradiated (right) and non‐irradiated (left) brain regions of mice after ApoER‐Pep‐MB injection. En, brain microvascular endothelial cells. Red circles indicate dense or opened tight junctions.
Figure 4
Figure 4
Biosafety assessment in vivo. a) Images showing Nissl, H&E, and TUNEL staining of mouse brain tissues harvested 6 h, 24 h, and 2 w after ApoER‐Pep‐MB + DUS treatment. Black arrows indicate slight extravasation of erythrocytes, and white arrows indicate apoptotic cells in small areas. b) Expressions of Iba1 in microglia and GFAP in astrocytes in mouse brain tissues harvested 6 h, 24 h, and 2 w after ApoER‐Pep‐MB + DUS treatment. White arrows indicate mild activation of microglial cells.
Figure 5
Figure 5
Delivery of varisized therapeutic agents into the brain via DUS‐triggered cavitation effect of ApoER‐Pep‐MB. a) Delivery of ICG (i) into the mouse brain monitored by in vivo PA imaging (iii), numbers in green color mark the left and right hemispheres while dashed lines in green color mark the three blood vessels shown as red lines in (ii). White dashed lines indicate areas with DUS irradiation. (iv‐v) Quantitative analysis of normalized PA signal intensities in the right (iv) and left (v) hemispheres compared to mice without ApoER‐Pep‐MB@ICG (Pre) injection, data are expressed as mean ± SD (n = 3), ***P < 0.001. b) Delivery of IgG antibody (i) into the brain revealed by CLSM imaging (ii) of brain tissue sections in the contralateral (left) or DUS (right) side (scale bar: 25 µm; blue: nuclei stained with DAPI; green: blood vessels stained using FITC‐lectin; red: IgG labeled by AF555), and quantitative analysis (iii) of AF555 fluorescence intensities in points from blood vessel to deep parenchyma indicated by white dashed arrows (ii). c) Delivery of 130 nm Abraxane (i) into brain revealed by CLSM imaging (ii) of brain tissue sections in the contralateral (left) or DUS‐irradiated (right) side (scale bar: 25 µm; blue: nuclei stained with DAPI; green: blood vessels stained with FITC‐lectin; pink: Albumin Bound labeled by Cy3), and quantitative analysis (iii) of Cy3 fluorescence intensities in points from blood vessel to deep parenchyma indicated by white dashed arrows (ii).
Figure 6
Figure 6
Delivery of varisized MRI contrast agents into the brain via DUS‐triggered cavitation effect of ApoER‐Pep‐MB. a) Delivery of Magnevist (i) into the mouse brain monitored by T1‐weighted MR imaging (ii) from the transverse (top panel) and the coronal (bottom panel) sectional views with white arrows indicating T1 signal‐enhanced areas. (iii) The percentage of Gd accumulated in the brain after tail‐vein injection of ApoER‐Pep‐MB@Magnevist into mice with or without head‐localized DUS irradiation, as measured by ICP‐AES (n = 3, ***P < 0.001). b) Delivery of water‐soluble 20 nm SPIONs (TEM image in (i)) into the mouse brain monitored by T2‐weighted MR imaging (ii) from the transverse (top panel) and the coronal (bottom panel) sectional views with white arrows indicating T2 signal‐decreased area, and (iii) percentage of Fe accumulated in the brain after tail‐vein injection of ApoER‐Pep‐MB@SPIONs into mice with or without head‐localized DUS irradiation measured by AAS (n = 3, ***P < 0.001).

References

    1. Pardridge W. M., Drug Discovery Today 2007, 12, 54. - PubMed
    1. Kircher M. F., De La Zerda A., Jokerst J. V., Zavaleta C. L., Kempen P. J., Mittra E., Pitter K., Huang R., Campos C., Habte F., Nat. Med. 2012, 18, 829. - PMC - PubMed
    1. Sun S., Lei Y., Li Q., Wu Y., Zhang L., Mu P.‐P., Ji G.‐Q., Tang C.‐X., Wang Y.‐Q., Gao J., OncoTargets Ther. 2017, 8, 74019. - PMC - PubMed
    1. Querzfurth H., N. Engl. J. Med. 2010, 362, 329.
    1. a) Kovacs Z. I., Kim S., Jikaria N., Qureshi F., Frank J. A., Proc. Natl. Acad. Sci. USA 2016, 114, E75;. - PMC - PubMed
    2. b) Zhao B., Chen Y., Liu J., Zhang L., Wang J., Yang Y., Lv Q., Xie M., OncoTargets Ther. 2018, 9, 4897. - PMC - PubMed

Publication types

LinkOut - more resources