. 2023 Dec;10(36):e2304009.
doi: 10.1002/advs.202304009. Epub 2023 Oct 23.

Highly-Specific Single-Stranded Oligonucleotides and Functional Nanoprobes for Clinical Determination of Chlamydia Trachomatis and Neisseria Gonorrhoeae Infections

Affiliations

Highly-Specific Single-Stranded Oligonucleotides and Functional Nanoprobes for Clinical Determination of Chlamydia Trachomatis and Neisseria Gonorrhoeae Infections

Ketan Dighe et al. Adv Sci (Weinh). 2023 Dec.

Abstract

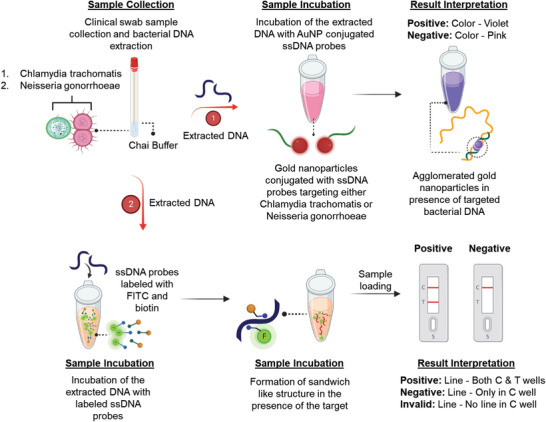
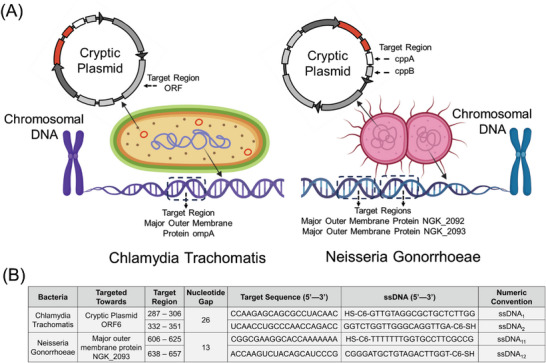
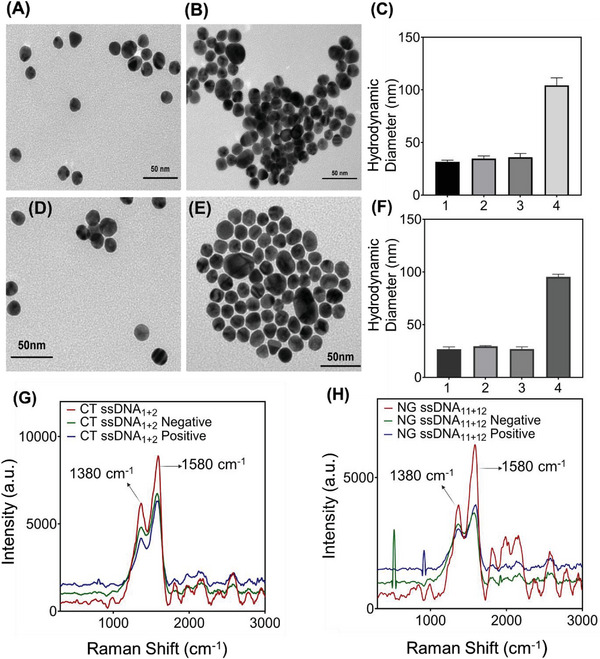
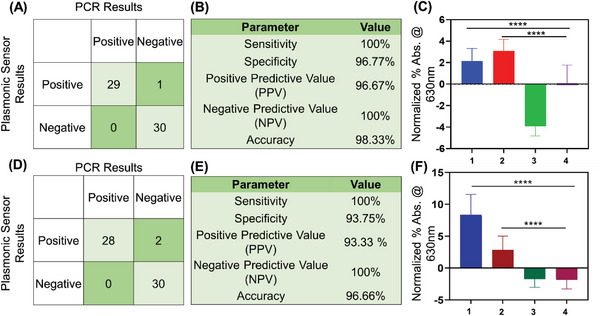
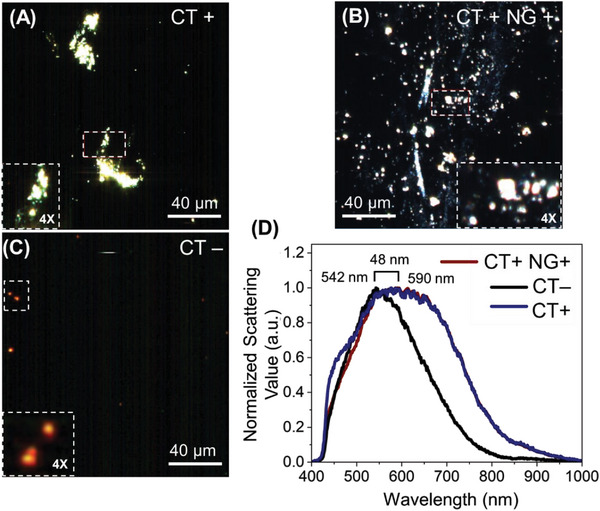
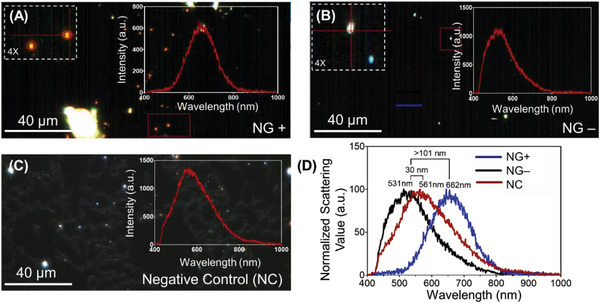
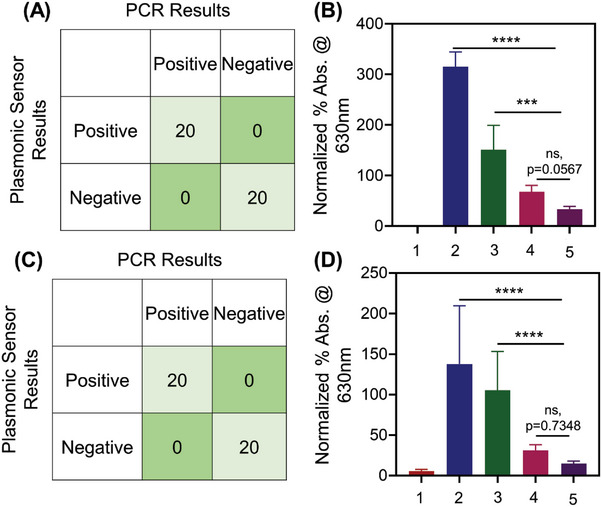
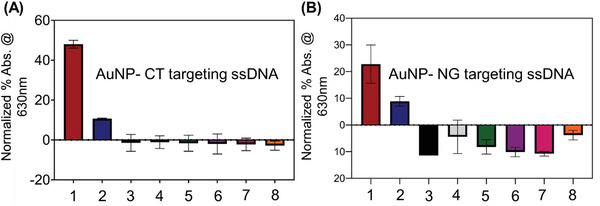
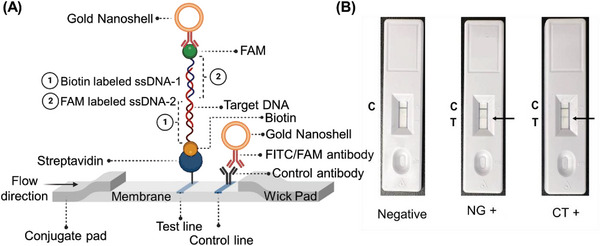
Early detection of Chlamydia trachomatis (CT) and Neisseria gonorrhoeae (NG) is the key to controlling the spread of these bacterial infections. An important step in developing biosensors involves identifying reliable sensing probes against specific genetic targets for CT and NG. Here, the authors have designed single-stranded oligonucleotides (ssDNAs) targeting mutually conserved genetic regions of cryptic plasmid and chromosomal DNA of both CT and NG. The 5'- and 3'- ends of these ssDNAs are differentially functionalized with thiol groups and coupled with gold nanoparticles (AuNP) to develop absorbance-based assay. The AuNPs agglomerate selectively in the presence of its target DNA sequence and demonstrate a change in their surface plasmon resonance. The optimized assay is then used to detect both CT and NG DNA extracted from 60 anonymized clinical samples with a clinical sensitivity of ∼100%. The limit of detection of the assays are found to be 7 and 5 copies/µL for CT and NG respectively. Furthermore, it can successfully detect the DNA levels of these two bacteria without the need for DNA extraction and via a lateral flow-based platform. These assays thus hold the potential to be employed in clinics for rapid and efficient monitoring of sexually transmitted infections.

Keywords: Chlamydia trachomatis; Neisseria gonorrhoeae; gold nanoparticles; lateral flow assay; point-of-care; single-stranded oligonucleotides.


Conflict of interest statement

Prof. Dipanjan Pan is the founder/cofounder of three University based start‐ups. None of these entities, however, supported this work.

Figures

Figure 1
Figure 1
Schematic representation of two approaches based on changes in absorbance and lateral flow methods, utilizing novel oligonucleotide probes targeted toward Chlamydia trachomatis and Neisseria gonorrhoeae, for the clinical determination of chlamydia and gonorrhea. The addition of genetic material (bacterial DNA from either Chlamydia trachomatis or Neisseria gonorrhoeae) will result in a distinct change in absorbance. In the lateral flow assay, the presence of the target DNA will be indicated by a prominent test (T) line along with a control (C) line.
Figure 2
Figure 2
(A) Schematic representation of identified genetic targets in Chlamydia trachomatis and Neisseria gonorrhoeae. (B) Identified oligonucleotide sequences. ssDNA sequences identified toward the cryptic plasmid (ORF6) of Chlamydia trachomatis; ssDNA sequences identified toward the major outer membrane protein (NGK_2093) of Neisseria gonorrhoeae. The ssDNA sequences were subsequently modified with thiol groups (C6‐SH or HS‐C6) at either 5′ or 3′ end in order to conjugate to gold nanoparticles (AuNP).
Figure 3
Figure 3
Transmission electron microscopy (TEM), Dynamic Light Scattering (DLS) and Raman spectroscopy data for CT targeted AuNP‐ssDNAs (A‐C &G) and NG targeted AuNP‐ssDNAs (D‐F &H). (A) ssDNA‐capped AuNPs targeted toward CT are individually dispersed with no visible aggregation in absence of CT DNA. (B) Visible aggregation of ssDNA‐capped AuNPs in presence of CT genomic DNA (0.5 ng µL−1). (C) Comparative changes in average hydrodynamic diameter of the ssDNA capped AuNP targeted toward CT (1. AuNP 2. ssDNA capped AuNP targeted toward CT, 3. ssDNA capped AuNP targeted toward CT in presence of NG and 4. ssDNA capped AuNP targeted toward CT in presence of CT). Data are presented as mean ± SD. Error bar indicates the measurements of the hydrodynamic diameter from three (n = 3) such independent experiments. (D) ssDNA‐capped AuNPs targeted toward NG are individually dispersed with no visible aggregation in absence of NG DNA. (E) Visible aggregation of ssDNA‐capped AuNPs in presence of NG genomic DNA (0.5 ng µL−1). (F) Comparative changes in average hydrodynamic diameter of the ssDNA capped AuNP targeted toward NG (1. AuNP 2. ssDNA capped AuNP targeted toward NG, 3. ssDNA capped AuNP targeted toward NG in presence of CT and 4. ssDNA capped AuNP targeted toward NG in presence of NG). Data are presented as mean ± SD. Error bar indicates the measurements of the hydrodynamic diameter from three (n = 3) such independent experiments. (G) Raman spectra for CT targeted AuNP‐ssDNAs in presence of CT genomic DNA (0.5 ng µL−1). (H) Raman spectra for NG targeted AuNP‐ssDNAs in presence of NG genomic DNA (0.5 ng µL−1).
Figure 4
Figure 4
Chlamydia and Gonorrhea detection from sixty (n = 60) deidentified clinical samples. (A) Confusion matrix obtained from the demonstrated CT DNA targeting ssDNA conjugated AuNP based test. Results were benchmarked with the gold standard technique qPCR for the sixty (n = 60) deidentified clinical samples. (B) CT DNA targeting ssDNA conjugated AuNP based test parameters indicating the sensitivity, specificity, PPV, NPV and accuracy (n = 60). (C) Graphical representation of normalized percentage (%) absorbance change at 630 nm for the CT DNA targeted ssDNA conjugated AuNP based test. 1 is CT+ sample (n = 15); 2 is both CT+NG+ sample (n = 15); 3 is NG+ sample (n = 15) and 4 is both CT‐NG‐ samples(n = 15). Data are presented as mean ± SD. The one‐way ANOVA showed that the assay response was significantly different between positives and negatives. ****p‐value <0.0001 (D) Confusion matrix obtained from the NG DNA targeting ssDNA conjugated AuNP based test. Results were benchmarked with the gold standard technique qPCR from sixty (n = 60) deidentified clinical samples. (E) NG DNA targeted ssDNA conjugated AuNP based test parameters indicating the sensitivity, specificity, PPV, NPV and accuracy (n = 60). (F) Graphical representation of normalized percentage (%) absorbance change at 630 nm for NG DNA targeting ssDNA conjugated AuNP based test. 1 is NG+ sample (n = 15); 2 is both CT+NG+ sample (n = 15); 3 is CT+ sample (n = 15) and 4 is both CT‐NG‐ samples (n = 15). The one‐way ANOVA showed that the assay response was significantly different between positives and negatives. ****p‐value <0.0001.
Figure 5
Figure 5
The hyperspectral imaging of the CT targeted ssDNA conjugated AuNPs in the presence of (A) CT+ (Ct = 25), (B) CT+ and NG+ (Ct = 30), and (C) CT‐ samples. (D) The hyperspectral data collected as a response to CT+, CT+ and NG+, and CT‐ samples from multiple positions of the image has been represented. The brackets show the distance between the peak maxima between the spectra obtained before and after the addition of the target DNA. The experiments were performed with experimental repeats of n = 5.
Figure 6
Figure 6
The hyperspectral imaging of the ssDNA‐AuNPs targeted toward NG in the presence of (A) NG+ (Ct = 27), (B) CT+ and NG‐ (Ct = 32) and (C) NG‐ samples. (D) The hyperspectral signature was collected as a response to NG+, CT+ and NG‐, and NG‐ samples from multiple positions of the image has been represented. The brackets show the distance between the peak maxima between the spectra obtained before and after the addition of the target DNA. The experiments were performed with experimental repeats of n = 5.
Figure 7
Figure 7
Chlamydia and Gonorrhea detection from forty (n = 40) deidentified clinical samples using CHAI buffer without any added purification steps. (A) Confusion matrix obtained from the studied ssDNA‐AuNPs targeting CT DNA. Results from forty (n = 40) deidentified clinical samples were validated with the gold standard technique qPCR. (B) Graphical representation of normalized percentage (%) absorbance change at 630 nm with CT targeted ssDNA‐AuNPs for 1. Control (water sample); 2. CT positive sample (n = 10); 3. both CT positive and NG positive sample (n = 10); 4. NG positive sample (n = 10) and 5. both CT and NG negative sample (n = 10). Data are presented as mean ± SD. The one‐way ANOVA showed that the assay response was significantly different between positives and negatives. ****p‐value <0.0001, ***p = 0.001, ns; p = 0.0567. (C) Confusion matrix obtained from the studied ssDNA‐AuNPs targeting NG DNA. Results from forty (n = 40) deidentified clinical samples were validated with the gold standard qPCR. (D) Graphical representation of normalized percentage (%) absorbance change at 630 nm with NG targeted ssDNA‐AuNPs for 1. Control (water sample), 2. NG positive sample (n = 10), 3. both CT positive and NG positive sample (n = 10), 4. CT positive sample (n = 10) and 5. both CT and NG negative sample (n = 10). Data are presented as mean ± SD. The one‐way ANOVA showed that the assay response was significantly different between positives and negatives. ****p‐value <0.0001, ns; p = 0.7348.
Figure 8
Figure 8
(A) Specificity study of CT targeting ssDNA‐AuNPs in presence of 1. Chlamydia trachomatis (Ct = 25), 2. Chlamydia trachomatis and Neisseria gonorrhoeae (Ct = 30), 3. Staphylococcus aureus, 4. Acinetobacter baumannii, 5. Escherichia coli, 6. Bacillus subtilis, 7. Streptococcus mutans and 8. negative control sample (water). (B) Specificity study of NG targeting ssDNA‐AuNPs in presence of 1. Neisseria gonorrhoeae (Ct = 27), 2. Chlamydia trachomatis and Neisseria gonorrhoeae (Ct = 32), 3. Staphylococcus aureus, 4. Acinetobacter baumannii, 5. Escherichia coli, 6. Bacillus subtilis, 7. Streptococcus mutans and 8. negative control sample (water). Data are presented as mean ± SD. Error bar indicates the measurements from three (n = 3) such independent experiments.
Figure 9
Figure 9
(A) Schematic representation of the operating principle of the lateral flow assay. The test line appears only in presence of the target either CT or NG bacterial DNA. The test line immobilized with streptavidin captures the biotinylated ssDNAs and the FAM conjugated ssDNAs capture the anti‐FAM coated gold nanoshells. (B) Representative lateral flow strips tested with negative sample (water), NG positive (Ct = 17) and CT positive samples (Ct = 24).

Similar articles

Cited by

References

    1. Wiesenfeld H. C., N. Engl. J. Med. 2017, 376, 765. - PubMed
    1. Weinstock H. S., Kreisel K. M., Spicknall I. H., Chesson H. W., Miller W. C., Sex. Transm. Dis. 2021, 48, 207. - PubMed
    1. Taylor M. M., Wi T., Gerbase A., Thwin S. S., Gottlieb S., Babovic M. T., Low‐Beer D., Alonso M., Mello M. B., Ishikawa N., Brink A., Hermez J., Sabry A., Sanni S., Ouedraogo L., Rewari B., Sharma M., Seguy N., Vovc E., Askew I., Doherty M., Broutet N., PLoS One 2022, 17, e0263550. - PMC - PubMed
    1. Rowley J., Vander Hoorn S., Korenromp E., Low N., Unemo M., Abu‐Raddad L. J., Chico R. M., Smolak A., Newman L., Gottlieb S., Thwin S. S., Broutet N., Taylor M. M., Bull W. H O. 2019, 97, 548. - PMC - PubMed
    1. Wynn A., Bristow C. C., Cristillo A. D., Murphy S. M., Van Den Broek N., Muzny C., Kallapur S., Cohen C., Ingalls R. R., Wiesenfeld H., Litch J. A., Morris S. R., Klausner J. D., Sex. Transm. Dis. 2019, 47, 5. - PMC - PubMed

Publication types

LinkOut - more resources