. 2023 Dec;10(35):e2305080.
doi: 10.1002/advs.202305080. Epub 2023 Oct 23.

Single-Cell RNA-Sequencing Provides Insight into Skeletal Muscle Evolution during the Selection of Muscle Characteristics

Affiliations

Single-Cell RNA-Sequencing Provides Insight into Skeletal Muscle Evolution during the Selection of Muscle Characteristics

Doudou Xu et al. Adv Sci (Weinh). 2023 Dec.

Abstract

Skeletal muscle comprises a large, heterogeneous assortment of cell populations that interact to maintain muscle homeostasis, but little is known about the mechanism that controls myogenic development in response to artificial selection. Different pig (Sus scrofa) breeds exhibit distinct muscle phenotypes resulting from domestication and selective breeding. Using unbiased single-cell transcriptomic sequencing analysis (scRNA-seq), the impact of artificial selection on cell profiles is investigated in neonatal skeletal muscle of pigs. This work provides panoramic muscle-resident cell profiles and identifies novel and breed-specific cells, mapping them on pseudotime trajectories. Artificial selection has elicited significant changes in muscle-resident cell profiles, while conserving signs of generational environmental challenges. These results suggest that fibro-adipogenic progenitors serve as a cellular interaction hub and that specific transcription factors identified here may serve as candidate target regulons for the pursuit of a specific muscle phenotype. Furthermore, a cross-species comparison of humans, mice, and pigs illustrates the conservation and divergence of mammalian muscle ontology. The findings of this study reveal shifts in cellular heterogeneity, novel cell subpopulations, and their interactions that may greatly facilitate the understanding of the mechanism underlying divergent muscle phenotypes arising from artificial selection.

Keywords: fibro-adipogenic progenitors; muscle characteristics; neonatal myogenesis; pigs, single-cell RNA-sequencing.


Conflict of interest statement

The authors declare no conflict of interest.

Figures

Figure 1
Figure 1
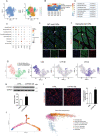
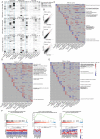
Single‐cell transcriptional profiling of wild boars, Laiwu pigs, and Duroc pigs skeletal muscle cells. A) t‐distributed stochastic neighbor embedding (t‐SNE) visualization of 60040 cells grouped by expression similarity and colored by cluster, breed, and donor. B) Distribution of skeletal muscle cell types in each breed (left) and inter‐breed heterogeneity revealed by plotting per‐breed major cell type distribution (right). C) Hierarchical clustering of major cell populations groups the cells by cell type rather than by organism. Cell‐type labels are as in Figure 1A; cell types were clustered using gene expression correlation. D) Heatmap showing gene orthologs similarly enriched within wild boars, Laiwu pigs, and Duroc pigs skeletal muscle cell types. dc: Duroc pigs, lw: Laiwu pigs, wb: wild boars.
Figure 2
Figure 2
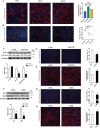
Characterization of the FAPs identified novel subpopulations. A) FAPs from wild boar skeletal muscle were selected and re‐analyzed. tSNE plot colored by donor (left) and serut subset (right). B) Comparison of observed wild boar muscle FAPs subsets to the FAPs previously reported.[ 9 ] C) Summary of the annotation of FAPs subpopulations. D) Violin plots showing the expression levels and distribution of representative marker genes. E‐F) Representative confocal images of skeletal muscle stained for FAP marker PDGFRa (red), DAPI (blue), and MT‐rich FAPs marker COX1 (Green) in (E) and Myocyte‐like FAPs marker ACTA1 (green) in (F). White arrowheads denote FAPs that are positive for the marker (scale, 50 µm). Yellow arrowheads mark FAPs that are negative for expression of the marker. G) CD142‐like FAPs from Laiwu pigs were selected and re‐analyzed. t‐SNE plot colored by CD142‐like FAPs subsets (left) and showing the expression levels of markers for CD9+ CD142‐like FAPs (CD9), CYP1B1+ CD142‐like FAPs (CYP1B1) and MYOC+ CD142‐like FAPs (MYOC). H) The immunoblots presented here show the protein level of CYP1B1 in adipogenic precursors transfected with CYP1B1‐plasmid or empty vector 24 h in growth medium (left). Relative expression level was calculated (right). β‐tubulin was used as the internal control. Data were presented as means ± SEM (n = 3). The statistical significance of the difference between two means was calculated using t‐test, **P < 0.01. I) Immunofluorescent microscopy analysis of perilipin 1 in adipogenic precursors transfected with CYP1B1‐plasmid or empty vector at 7 d of adipogenic differentiation (left). Scale bars, 50 µm. Immunofluorescence (perilipin 1) positive area was calculated in right. Data were presented as means ± SEM (n = 3). The statistical significance of difference between the two means was calculated using ttest, **P < 0.01. J) Pseudotime trajectories developed through Monocle analysis for CD142‐like FAP subpopulation (left). Developmental trajectory of CD142‐like FAPs subpopulations inferred by RNA velocity and visualized on the PCA projection (right).
Figure 3
Figure 3
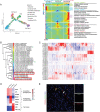
Pseudotime analyses of FAPs and the heterogeneity of FAP subpopulations among pig breeds. A) Pseudotime ordering of all FAPs subpopulations. Each dot represents one cell and each branch represents one cell state (left). Heatmap illustrating the differentially expressed genes (DEGs) dynamics towards myocyte‐like FAPs and tenocytes/adipocytes fate along pseudotime (right). The DEGs were clustered into 5 gene sets according to k‐means. GO terms enriched for each gene set were labeled in the right panel. Tenocytes FAPs fated represents cell fate A, adipocytes fated represents cell fate B, while myocyte‐like FAPs represent cell fate C. B‐C) Comparison of wild boars, Laiwu pigs, and Duroc pigs FAPs subsets. (B) Orthologous wild boar, Laiwu pig, and Duroc pig subpopulations were established by hierarchal clustering. (C) Heatmap showing genes similarly enriched within wild boars, Laiwu pigs, and Duroc pigs. D) Heatmap of differentially expressed genes across dc FAPs‐0 and 8 subsets (both defined as committed preadipocyte) and a dc FAPs‐6 (defined as tenocyte) as a control. E) Immunofluorescent images of PDGFRa+PCNA+ FAPs in pig skeletal muscle. White arrowheads denote FAPs that are positive for PCNA (scale, 50 µm). Yellow arrowheads mark FAPs that are negative for expression of PCNA. dc: Duroc pigs, lw: Laiwu pigs, wb: wild boars.
Figure 4
Figure 4
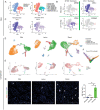
Identification and trajectory analysis of myogenic lineages in neonatal pigs. A) Myogenic lineage cluster (satellite cells, myoblasts, and myocytes) from wild boars were selected and re‐analyzed. tSNE plot colored by myogenic lineage cluster (left) and manual classified cell subsets (right). B) t‐SNE maps showing the expression levels of genes related to muscle maturation and Ca2+ binding capacity in two myoblast subpopulations. C) Fast and slow myocytes recognized by established myofiber type‐specific markers (MYL1 and MYL2 respectively). D, F) Developmental trajectory of myogenic lineages subpopulations inferred by RNA velocity and visualized on the UMAP (D) and PCA projection (F). E) UMAP map displaying cell cycle stage of each cell [S (blue), G2/M (green), G1 (pink)] assigned by the CellCycleScoring function in Seurat. G) Representative confocal images of PAX7 (green) and KI67 (red)‐ immunostained skeletal muscle of wild boars, Duroc, and Laiwu pigs (scale, 200 µm). Percentage of KI67+PAX7+ cells (normalized to DAPI cells) in wild boars (blue), Laiwu (red), and Duroc pigs (green). Data were presented as means ± SEM (n = 3), *P < 0.05.
Figure 5
Figure 5
Comparison of heterogeneity and myogenesis potential of myogenic lineages among pig breeds. A‐B) Comparison of wild boars, Laiwu, and Duroc pig myogenic lineage subpopulations. C) Monocle reverse graph showing a joint trajectory comparing the myogenic trajectories of three pig breeds of indicated myogenic lineage subpopulations. Graph colored by pig breeds. D) Distribution of myogenic lineage subpopulations in each breed. E) Immunofluorescent microscopy analysis of the morphological changes and expression of MYOSIN in myogenic precursors of wild boars, Duroc, and Laiwu pigs at 48 h of differentiation. dc: Duroc pigs, lw: Laiwu pigs, wb: wild boars.
Figure 6
Figure 6
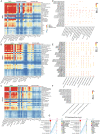
The ligand‐receptor interaction network analysis across skeletal cell types. A‐C) Heat map depicting the number of all possible interactions between the clusters analyzed in wild boars (A), Laiwu pigs (B), or Duroc pigs (C). Cell types are grouped by broad lineage (FAPs, myogenic lineages cells, or immune cells). D‐F) Dot plot depicting selected ligand‐receptor interactions between immune cell subpopulations and other cell types (D), mesenchymal stem cells(MSCs) and other cell types (E), COL11A1+ tenocytes, and other cell types (F). An interaction is indicated as color‐filled circle at the cross of interacting cell types in a tissue (x‐axis) and a ligand‐receptor pair (y‐axis), with circle size representing the significance of −log10P values in a permutation test and colors representing the means of the average expression level of the interacting pair. G) Hierarchical plot shows the inferred intercellular communication network (a case of specific OSTN signaling pathway in Laiwu pigs). Solid and open circles represent source and target, respectively. Circle sizes are proportional to the number of cells in each cell group. Edge colors are consistent with the signaling source.
Figure 7
Figure 7
Divergent gene expression patterns across skeletal muscle–derived cell‐types among pig breeds. A) Patterns of expression change among pig breeds. Top, number of genes with expression divergence restricted to each cell types and broad class of cell types. B) Comparison of expression levels among pig breeds for MSCs. Genes outside the blue lines have highly divergent expression (>fivefold change) and include cluster‐ specific markers (orange dots). C‐E) The regulated pathways among pig breeds are displayed in a heatmap (C, wild boars versus Laiwu pigs; D, Duroc pigs versus Laiwu pigs; E, wild boars versus Duroc pigs). The color represents the NES for each pathway and gray indicates no significant difference in pathways. F) GSEA in cell cycle, drug metabolism cytochrome p450, and JAK‐STAT pathways. At the bottom of each panel shows a heatmap of representative genes found within the leading edge‐subset of the biological pathway. The color intensity represents median‐centered gene expression (FPKM) with red and blue representing highly and lowly expressed genes, respectively.
Figure 8
Figure 8
The role of JAK/STAT3 and Hedgehog signaling pathways in adipogenic differentiation. A) Immunofluorescent microscopy analysis of perilipin 1 in adipogenic precursors from wild boars, Laiwu, and Duroc pigs after 9 d of adipogenic differentiation. Scale bars, 50 µm. Immunofluorescence (perilipin 1) positive area was calculated at right. B) The proliferative potential of adipogenic precursors from wild boars, Laiwu, and Duroc pigs was measured by EdU staining. Scale bars, 50 µm. C) STAT3 and p‐STAT3 (Tyr705) levels of adipogenic precursors from Duroc pigs treated with DMSO control or 5 µM Stattic (a JAK/STAT signaling pathway inhibitor) in GM for 12 h. n = 3. D) Adipogenic precursors from Duroc pigs were treated with DMSO control or 5uM Stattic in GM for 12 h. Cell proliferation was measured by EdU staining. Scale bars, 100 µm. E) Immunofluorescent microscopy analysis of perilipin 1 in adipogenic precursors from Duroc pigs following 9 d of adipogenic induction and DMSO control or 5 µM Stattic treatment for the first 72 h. Scale bars, 50 µm. F) GLI1 and SMO levels of adipogenic precursors from Laiwu pigs treated with DMSO control or 10 µM Vismodegib (a Hedgehog signaling pathway inhibitor) in GM for 24 h. n = 3. G) Adipogenic precursors from Laiwu pigs were treated with DMSO control or 10 µM Vismodegib in GM for 24 h. Cell proliferation was measured by EdU staining. Scale bars, 100 µm. H) Immunofluorescent microscopy analysis of perilipin 1 in adipogenic precursors from Laiwu pigs following 9 d of adipogenic induction and DMSO control or 10 µM Vismodegib treatment for the first 72 h. Scale bars, 50 µm. Data are presented as means ± SEM. An unpaired Student's ttest was used. CTRL, contral; VISM, Vismodegib. n = 3, *P < 0.05, **P < 0.01.
Figure 9
Figure 9
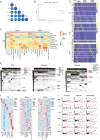
Comparison of skeletal muscle expression profiles across species. A) Correlation analysis of scRNA‐seq data of pig skeletal muscle (Duroc, Laiwu, and Wild) against human skeletal muscle,[48b] as well as mouse skeletal muscle.[9c] B) Principal component analysis to assess transcriptome similarity of pig skeletal muscle to human and mouse skeletal muscle. C) Comparison of cell types between human (column, left), mouse (column, right), and pig (row). Crosses indicate that the corresponding cell types are the best match. Color bars represent each cell type. D) Heatmap showing scaled expression levels of representative genes of pig skeletal muscle (top), human skeletal muscle (middle), or mouse skeletal muscle (bottom), with genes ordered into those common to species, or specific to either species for homologous cell types. E) Binary plots depicting active regulons in single cells from pig, mouse, and human datasets; regulons and cells are ordered by hierarchical clustering. F) Heatmaps of TF expression in pig, mouse, and the human respectively, identified in SCENIC analysis mentioned above. 186 regulons active in both species are shown. G) Pearson correlation of scRNA‐seq expression (UMI count) of susceptibility genes for (from top to bottom) Becker muscular dystrophy (BMD), Congenital myopathies (CM), Inclusion Body Myositis (IBM), Duchenne muscular dystrophy (DMD), Myotonic dystrophy (MD) and Spinal muscular atrophy (SMA) susceptibility genes. Species from left to right: pig versus human, pig versus mouse, and human versus mouse.

References

    1. Ai H., Fang X., Yang B., Huang Z., Chen H., Mao L., Zhang F., Zhang L., Cui L., He W., Yang J., Yao X., Zhou L., Han L., Li J., Sun S., Xie X., Lai B., Su Y., Lu Y., Yang H., Huang T., Deng W., Nielsen R., Ren J., Huang L., Nat. Genet. 2015, 47, 217. - PubMed
    1. Giuffra E., Kijas J. M. H., Amarger V., Carlborg Ö., Jeon J.‐T., Andersson L., Genetics 2000, 154, 1785. - PMC - PubMed
    1. Zhang S., Bidanel J.‐P., Burlot T., Legault C., Naveau J., Genet Sel. Evol. 2000, 32, 57. - PMC - PubMed
    1. a) Zecchini S., Giovarelli M., Perrotta C., Morisi F., Touvier T., Di Renzo I., Moscheni C., Bassi M. T., Cervia D., Sandri M., Clementi E., De Palma C., Autophagy 2019, 15, 58; - PMC - PubMed
    2. b) Murphy M., Kardon G., Curr. Top. Dev. Biol. 2011, 96, 21621065; - PMC - PubMed
    3. c) Stockdale F. E., Dev Biol. 1992, 154, 284. - PubMed
    1. Huang Y., Zhou L., Zhang J., Liu X., Zhang Y., Cai L., Zhang W., Cui L., Yang J., Ji J., Xiao S., Ai H., Chen C., Ma J., Yang B., Huang L., Meat Sci. 2020, 168, 108182. - PubMed

Publication types

LinkOut - more resources