. 2024 Jun 1;79(6):1337-1351.
doi: 10.1097/HEP.0000000000000648. Epub 2023 Oct 23.

Wnt/β-catenin and NFκB signaling synergize to trigger growth factor-free regeneration of adult primary human hepatocytes

Affiliations

Wnt/β-catenin and NFκB signaling synergize to trigger growth factor-free regeneration of adult primary human hepatocytes

Nuria Oliva-Vilarnau et al. Hepatology. .

Abstract

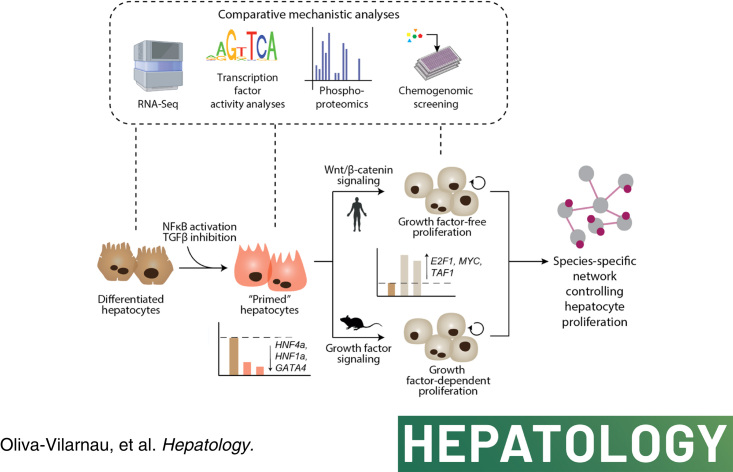
Background and aims: The liver has a remarkable capacity to regenerate, which is sustained by the ability of hepatocytes to act as facultative stem cells that, while normally quiescent, re-enter the cell cycle after injury. Growth factor signaling is indispensable in rodents, whereas Wnt/β-catenin is not required for effective tissue repair. However, the molecular networks that control human liver regeneration remain unclear.

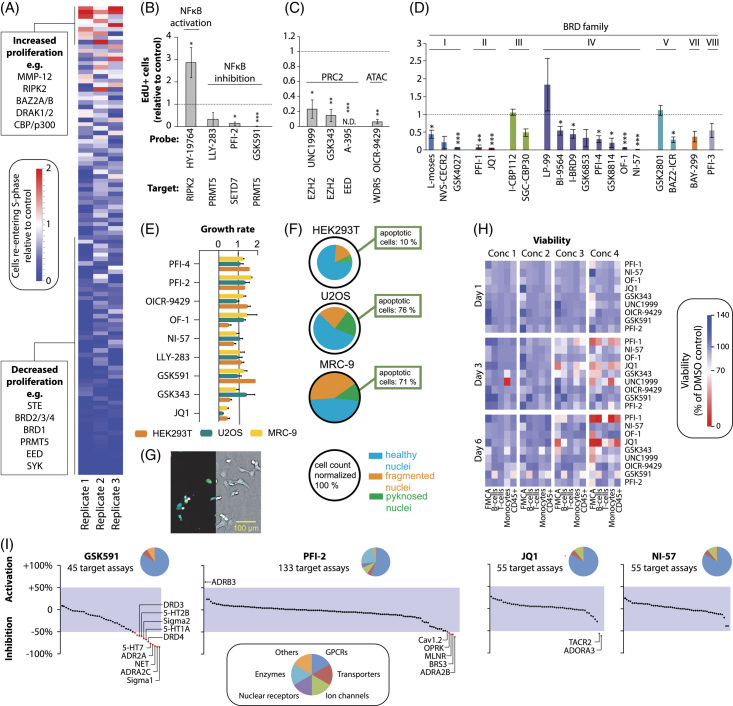
Methods: Organotypic 3D spheroid cultures of primary human or murine hepatocytes were used to identify the signaling network underlying cell cycle re-entry. Furthermore, we performed chemogenomic screening of a library enriched for epigenetic regulators and modulators of immune function to determine the importance of epigenomic control for human hepatocyte regeneration.

Results: Our results showed that, unlike in rodents, activation of Wnt/β-catenin signaling is the major mitogenic cue for adult primary human hepatocytes. Furthermore, we identified TGFβ inhibition and inflammatory signaling through NF-κB as essential steps for the quiescent-to-regenerative switch that allows Wnt/β-catenin-induced proliferation of human cells. In contrast, growth factors, but not Wnt/β-catenin signaling, triggered hyperplasia in murine hepatocytes. High-throughput screening in a human model confirmed the relevance of NFκB and revealed the critical roles of polycomb repressive complex 2, as well as of the bromodomain families I, II, and IV.

Conclusions: This study revealed a network of NFκB, TGFβ, and Wnt/β-catenin that controls human hepatocyte regeneration in the absence of exogenous growth factors, identified novel regulators of hepatocyte proliferation, and highlighted the potential of organotypic culture systems for chemogenomic interrogation of complex physiological processes.


Conflict of interest statement

Volker M. Lauschke is employed by and owns stock in HepaPredict. He owns stock in PersoMedix. The remaining authors have no conflicts to report.

Figures

None
Graphical abstract
FIGURE 1
FIGURE 1
In the absence of priming factors, differentiated primary human hepatocytes are resistant to Wnt/β-catenin-mediated and growth factor-mediated cell cycle re-entry. A, Repopulation of FRGN mice with suspensions of isolated fully mature hepatocytes (“Cells”) or isogenic liver spheroids (“Spheroids”). The extent of repopulation is determined by measuring human albumin in the serum of the recipient mice every 2 weeks. Note that not every mouse was measured at each timepoint. B, Immunofluorescent images of liver sections from repopulated mice stained with antibody against human nuclei (red). Sections are counterstained with DAPI (blue), which binds to the genomic DNA of both mice and human nuclei. C, Schematic showing the different experimental setups. PHH is exposed to “GF” or the Wnt/β-catenin agonist CHIR99021 (“GSK3β inhibition”) either during the first 5 days of culture (d0–d5; setup 1) in which spheroids are forming or for 5 days (d6–d11; setup 2) after spheroid formation. D, Expression of hepatocyte markers shown as FPKM during PHH spheroid formation. E, Activity profiles of the cellular reprogramming factors MYC, CEBPB, E2F1, and ELK1 during spheroid aggregation. Logos of the binding motif sequences are shown. F, EdU stainings of PHH treated during or after spheroid formation with the Wnt/β-catenin agonist CHIR99021, the GFs EGF and HGF, or both. G, Fraction of hepatocytes re-entering the cell cycle (EdU+) in both experimental setups. H, Knock-down of β-catenin (CTNNB1) abolishes the ability of GSK3β inhibition to induce PHH proliferation. I, Representative EdU and β-catenin stainings for control and CTNNB1 siRNA-treated PHH. J–K, Linear regression of EdU incorporation rates of PHH treated 5 days with CHIR99021 (J) or GFs (K) with progressing spheroid aggregation. Error bars indicate SEM. *, ** and **** corresponds to p < 0.05, p < 0.01 and p < 0.0001 compared to vehicle controls, respectively. Scale bars = 40 μm. Abbreviations: FPKM, fragments per kilobase of transcript per million mapped reads; GF, growth factors; PHH, Primary human hepatocytes.
FIGURE 2
FIGURE 2
Activation of cytokines and inhibition of TGFβ signaling renders primary human hepatocytes susceptible to Wnt/β-catenin-mediated proliferation. A, The activity profile of the TGFβ signal transducer SMAD4 is decreased during spheroid aggregation. The logo depicts the analyzed SMAD4 binding motif. B, Activation of TGFβ signaling using recombinant ligand blocks proliferation of hepatocytes during spheroid aggregation induced by GSK3β inhibition or growth factors. C, EdU staining shows that in fully formed spheroids, TGFβ inhibition is not sufficient to render cells susceptible to the Wnt/β-catenin-mediated induction of proliferation. D, Activity of the NFκB transducer RELA (p65) during spheroid formation. The logo depicts the analyzed RELA binding motif. E–F, EdU staining (E) and quantification thereof (F) for simultaneous repression of TGFβ and exposure to a cocktail of pro-inflammatory cytokines (IL6 and TNF) and GSK3β inhibitor (CHIR99021). G, While GF activates proliferation in TGFβ inhibited hepatocytes treated with cytokines, the synergistic effect is significantly lower than in spheroids treated with GSK3β inhibitor (indicated by dashed lines for each condition). H, Western blots for EGFRY1068 and METY1349 using phospho-specific antibodies show that co-treatment with TGFβ/GSK3β inhibition and cytokines induces hepatocyte proliferation without affecting growth factor receptor phosphorylation. Error bars indicate SEM. **, *** and **** corresponds to p < 0.01, p < 0.001 and p < 0.0001, respectively. Abbreviations: GF, growth factors
FIGURE 3
FIGURE 3
Stimulation of hepatocyte regeneration requires canonical NFκB signaling. (A) Fraction of PHH re-entering cell cycle under different NFκB-activating (TNF and IL1β) and other cytokines or interferons. (B–D) Temporal dynamics of cell cycle re-entry and progression in PHH spheroids as shown by EdU incorporation (S-phase) (B), Ki67 expression (cell cycle marker) (C), and phosphorylation of histone H3 (pHH3; mitosis marker) (D). (E) Representative images for Ki67 and pHH3 immunostainings at day 3 of treatment. (F) Inhibition of NFκB signaling using the small molecule inhibitor BAY-11-7082 or siRNA-mediated RELA knock-down reduces cell cycle re-entry. All treatments in panels A–F are combined with TGFβ inhibition and GSK3β inhibition. (G–I) Volcano plots of phosphoproteomic data show changes in phosphorylation status in spheroids treated with GF (G), GSK3β inhibitor, TGFβ inhibitor, IL6, and TNF (H) or GSK3β inhibitor, TGFβ inhibitor, and IL1β (I). Differentially phosphorylated proteins are shown in red (FC > 2; p < 0.05). (J) Venn diagram showing that the differentially phosphorylated proteins do not overlap between GF and GF-free conditions, indicating that the elicited intracellular signal transduction cascades are fundamentally different. Error bars indicate SEM. *, **, ***, and **** correspond to p < 0.05, p < 0.01, p < 0.001, and p < 0.0001 compared to the respective vehicle or control siRNA, respectively. Scale bars = 40 μm. Abbreviations: GF, growth factors; GO, gene ontology; pHH3, phosphorylation of histone H.
FIGURE 4
FIGURE 4
RNA sequencing identifies NFκB signaling and repression of hepatic maturation factors as key steps for hepatocyte cell cycle re-entry. (A–B) Volcano plots showing upregulated and downregulated genes compared to vehicle. Genes associated with different GO terms are colored. Hepatocyte spheroids were treated for 48 h with GSK3β inhibitor (“GSK3βi”), TGFβ inhibitor (“TGFβi”), TNF, and IL6 (A) or with GSK3βi, TGFβi, and IL1β (B). (C) Venn diagram showing the overlap of significantly upregulated and downregulated genes (FC > 2; p < 0.05 in a heteroscedastic t-test) between TGFβi/GSK3βi and acute-phase cytokines. The associated top significantly enriched pathways are indicated. (D) Mean-centered sigma-normalized heatmap representation of differentially expressed genes after hierarchical clustering (F-test, q < 0.05). (E) PCA of the top 100 transcription factor motif activities inferred in triplicates from RNA sequencing data. (F) Difference in transcription factor motif activity (ΔTF) between the different treatment conditions and the vehicle in hepatocyte spheroids. (G), Transcription factor motif activity for NFκB members, key hepatocyte differentiation factors, important cell cycle regulators, and transcription factors implicated in cellular reprogramming. Abbreviations: GO, gene ontology; PCA, Principal component analysis
FIGURE 5
FIGURE 5
The molecular control of hepatocyte proliferation is species-specific. A–B, Representative images (A) and quantifications of EdU incorporation (B) of primary murine and human hepatocytes during spheroid formation. (C–D) Representative images (C) and quantifications of EdU incorporation (D) of formed primary human and murine hepatocytes treated with acute-phase cytokines in combination with GSK3β inhibitor and TGFβ inhibition. Error bars indicate SEM. ** and **** corresponds to p < 0.01 and p < 0.0001, respectively. Scale bars = 40 μm.
FIGURE 6
FIGURE 6
Chemogenomic screen reveals the importance of epigenetic plasticity for human hepatocyte regeneration. (A) Heatmap representation of EdU quantification data of all 108 tested probes in biological triplicates. (B) Effects of NFκB modulators on cell cycle re-entry. (C) Inhibition of the histone methyltransferase and acetyltransferase complexes PRC2 and ATAC significantly reduce proliferation. (D) Effects of BRD inhibition stratified by BRD families. N ≥ 3 for all probes in panels (B–D). (E) Analysis of the effects of selected compounds on growth rates in HEK293T, U2OS, and MRC-9 cells. Compounds were tested in duplicates, and the complete screen was performed twice. (F) Multiplex live-cell assay showing the fraction of healthy, fragmented, and pyknosed nuclei after 24 h of exposure to JQ1. The sizes of the pie charts indicate the normalized cell count. The average data of 2 biological replicates are shown. (G) Representative fluorescent (left) and brightfield image (right) of stained (blue: DNA, green: microtubule, red: mitochondria, and magenta: Annexin V apoptosis marker) U2OS cells after 24 h of JQ1 exposure. (H) Viability of a selection of hit compounds was analyzed using separate FMCA ( n = 3) analysis and flow cytometry of peripheral blood mononuclear cells for B-cells (CD19+), T-cells (CD3+), monocytes (CD14+), and all leukocytes (CD45+). Concentration ranges for each compound are provided in Supplemental Table 6, http://links.lww.com/HEP/I67. (I) Secondary pharmacology screen of selected hit compounds. In total, 150 binding assays covering G protein-coupled receptors (n = 87), ion channels (n = 12), transporters (n = 6), nuclear receptors (n = 6), enzymes (n = 31) and others (n = 8) were evaluated. Off-target effects were defined as > 50% inhibition or activation (red dots). Error bars indicate SEM. *, **, *** and **** corresponds to p < 0.05, p < 0.01, p < 0.001 and p < 0.0001, respectively. Abbreviation: ATAC, Ada2a-containing; BRD, bromodomain; FMCA, fluorometric microculture cytotoxicity assay; PRC2, polycomb repressive complex 2.

Comment in

References

    1. Michalopoulos GK. Liver regeneration. J Cell Physiol. 2007;213:286–300. - PMC - PubMed
    1. Miyaoka Y, Ebato K, Kato H, Arakawa S, Shimizu S, Miyajima A. Hypertrophy and unconventional cell division of hepatocytes underlie liver regeneration. Curr Biol. 2012;22:1166–1175. - PubMed
    1. MacDonald RA. Lifespan of liver cells: Autoradiographic study using tritiated thymidine in normal, cirrhotic, and partially hepatectomized rats. Arch Intern Med. 1961;107:335–343. - PubMed
    1. Wang MJ, Chen F, Li JX, Liu CC, Zhang HB, Xia Y, et al. . Reversal of hepatocyte senescence after continuous in vivo cell proliferation. Hepatology. 2014;60:349–361. - PubMed
    1. Chembazhi UV, Bangru S, Hernaez M, Kalsotra A. Cellular plasticity balances the metabolic and proliferation dynamics of a regenerating liver. Genome Res. 2021;31:576–591. - PMC - PubMed

Publication types