. 2024 Jan 17;30(2):356-367.
doi: 10.1158/1078-0432.CCR-23-1013.

Developing and Validating a Multivariable Prognostic-Predictive Classifier for Treatment Escalation of Oropharyngeal Squamous Cell Carcinoma: The PREDICTR-OPC Study

Affiliations

Developing and Validating a Multivariable Prognostic-Predictive Classifier for Treatment Escalation of Oropharyngeal Squamous Cell Carcinoma: The PREDICTR-OPC Study

Hisham Mehanna et al. Clin Cancer Res. .

Abstract

Purpose: While there are several prognostic classifiers, to date, there are no validated predictive models that inform treatment selection for oropharyngeal squamous cell carcinoma (OPSCC).Our aim was to develop clinical and/or biomarker predictive models for patient outcome and treatment escalation for OPSCC.

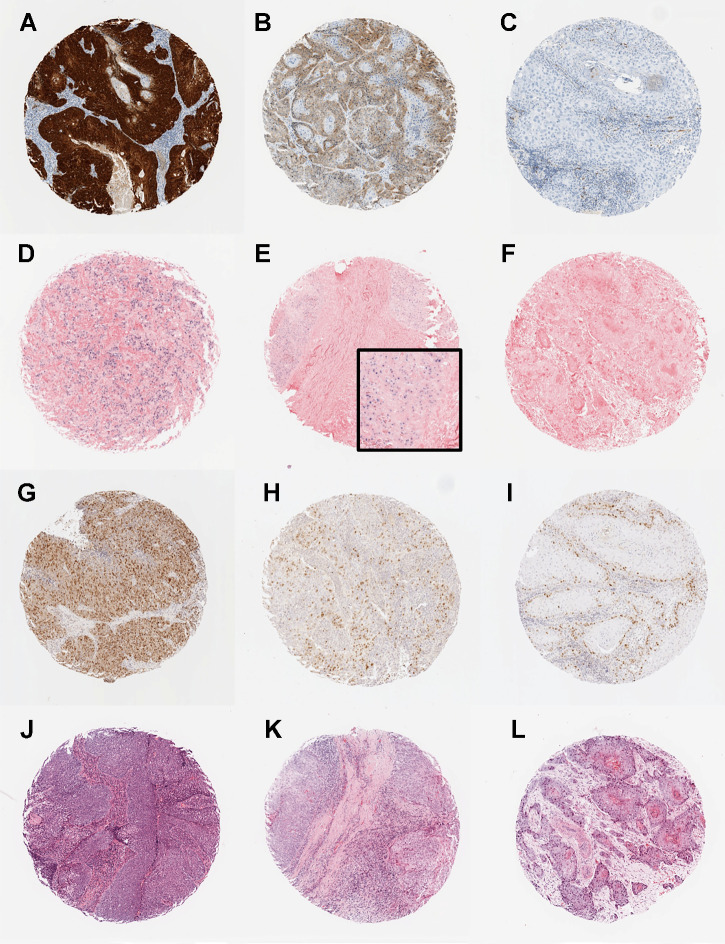
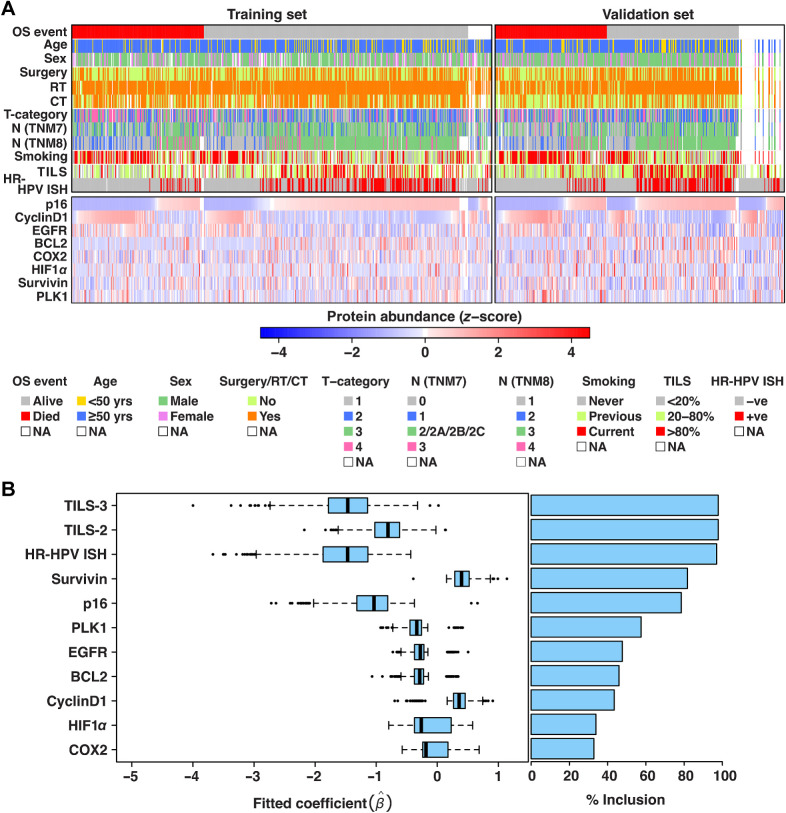
Experimental design: We retrospectively collated clinical data and samples from a consecutive cohort of OPSCC cases treated with curative intent at ten secondary care centers in United Kingdom and Poland between 1999 and 2012. We constructed tissue microarrays, which were stained and scored for 10 biomarkers. We then undertook multivariable regression of eight clinical parameters and 10 biomarkers on a development cohort of 600 patients. Models were validated on an independent, retrospectively collected, 385-patient cohort.

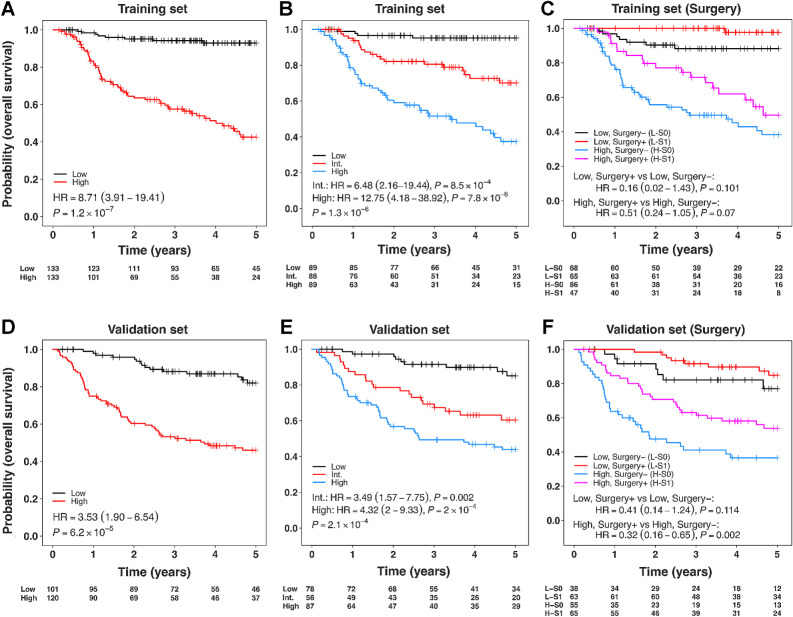
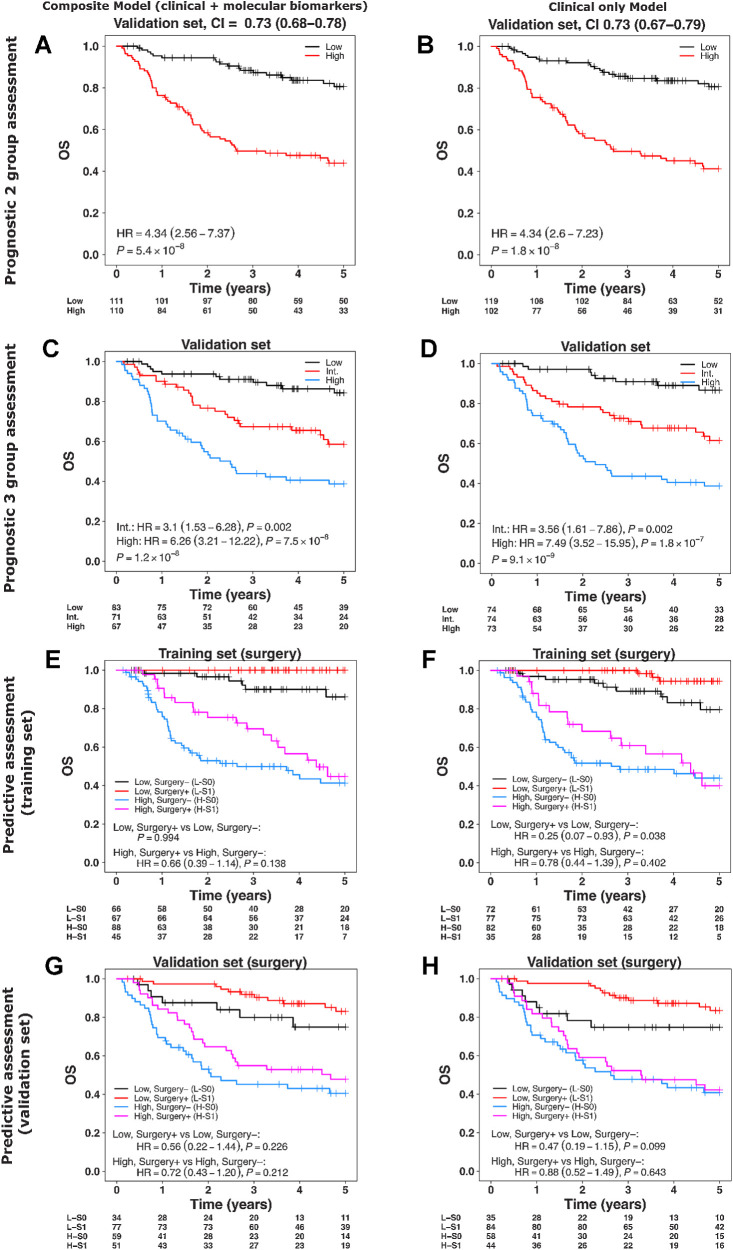
Results: A total of 985 subjects (median follow-up 5.03 years, range: 4.73-5.21 years) were included. The final biomarker classifier, comprising p16 and survivin immunohistochemistry, high-risk human papillomavirus (HPV) DNA in situ hybridization, and tumor-infiltrating lymphocytes, predicted benefit from combined surgery + adjuvant chemo/radiotherapy over primary chemoradiotherapy in the high-risk group [3-year overall survival (OS) 63.1% vs. 41.1%, respectively, HR = 0.32; 95% confidence interval (CI), 0.16-0.65; P = 0.002], but not in the low-risk group (HR = 0.4; 95% CI, 0.14-1.24; P = 0.114). On further adjustment by propensity scores, the adjusted HR in the high-risk group was 0.34, 95% CI = 0.17-0.67, P = 0.002, and in the low-risk group HR was 0.5, 95% CI = 0.1-2.38, P = 0.384. The concordance index was 0.73.

Conclusions: We have developed a prognostic classifier, which also appears to demonstrate moderate predictive ability. External validation in a prospective setting is now underway to confirm this and prepare for clinical adoption.


Figures

Figure 1. Photomicrographs showing examples of the biomarkers in the predictive classifier: p16 immunohistochemistry (A–C), high-risk HPV in situ hybridization (D–F), survivin immunohistochemistry (G–I), and TILs (J–L). A, p16-positive tumor showing strong and diffuse nuclear and cytoplasmic staining. B, p16-negative tumor showing weak and diffuse cytoplasmic staining. C, p16-negative tumor with no staining. D–E, High-risk HPV-positive tumors showing diffuse nuclear and cytoplasmic staining (D) and punctate nuclear staining (E). F, High-risk HPV-negative tumor with no staining. G–I, Survivin staining showing tumors with high (G), medium (H), and low (I) H-scores. J–L, Cases with high (J), moderate (K), and low (L) TILs.
Figure 1.
Photomicrographs showing examples of the biomarkers in the predictive classifier: p16 immunohistochemistry (A–C), high-risk HPV in situ hybridization (D–F), survivin immunohistochemistry (G–I), and TILs (J–L). A, p16-positive tumor showing strong and diffuse nuclear and cytoplasmic staining. B, p16-negative tumor showing weak and diffuse cytoplasmic staining. C, p16-negative tumor with no staining. D–E, High-risk HPV-positive tumors showing diffuse nuclear and cytoplasmic staining (D) and punctate nuclear staining (E). F, High-risk HPV-negative tumor with no staining. G–I, Survivin staining showing tumors with high (G), medium (H), and low (I) H-scores. J–L, Cases with high (J), moderate (K), and low (L) TILs.
Figure 2. A, Heatmaps summarizing the molecular and clinical data from training and validation sets. Rows contain clinical covariates and molecular biomarkers, while columns contain patients. Protein abundance H-scores (range: 0–300) were divided by 30 and Z transformed (μ = 0, σ = 1) for training and validation sets separately. Column order in each of the training and validation sets was determined by first sorting (low to high Z-score) on the protein biomarkers one by one (bottom up) and then OS event. B, Box plots displaying range of fitted coefficients including 25th percentile (Q1), median, and 75th percentile (Q3). To test the stability of the variables selected in the multivariable model, bootstrapping was performed on the training cohort (1,000 times) and Cox proportional hazards model was fitted with backward elimination on each subset. For each bootstrap iteration, coefficients of the resulting variables selected by the model are displayed in the box plots alongside their % frequency of inclusion over 1,000 iterations. Bootstrapping results confirmed the relative importance of variables in our original model (Supplementary Table S6), as these were ranked among the top recurrently selected variables over 1,000 iterations. Upper whisker of the box plots indicates: min (max(x), Q3 + 1.5 × IQR) and lower whisker indicates: max (min(x), Q1–1.5 × IQR) where IQR = Q3−Q1. Color key: TILS-3 = high, TILS-2 = moderate, TILS-1 = low.
Figure 2.
A, Heatmaps summarizing the molecular and clinical data from training and validation sets. Rows contain clinical covariates and molecular biomarkers, while columns contain patients. Protein abundance H-scores (range: 0–300) were divided by 30 and Z transformed (μ = 0, σ = 1) for training and validation sets separately. Column order in each of the training and validation sets was determined by first sorting (low to high Z-score) on the protein biomarkers one by one (bottom up) and then OS event. B, Box plots displaying range of fitted coefficients including 25th percentile (Q1), median, and 75th percentile (Q3). To test the stability of the variables selected in the multivariable model, bootstrapping was performed on the training cohort (1,000 times) and Cox proportional hazards model was fitted with backward elimination on each subset. For each bootstrap iteration, coefficients of the resulting variables selected by the model are displayed in the box plots alongside their % frequency of inclusion over 1,000 iterations. Bootstrapping results confirmed the relative importance of variables in our original model (Supplementary Table S6), as these were ranked among the top recurrently selected variables over 1,000 iterations. Upper whisker of the box plots indicates: min (max(x), Q3 + 1.5 × IQR) and lower whisker indicates: max (min(x), Q1–1.5 × IQR) where IQR = Q3−Q1. Color key: TILS-3 = high, TILS-2 = moderate, TILS-1 = low.
Figure 3. A–C, Prognostic and predictive assessment of risk groups predicted by multivariable survival model (trained with backward elimination using AIC) based on molecular biomarkers only with OS, when applied to the training cohort. D–F, Prognostic and predictive assessment of risk groups predicted by the molecular biomarkers only multivariable model, when applied to the validation cohort. Risk groups in the validation cohort were created using the thresholds (two-group classification: median risk score; three-group classification: tertiles of risk score) derived from the training set. Color key A, D: black = low-risk group, red = high-risk group; B, E: black = low-risk, red = intermediate (Int.)-risk, Blue=high-risk group; C, F: Red = low-risk surgery, black = low-risk no surgery, pink = high-risk surgery, blue = high-risk no surgery group. Models were adjusted for clinical covariates: T-category, N-category, smoking status, age, radiotherapy, and chemotherapy.
Figure 3.
A–C, Prognostic and predictive assessment of risk groups predicted by multivariable survival model (trained with backward elimination using AIC) based on molecular biomarkers only with OS, when applied to the training cohort. D–F, Prognostic and predictive assessment of risk groups predicted by the molecular biomarkers only multivariable model, when applied to the validation cohort. Risk groups in the validation cohort were created using the thresholds (two-group classification: median risk score; three-group classification: tertiles of risk score) derived from the training set. Color key A, D: black = low-risk group, red = high-risk group; B, E: black = low-risk, red = intermediate (Int.)-risk, Blue=high-risk group; C, F: Red = low-risk surgery, black = low-risk no surgery, pink = high-risk surgery, blue = high-risk no surgery group. Models were adjusted for clinical covariates: T-category, N-category, smoking status, age, radiotherapy, and chemotherapy.
Figure 4. Multivariable survival modelling (trained with backward elimination using AIC) for composite (molecular biomarkers + clinical factors) and clinical factors only with OS. A–D, Assessment of composite and clinical only models in the validation cohort split into two and three risk groups. E–H, Assessment of composite and clinical only models’ predicted risk groups (low- and high-risk) stratified by surgery in the training (E and F) and validation cohorts (G and H). Risk groups in the validation cohort were created using the thresholds (two-group classification: median; three-group classification: tertiles) derived from the training set. In E, the estimate of HR (95% CI) was not possible due to absence of events in low, surgery+ group. Color key: same as Fig. 3.
Figure 4.
Multivariable survival modelling (trained with backward elimination using AIC) for composite (molecular biomarkers + clinical factors) and clinical factors only with OS. A–D, Assessment of composite and clinical only models in the validation cohort split into two and three risk groups. E–H, Assessment of composite and clinical only models’ predicted risk groups (low- and high-risk) stratified by surgery in the training (E and F) and validation cohorts (G and H). Risk groups in the validation cohort were created using the thresholds (two-group classification: median; three-group classification: tertiles) derived from the training set. In E, the estimate of HR (95% CI) was not possible due to absence of events in low, surgery+ group. Color key: same as Fig. 3.

References

    1. Marur S, D'Souza G, Westra WH, Forastiere AA. HPV-associated head and neck cancer: a virus-related cancer epidemic. Lancet Oncol 2010;11:781–9. - PMC - PubMed
    1. Chaturvedi AK, Engels EA, Pfeiffer RM, Hernandez BY, Xiao W, Kim E, et al. Human papillomavirus and rising oropharyngeal cancer incidence in the United States. J Clin Oncol 2011;29:4294–301. - PMC - PubMed
    1. Louie KS, Mehanna H, Sasieni P. Trends in head and neck cancers in England from 1995 to 2011 and projections up to 2025. Oral Oncol 2015;51:341–8. - PubMed
    1. Mehanna H, Franklin N, Compton N, Robinson M, Powell N, Biswas–Baldwin N, et al. Geographic variation in human papillomavirus-related oropharyngeal cancer: data from 4 multinational randomized trials. Head Neck 2016;38Suppl 1:E1863–9. - PMC - PubMed
    1. Mehanna H, Beech T, Nicholson T, El-Hariry I, McConkey C, Paleri V, et al. Prevalence of human papillomavirus in oropharyngeal and nonoropharyngeal head and neck cancer–systematic review and meta-analysis of trends by time and region. Head Neck 2013;35:747–55. - PubMed

Publication types

MeSH terms